- Market Value (2025): USD 13.6 Bn
- Estimated Value (2026): USD 14.9 Bn
- Forecast Value (2036): USD 35.5 Bn
- CAGR (2026-2036): 9.1%
What is the Low-Drag Satellite Platforms Market forecast to be worth by 2036?
USD 14.9 billion in 2026 to USD 35.5 billion by 2036 at a 9.1% CAGR.
- The Low-Drag Satellite Platforms Market reached USD 13.6 billion in 2025.
- Demand is projected to increase from USD 14.9 billion in 2026 to USD 35.5 billion by 2036.
- The market is forecast to record 9.1% CAGR from 2026 to 2036 as Earth observation operators and defence mission teams seek lower-altitude platforms with controlled drag exposure.
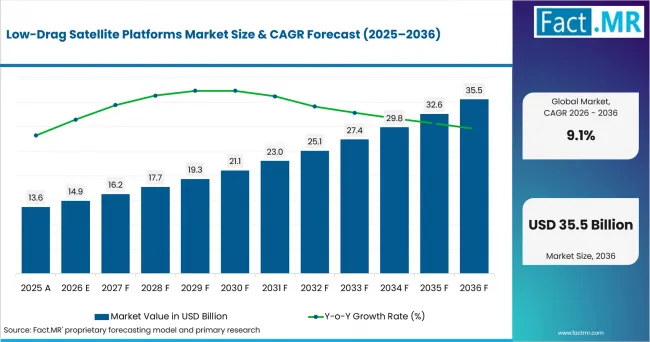
Low Drag Satellite Platforms Market Value Analysis | Source: Fact.MR
What are the defining numbers behind Low-Drag Satellite Platforms Market growth?
An absolute opportunity of USD 20.6 billion is expected between 2026 and 2036.
- Demand Drivers in the Market
- Earth observation teams need slim buses that keep steady pointing in low orbit. In August 2025, the Federal Aviation Administration marked its 1,000th licensed or permitted commercial space operation. A deep launch base gives new low-orbit missions more paths to flight.
- Defence teams need compact buses that can be built in steady batches. Large LEO fleets favor common bus links and known flight behavior across many craft. A common bus also gives each payload team the same basic power and control layout.
- Fleet teams need steady drag control so low height stays practical through the mission. Electric compensation is forecast to cut the fuel burden from frequent orbit correction. The same control plan can be used each time drag pulls the craft down.
- Bus engineers need shapes and pointing modes that limit the face exposed to air flow. The design must still give the payload clear access and enough power for its task. Slim bus forms can lower drag before extra thrust is used. Careful pointing can add a second layer of control when the payload and solar arrays allow a lower-drag flight pose.
- Key Segments Analyzed
- By Bus Aerodynamics: Slender low-area bus is expected to hold 32.0% share in 2026 owing to the direct link between frontal area and drag in lower orbits.
- By Operating Orbit: 120-180 km is projected to account for 28.0% share in 2026 as platform designs target the highest-drag range within the defined orbit bands.
- By Drag Management: Electric compensation is forecast to capture 35.0% share in 2026 because repeatable low-thrust orbit control fits repeated drag-recovery needs.
- By Mission: Earth observation is estimated to represent 31.0% share in 2026 due to the sensing benefit of flying closer to Earth when platform life is maintained.
- Analyst Opinion at Fact.MR
- Shambhu Nath Jha, Principal Consultant at Fact.MR states, “Low-drag buses face a clear trade between close orbit and control effort. Demand is forecast to favor designs that cut exposed area before adding more thrust. Suppliers should link bus shape and pointing with orbit control so mission teams can judge useful life at the chosen height.”
- Strategic Implications
- Bus builders should map drag area across normal flight attitudes. A clear area estimate lets mission teams compare control needs before they choose a lower flight height.
- Propulsion teams should size electric thrust for the chosen orbit band and expected air density. Clear control margins help mission planners compare useful life across low-height designs.
- Defence program teams should test bus commonality across ISR and Communications missions. Shared bus links can cut fit work when one program needs many craft with related payload and control needs.
The USA is forecast to record 10.1% CAGR through 2036, backed by large LEO defence programs and high launch work. Germany is likely to post 9.8% as public funds expand satnav and Earth observation work. France is forecast to advance at 9.5% owing to compact imaging missions. The UK is forecast to reach 9.1% as LEO Communications programs widen the supplier base. Japan is forecast to hold 7.9% as public funds back domestic space programs.
How does the Low-Drag Satellite Platforms Market break down by segment?
Slender low-area bus leads Bus Aerodynamics at 32.0%; Electric compensation leads Drag Management at 35.0%.
Which Bus Aerodynamics configuration leads?
Slender low-area bus is expected to hold 32.0% share in 2026.
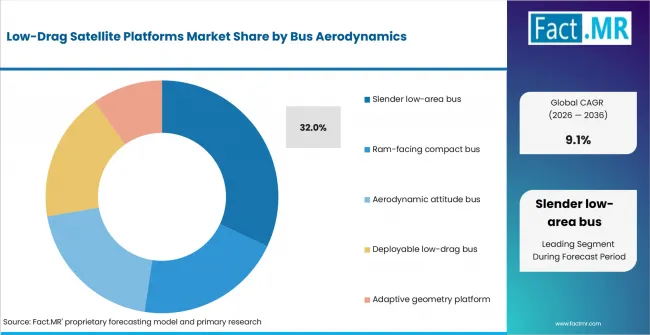
Low Drag Satellite Platforms Market Analysis By Bus Aerodynamics | Source: Fact.MR
Slender low-area buses are forecast to lead because a smaller front face cuts drag. Ram-facing compact buses trade some drag gain for tighter fit. Aerodynamic attitude bus designs use pointing angle as a control tool. Deployable low-drag bus and Adaptive geometry platform concepts add moving parts that need careful tests.
What leads the Operating Orbit segment?
120-180 km is projected to account for 28.0% share in 2026.
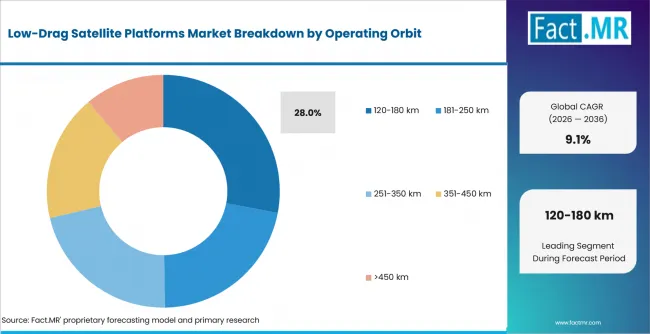
Low Drag Satellite Platforms Market Analysis By Operating Orbit | Source: Fact.MR
The 120-180 km band is forecast to hold 28.0% share in 2026 because drag control is central to bus life in VLEO. Higher bands reduce air drag, but they also reduce some benefits of flying close to Earth. This band puts the bus close enough to gain the most from low flight height. It also asks the control system to work hard enough to offset drag over the planned life of the craft.
How does Drag Management shape demand?
Electric compensation is forecast to capture 35.0% share in 2026.
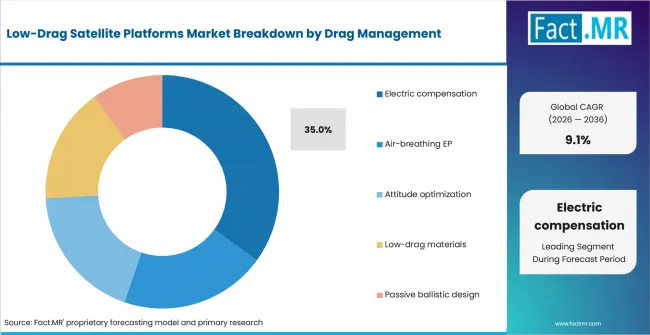
Low Drag Satellite Platforms Market Analysis By Drag Management | Source: Fact.MR
Air-breathing EP links air intake with thrust while passive designs depend more on bus shape and pointing. Electric compensation gives teams a direct way to replace speed lost to drag. The method is expected to suit missions that need steady orbit hold without a large store of chemical fuel.
What supports Earth observation within Mission?
Earth observation is forecast to represent 31.0% share in 2026.
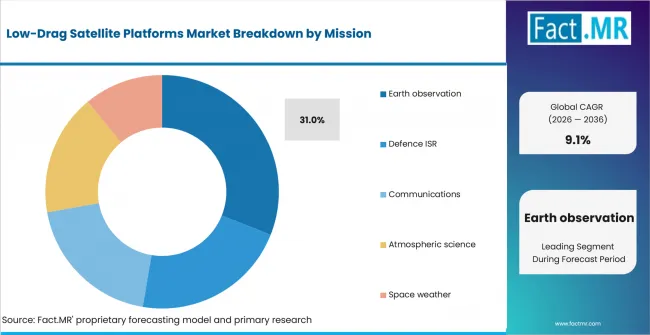
Low Drag Satellite Platforms Market Analysis By Mission | Source: Fact.MR
Earth observation is estimated to lead because low orbit can shorten sensing distance. Defence ISR follows where revisit needs justify more control effort. Communications missions value a shorter path. Atmospheric science and Space weather missions use low-height access for direct measurement. On April 1, 2025, JAXA announced that ALOS-4 had completed its initial calibration and validation operations on March 31 and entered regular observation operations, with observation-data provision beginning sequentially from April 2025.
What is accelerating Low-Drag Satellite Platforms Market adoption, and what is holding it back?
Low-orbit sensing and large LEO systems drive adoption; air drag and orbit-control load restrain it.
Drivers Impact Analysis
| DRIVER | (~) % IMPACT ON CAGR | GEOGRAPHIC RELEVANCE | IMPACT TIMELINE |
|---|---|---|---|
| Lower-altitude Earth observation architectures | +1.4% | USA, France, Germany | Short term (<= 2 years) |
| Proliferated defence and ISR constellations | +1.2% | USA, UK, France | Medium term (2-4 years) |
| Electric station-keeping efficiency | +0.9% | Global | Medium term (2-4 years) |
| Compact bus manufacturing at constellation scale | +0.7% | USA, Europe, Japan | Long term (>= 4 years) |
| Drag-aware attitude and materials design | +0.5% | Global | Long term (>= 4 years) |
Source: Fact.MR analysis. Updated Sep 24, 2026
Opportunity Impact Analysis
| OPPORTUNITY | (~) % IMPACT ON CAGR | GEOGRAPHIC RELEVANCE | IMPACT TIMELINE |
|---|---|---|---|
| Very-low-orbit imaging platforms | +0.9% | USA, Europe, Japan | Medium term (2-4 years) |
| Air-breathing electric propulsion integration | +0.7% | Europe, Japan | Long term (>= 4 years) |
| Defence ISR bus commonality | +0.6% | USA, UK, France | Short term (<= 2 years) |
| Automated drag and lifetime modelling | +0.4% | Global | Medium term (2-4 years) |
Source: Fact.MR analysis. Updated Sep 24, 2026
Restraints Impact Analysis
| RESTRAINT | (~) % IMPACT ON CAGR | GEOGRAPHIC RELEVANCE | IMPACT TIMELINE |
|---|---|---|---|
| Atmospheric density variability | -0.8% | Global | Short term (<= 2 years) |
| Higher station-keeping duty cycle | -0.6% | Global | Medium term (2-4 years) |
| Surface erosion and atomic oxygen exposure | -0.4% | VLEO missions | Long term (>= 4 years) |
| Payload and power trade-offs from low-area geometry | -0.3% | Global | Medium term (2-4 years) |
Source: Fact.MR analysis. Updated Sep 24, 2026
Which countries are scaling the Low-Drag Satellite Platforms Market through 2036?
- The country comparison spans 2.2 percentage points over the forecast period.
- The USA stays 0.3 percentage point above Germany as large LEO defence programs support common small buses.
- Germany remains 0.3 percentage point above France as public space funds support satnav and Earth observation programs.
- France remains 0.4 percentage point above the UK as compact Earth observation missions support low-orbit bus work.
- The UK remains 1.2 percentage points above Japan as LEO Communications programs widen the base for fleet technology.
- Japan closes the displayed range as public space funds support domestic satellite work and Earth observation missions.
Similar CAGRs can still create different entry paths because launch access and mission mix vary by country. Full coverage spans North America, Latin America, Western Europe, Eastern Europe, East Asia, South Asia & Pacific, and Middle East & Africa.
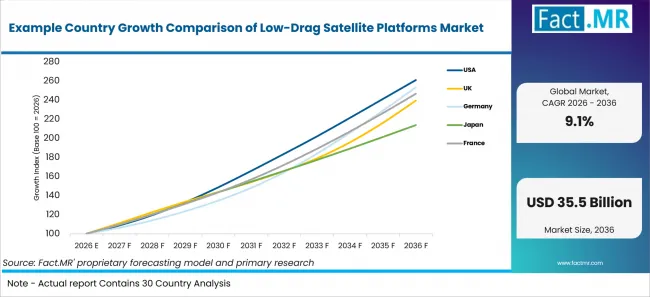
Example Country Growth Comparison Of Low Drag Satellite Platforms Market | Source: Fact.MR
| Country | CAGR (2026-2036) |
|---|---|
| United States | 10.1% |
| Germany | 9.8% |
| France | 9.5% |
| United Kingdom | 9.1% |
| Japan | 7.9% |
Source: Fact.MR analysis. Updated Sep 24, 2026
What supports USA adoption?
10.1% CAGR, backed by large LEO defence programs and high launch activity.
The United States is forecast to record 10.1% CAGR through 2036. In September 2025, Space Systems Command reported that 21 Tranche 1 Transport Layer satellites were successfully delivered on orbit for the Space Development Agency’s Proliferated Warfighter Space Architecture. The launch supports demand for common small buses in large defence fleets. Lower-orbit designs are forecast to place more weight on drag area and orbit control. U.S. mission teams also have a broad base of launch and small-bus skills to draw on. This is expected to support fast build cycles when defence programs need many craft with the same core bus.
What is supporting Germany’s adoption?
9.8% CAGR, shaped by public space funding and LEO navigation programs.
Germany is forecast to post 9.8% CAGR through 2036. The German Aerospace Center said in November 2025 that Germany is contributing about EUR 5.4 billion to ESA programs. The funds support satnav and Earth observation work. Bus suppliers are forecast to gain where compact designs pair exact pointing with sound orbit control. German teams can link those funds with a deep base in space science and precision engineering. This is expected to favor buses that can hold a stable path while keeping drag and power use in check.
How is France developing demand?
9.5% CAGR, led by compact Earth observation missions and sovereign space capability.
France is likely to record 9.5% CAGR through 2036. CNES said in July 2025 that the CO3D constellation uses four small Earth observation satellites. The program supports compact buses with exact pointing and stable flight. Low-drag designs are forecast to gain where missions seek closer imaging and useful mission life. French Earth observation work puts a high value on stable pointing and useful image time. Low-drag buses are expected to appeal where a close orbit can improve mission output without shortening useful life too far.
What supports the United Kingdom’s growth?
9.1% CAGR, supported by LEO links and constellation work.
The United Kingdom is forecast to reach 9.1% CAGR through 2036. The UK Space Agency awarded GBP 16 million in February 2025 to satellite-constellation projects under its C-LEO programme. The funds support a wider base for LEO links. Bus demand is forecast to favor compact designs with sound power and orbit control. UK firms can use the same small-bus skills across civil and secure link missions. This is expected to favor designs that are easy to build in batches and simple to adapt for each payload.
How does Japan perform?
7.9% CAGR, shaped by public space funding and Earth observation programs.
Japan is forecast to grow at 7.9% CAGR through 2036. Japan’s Cabinet Office says the Space Strategy Fund has a target of about JPY 1 trillion and supports three areas: satellites, space transportation, and exploration. Domestic bus work is forecast to gain where low-height missions need slim shapes and efficient orbit control.
Who leads the Low-Drag Satellite Platforms Market?
Airbus Defence and Space and Redwire cover low-orbit platform work. Thales Alenia Space add broad LEO mission support.
Airbus Defence and Space supports high-rate LEO satellite production and Earth-observation platforms, using serial manufacturing capabilities for constellation programs. Redwire has a direct VLEO position through its SabreSat and Phantom spacecraft, both designed for operations in Very Low Earth Orbit. Thales Alenia Space contributes to the IRIS² LEO constellation through digital and secure telecommunications payloads.
York Space Systems also supplies spacecraft for the Space Development Agency’s Transport Layer and has demonstrated high-rate production and deployment of constellation spacecraft.
Competitive differentiation is expected to depend on platform size and mass, pointing performance, manufacturing scale, mission life, orbit requirements, and payload integration. For missions operating at lower orbital altitudes, spacecraft developers may also evaluate aerodynamic drag, propulsion needs, attitude-control performance, and the ability of the platform to maintain mission objectives throughout its intended orbital life.
Which companies are the key providers?
Key companies include Airbus Defence and Space; Thales Alenia Space; Redwire; and York Space Systems.
- Airbus Defence and Space
- Thales Alenia Space
- Redwire
- York Space Systems
Bibliography
- Federal Aviation Administration. (2025, August 14). U.S. Transportation Secretary Duffy, FAA celebrate milestone of 1,000th commercial space operation.
- SSC Public Affairs. (2025, September 10). Space Systems Command, Space Development Agency complete successful launch of first Tranche 1 satellites. Space Systems Command.
- NASA Orbital Debris Program Office. (2025, September). Orbital Debris Quarterly News, 29(3).
- UK Space Agency. (2025, February 3). £16 million for new projects to boost UK benefits of satellite constellations.
- German Aerospace Center (DLR). (2025, November 28). Germany invests 5.4 billion euros in the future of European space.
- National Space Policy Secretariat, Cabinet Office, Government of Japan. (2026, March 9). Japan’s space policy and law for lunar resource development [Presentation].
- Redwire Corporation. (2025, May 27). Redwire successfully delivers onboard computer for ESA’s Comet Interceptor mission to study pristine comet.
- RTX. (2025, June 25). RTX provides Blue Canyon satellite to shape future space missions.
- Airbus. (2026, January 12). Airbus awarded Eutelsat contract for further 340 low Earth orbit OneWeb satellites.
- York Space Systems. (2026, July 20). York Space Systems first to deploy second layer of T1TL Transport System, confirms health of 21 additional satellites on orbit within hours.
- Thales Alenia Space. (2025, September 17). Thales Alenia Space onboard IRIS² project.
This Report Answers
- The report explains where low-drag satellite platforms are used across Bus Aerodynamics and Operating Orbit. It also covers Drag Management and Mission across the listed regions.
- Segment analysis identifies the leading subsegments and explains why operators prioritize slender low-area buses, lower orbit bands, electric compensation, and Earth observation missions.
- Country analysis examines the United States, Germany, France, the United Kingdom, and Japan, together with launch activity, public space funding, LEO programs, and Earth observation missions supporting platform demand.
- Competitive analysis reviews current providers across low-orbit satellite buses, VLEO platforms, constellation spacecraft, and compact mission systems. It also considers manufacturing scale, pointing performance, payload integration, and mission life.
- Application analysis assesses how aerodynamic drag, propulsion needs, attitude control, power use, and orbit-maintenance requirements influence platform design. It also considers Earth observation, Defence ISR, communications, atmospheric science, and space-weather missions.
What does the Low-Drag Satellite Platforms Market cover?
The market covers satellite buses and integrated platforms built to reduce drag or offset it in low and very low Earth orbit. Bus shape, thrust and pointing are included when they help keep the craft in its chosen orbit band.
The market is narrower than general satellite-bus coverage because Drag Management is part of the design basis. Standard LEO buses enter the scope only when they use low exposed area, repeated drag control or the listed low-height bands.
What is included in the scope?
Low-area buses and compact drag shapes form the core scope. Related context includes VLEO satellite platforms. Drag control covers Electric compensation and air-breathing electric propulsion when thrust helps hold a low orbit.
The scope includes in-space propulsion components when thrust hardware is built into the platform. Power design is reviewed where it connects with all-electric satellites and long orbit-control duty. Mission coverage includes Earth observation and Defence ISR. Related context includes Earth observation systems.
What is excluded from the scope?
Service-only categories stay outside core platform revenue. The report uses satellite communication systems only as mission context. The report uses mobile satellite services as end-use context when service features drive the purchase.
The report uses satellite internet services only as mission context for LEO connectivity. Secure LEO links are covered as mission context through sovereign defence SATCOM platforms. Test needs are treated as enabling context through small satellite environmental test systems.
How Was the Analysis Built?
The analysis draws on 120+ sources, 35+ company portfolios, 25+ countries, and more than 20 industry interviews.
- Primary Research: Primary research includes discussions with manufacturers, service providers, technology developers, distributors, end users, and subject-matter experts. These conversations examine purchasing priorities, product adoption, operational challenges, approval requirements, competitive positioning, and the factors that influence wider market acceptance.
- Desk Research: Desk research covers government statistics, regulatory publications, company filings, trade data, technical studies, industry associations, standards, public policy, and other authoritative sources. Every source used in the analysis is documented in the bibliography.
- Market Sizing and Forecasting: Market estimates combine historical performance, demand indicators, pricing and volume trends, segment shares, company participation, country-level growth, adoption patterns, investment activity, and barriers to market expansion.
- Data Validation and Update Cycle: Findings are validated by comparing primary interviews with public data, company activity, regulatory changes, trade patterns, and industry developments. Regular updates review new product launches, capacity changes, partnerships, approvals, and shifts in commercial adoption.
Segmentation
What is the report’s scope and coverage?
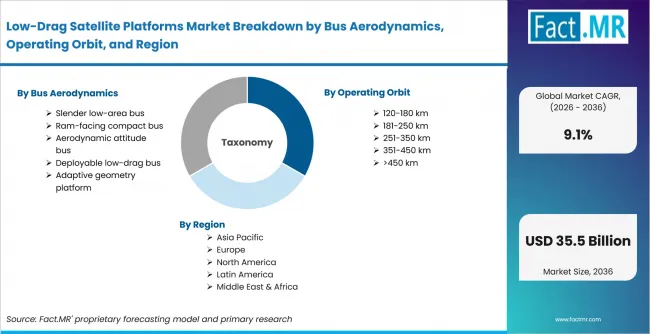
Low Drag Satellite Platforms Market Breakdown By Bus Aerodynamics, Operating Orbit, And Region | Source: Fact.MR
| Attribute | Details |
|---|---|
| Quantitative Units | USD billion |
| Market Definition | Satellite bus and integrated platform designs engineered to reduce aerodynamic drag or compensate for drag during sustained operation in low and very low Earth orbit. |
| Bus Aerodynamics | Slender low-area bus; Ram-facing compact bus; Aerodynamic attitude bus; Deployable low-drag bus; Adaptive geometry platform |
| Operating Orbit | 120-180 km; 181-250 km; 251-350 km; 351-450 km; >450 km |
| Drag Management | Electric compensation; Air-breathing EP; Attitude optimization; Low-drag materials; Passive ballistic design |
| Mission | Earth observation; Defence ISR; Communications; Atmospheric science; Space weather |
| Regions Covered | North America; Latin America; Western Europe; Eastern Europe; East Asia; South Asia & Pacific; Middle East & Africa |
| Countries Covered | United States; United Kingdom; Germany; Japan; France |
| Key Companies Profiled | Airbus Defence and Space; Thales Alenia Space; Redwire; York Space Systems |
| Forecast Period | 2026 to 2036 |
| Approach | Hybrid top-down and bottom-up approach using satellite deployment activity, low-orbit mission requirements, platform portfolios, drag-management architecture and country program review. |
Source: Fact.MR analysis. Updated Sep 24, 2026
How is the market segmented?
-
By Bus Aerodynamics:
- Slender low-area bus
- Ram-facing compact bus
- Aerodynamic attitude bus
- Deployable low-drag bus
- Adaptive geometry platform
-
By Operating Orbit:
- 120-180 km
- 181-250 km
- 251-350 km
- 351-450 km
- >450 km
-
By Drag Management:
- Electric compensation
- Air-breathing EP
- Attitude optimization
- Low-drag materials
- Passive ballistic design
-
By Mission:
- Earth observation
- Defence ISR
- Communications
- Atmospheric science
- Space weather
-
By Region:
- North America
- Latin America
- Western Europe
- Eastern Europe
- East Asia
- South Asia & Pacific
- Middle East & Africa
Frequently Asked Questions
How big is the low-drag satellite platforms market in 2026?
What is the CAGR of the low-drag satellite platforms market from 2026 to 2036?
Which bus aerodynamics type leads the low-drag satellite platforms market?
Which operating orbit leads the low-drag satellite platforms market?
Who are the leading companies in the low-drag satellite platforms market?
Who worked on this report


Preview the report firsthand - request a free sample
Free SampleGet the brochure for pricing and purchase details
Download PDF