
Luxury Bath and Body Products Market Outlook (2025 to 2035)
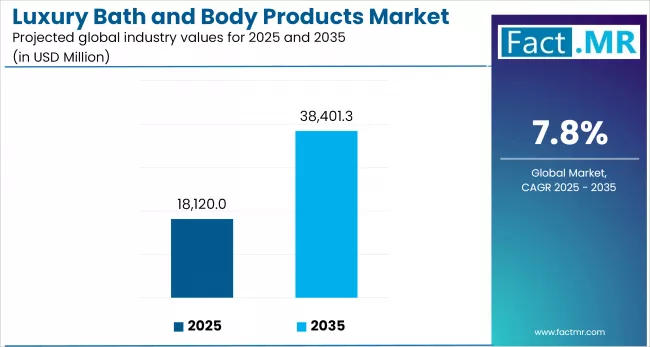
The global luxury bath and body products market is expected to reach USD 38,401 million by 2035, up from USD 16,997 million in 2024. During the forecast period 2025 to 2035, the industry is projected to register at a CAGR of 7.8%.
Rising disposable incomes, demand for clean and sustainable ingredients, and the wellness-driven shift toward holistic self-care are driving the growth of the luxury bath and body products market. Brand storytelling, experiential retail, and digital influence through social media and e-commerce are further accelerating market growth.
What are the drivers of Luxury Bath and Body Products Market?
The luxury bath and body products industry is primarily driven by the growing number of people who prefer quality self-care solutions. Increasing disposable income, particularly in cities and emerging markets, is driving expenditure on high-end personal care products that are both indulgent and functional. The growing influence of consumers on artisanal, organic, and natural product formulations is further driving demand for luxury products with clean, sustainable, and non-toxic ingredients.
Experiential retail, as well as brand storytelling, is another important growth parameter in the market. Luxury brands utilize features such as exclusivity, history, and packaging design to attract aspirational consumers and add perceived value. The brand's desirability is further enhanced by the use of social media influencers and celebrity endorsements, especially among the millennial and Gen Z demographics.
The wellness trend has expanded bath and body care routines into whole-body approaches to promote mental and physical restoration. This has led to the introduction of aromatherapy, spa-grade and multi-purpose formulations, further widening the luxury market. Availability and product trials continue through e-commerce and subscription services, contributing to the global expansion of the market.
What are the regional trends of Luxury Bath and Body Products Market?
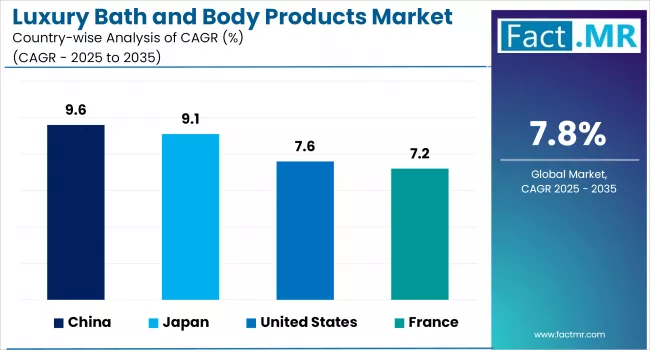
North America is one of the significant markets for luxury bath and body products, owing to its wellness culture, a developed clean beauty industry, and high level of consumer spending. The American market, in particular, relies on innovations, celebrity-endorsed brands, and a well-developed online retail system. Canada follows, with an increasing interest in cruelty-free and vegan skincare.
Europe is a leading market, boasting legacy luxury brands, environmentally friendly formulas, and a well-developed spa and wellness culture. The dominance is held by France, the UK, and Germany, with an increased demand for niche and artisanal labels.
China and Japan lead the pack in the Asia-Pacific region, where affluence and beauty-conscious individuals are driving growth in premium personal care. The popularity of luxury skincare regimens is further supported by the influence of South Korea’s K-beauty trends.
The Middle East region is witnessing higher requirements for rich fragrance body products, especially in the UAE and Saudi Arabia. Emerging markets in Latin America and Africa are gradually adopting luxury wellness trends, with Brazil and South Africa developing new products to align with changing preferences.
What are the challenges and restraining factors of Luxury Bath and Body Products Market?
The luxury bath and body products market faces several challenges despite steady demand. The high pricing of these products limits access to mass markets, particularly in developing economies, which restricts growth through volume. Moreover, in times of economic turndowns or inflation, the price sensitivity of the consumer will drive them to lower-priced alternatives.
Sourcing of ingredients as well as sustainable issues are restraints too. Brands are experiencing increased cost of packaging, and ethically sourced ingredients contribute to reduced profit margins, especially as consumers continue to demand organic and ethically formulated products. Inconsistent regulations concerning the labeling and certification of cosmetic products across global markets present additional difficulties for international brands.
Market saturation and brand proliferation also generate intense competition. Newer or niche brands face greater difficulty in establishing a presence among larger, established companies with substantial marketing resources. Counterfeit luxury products and imitation items also affect brand perception and result in lost sales.
Country-Wise Outlook
Heritage, Innovation, and High Spend Power Drive Premium Bath & Body in the U.S.
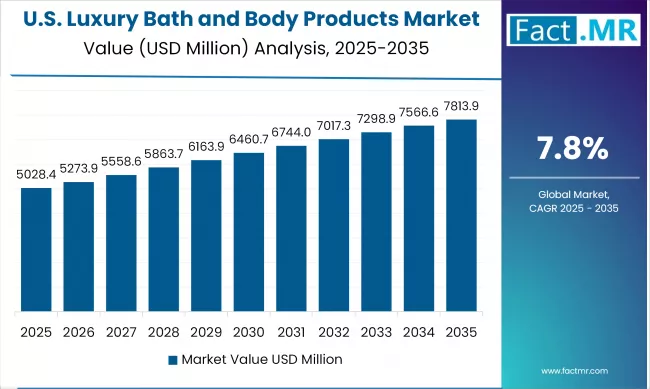
The U.S. is the leading market for luxury bath and body products, owing to its high disposable income ratio, flourishing culture of gifting, and continuously evolving self-care beauty trend. The market is being influenced by digital-first strategies, as DTC brands take over with the use of social media, influencer promotions, and subscription strategies.
Hybrid products, such as body serums containing niacinamide or aroma-therapeutic shower oils, are gaining popularity. Sustainability, as a key consideration in purchasing decisions, is leading brands toward aluminum packaging, biodegradable formulations, and carbon-neutral targets.
The emergence of functional luxury is also influencing the market, with products offering mood-related effects, sleep support, or benefits for the skin microbiome, in addition to basic cleansing or moisturizing functions.
French Legacy Meets Modern Wellness in a Mature Market
France has maintained its position as a global leader in the luxury bath and body industry due to its traditional strengths in perfumery, dermo-cosmetics, and the spa culture. In the case of iconic brands, the French market emphasizes heritage, craft, and sensory values.
Wellness-driven consumers have increased demand, as they seek botanical, sensorial, and science-based formulations. The incorporation of thermal spring water, essential oils, and phytotherapy in various products highlights the rich tradition of pharmacognosy in France.
Boutique hotels and concept spas contribute further to the industry through exclusive amenities, while regulatory alignment with EU clean beauty standards ensures ingredient transparency. Refillable packaging and bulk dispensers are also being introduced in premium retail and hospitality environments.
Japan Fuses Minimalism with Skin Science in the Luxury Body Space
Ritual, minimalism, and functionality are the defining elements of Japan’s luxury bath and body market, rooted in the Japanese cultural attitude towards bathing and skincare. The strong emphasis on purity, refinement, and sensorial detail results in products that are both precisely formulated and thoughtfully designed.
The range of premium Japanese brands focuses on skin immunity, hydration, and anti-pollution, utilizing fermented extracts, rice bran, yuzu, and camellia oil. The concept of at-home spa care is increasing, with high-end body milks, exfoliating treatments, and onsen-inspired products performing well in both department stores and online platforms. Smart packaging, airless dispensers and understated innovation characterize the Japanese luxury aesthetic.
Category-Wise Analysis
Premium Body Wash & Shower Gels Redefine Everyday Indulgence in the Luxury Segment
Body wash and shower gels have become the core of luxurious bath and body rituals, as they are all about sensorial and skincare with a pleasant aroma. They are significant, as they can combine aesthetics and practical hydration or be enriched with exotic botanicals, essential oils and dermatologically tested ingredients.
The products have been branded as affordable luxuries to make up part of daily self-care routines and wellness-focused lives. Premium versions, such as sulfate-free and pH-neutral products, have been gaining popularity in most premium-selling stores.
Liquid Formats Dominate for Superior Texture, Lather, and Moisturizing Delivery
Body cleansers available in liquid form are considered convenient and supportive, making them the most desired in the luxury line segment. They are fluid, allowing more active ingredients such as hyaluronic acid, shea butter, and vitamin E to be dispersed, resulting in improved hydration and moisturizing effects.
Liquid products are also compatible with aesthetic packs, ranging from glass pump bottles to eco-luxe (refillable) packs, to enhance display and contribute to sustainability efforts. The format is especially compatible with developments in scent layering and rinse-off aromatherapy.
Online Retail Emerges as a Key Channel for Premium Bath Product Discovery
Online stores have also become a staple of luxury bath product distribution, as they provide customized shopping, pay-per-use, and direct customer relationships with brands. Digital spaces enable a narrative to be built around factors such as ingredients, provenance, and ethical sourcing, which is becoming increasingly important to wealthy customers.
Expanded forms of digital merchandising, collaboration with influencers, and virtual skin diagnostics are redefining the process of exploration and purchase of premium personal care. The increase in online-exclusive SKUs and product releases is also contributing to the growth of this channel.
Competitive Analysis
The quality of products offered in the luxury bath and body category remains competitive, with brands aiming to deliver elevated sensory experiences through specialized formulations. Inspiration and product development remain central, as premium offerings include rare botanicals, therapeutic essential oils, clean-label formulations, and ingredients that appeal to wellness-aware consumers.
The market is also shifting towards personalization, where products tailored to skin type, mood, or ritual are becoming preferred among affluent consumers seeking individualized self-care practices.
Sustainability has emerged as a key differentiator in this competitive environment. Premium positioning is also supported by minimalist and elegant aestheticism. Brand storytelling plays a crucial role, with many companies drawing on traditional methods or international origins to justify their pricing and foster stronger emotional connections with customers.
Distribution remains a key aspect of competitive advantage. Organizations are using the luxury retail channels, top-end digital shops, and influencer partnerships to reach additional people and show presence to brands. There is solid growth in high-margin niche categories, such as bath oils, body butters, and sleep-enhancing products, which are associated with wellness tourism and the home-spa movement.
Key players in the luxury bath and body products industry include Bamford, The Estée Lauder Companies Inc., This Works Products Limited, Augustinus Bader, Diptyque, Aromatherapy Associates, Tata Harper, Omorovicza, Chanel Limited, Chantecaille (UK) Ltd., and other notable companies.
Recent Development
- In June 2025, Diptyque introduced a limited-edition Lip Oil in collaboration with Austrian natural beauty expert Susanne Kaufmann. This product combines Diptyque’s fragrance expertise with Kaufmann’s botanical approach to skincare.
- In May 2025, Bamford partnered with 1 Hotel Hanalei Bay to introduce its signature scents, enhancing the sensory experience for guests. Additionally, the brand operates the Bamford Wellness Spa, offering specialized treatments like prenatal massages.
Fact.MR has provided detailed information about the price points of key manufacturers in the Luxury Bath and Body Products market, positioned across regions, including sales growth, production capacity, and speculative technological expansion, in its recently published report.
Methodology and Industry Tracking Approach
Fact.MR thoroughly appraised the luxury bath and body products market in 2025 and captured the views of 4,250 stakeholders in 21 of the world countries. Completed in October 2020, the survey polled the views of at least 100 experts per country on cosmetic chemists, sustainability engineers and personal care technology developers. It focused on formulation technologies, sustainable packaging and high-quality sensorial experience innovations.
Other standout trends from June 2024 to May 2025 were the AI-personalized skincare recommendations, multifunctional body care hybrids (e.g., exfoliate + moisturize) and even smarter dispensers linked to wellness tracking apps. The green transitions were boosted by the use of biodegradable packaging, filling containers, and using plant-based actives.
Customers in North America and Western Europe first adopted connected skincare technology. At the same time, Japan, South Korea, and Singapore were trendsetters in formulating with fermented botanicals and time-release serums. Over the past four years, since 2018 Fact.MR has been monitoring how the market is moving towards clean beauty, technology-driven regimen, and wellness-based formulations.
Segmentation of Luxury bath and body products market
-
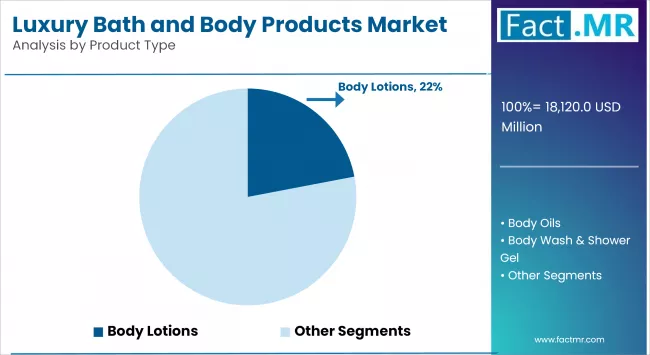
By Product Type :
- Body Lotions
- Body Oils
- Body Wash & Shower Gel
- Soaps
- Bath Salts
- Body Scrubs & Exfoliants
- Bath Bombs
-
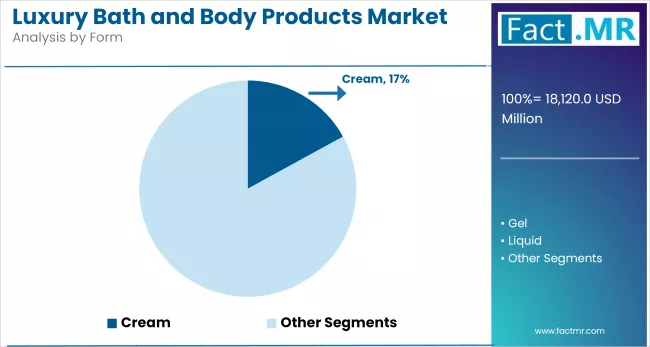
By Form :
- Cream
- Gel
- Liquid
- Solid
- Powder
- Balm
- Others
-
By Distribution Channel :
- Online Retail
- Specialty Stores
- Departmental Stores
- Supermarkets/Hypermarkets
- Mono-brand Stores
- E-commerce Portals
- Others
-
By End User :
- Men
- Women
- Unisex
-
By Region :
- North America
- Latin America
- Western Europe
- Eastern Europe
- East Asia
- South Asia & Pacific
- Middle East & Africa
- Frequently Asked Questions -
What was the global Luxury bath and body products market size reported by Fact.MR for 2025?
The global luxury bath and body products market was valued at USD 18,120 million in 2025.
Who are the major players operating in the luxury bath and body products market?
Prominent players in the market are Bamford, The Estée Lauder Companies Inc., This Works Products Limited, Augustinus Bader, Diptyque, Aromatherapy Associates, Tata Harper, Omorovicza, Chanel Limited, and Chantecaille (UK) Ltd.
What is the Estimated Valuation of the luxury bath and body products market in 2035?
The market is expected to reach a valuation of USD 38,401 million in 2035.
What value CAGR did the Luxury bath and body products market exhibit over the last five years?
The historic growth rate of the Luxury bath and body products market was 6.2% from 2020 to 2024.

Author:
Ayush Raj

Editor:
Anushree Karale