- Market Value (2025): USD 139.1 Mn
- Estimated Value (2026): USD 152.0 Mn
- Forecast Value (2036): USD 370.0 Mn
- CAGR (2026-2036): 9.3%
What is the Modular Demo Pods Market forecast to be worth by 2036?
USD 152.0 million in 2026 to USD 370.0 million by 2036, at a 9.3% CAGR.
- The market reached USD 139.1 million in 2025 as buyers increased spending on complex product demonstrations and need for focused conversations.
- & Demand is projected to rise from USD 152.0 million in 2026 to USD 370.0 million by 2036.
- The market is forecast to record a 9.3% CAGR from 2026 to 2036 as complex product demonstrations, roadshow reuse and growth of healthcare and technology showcases influence purchasing.
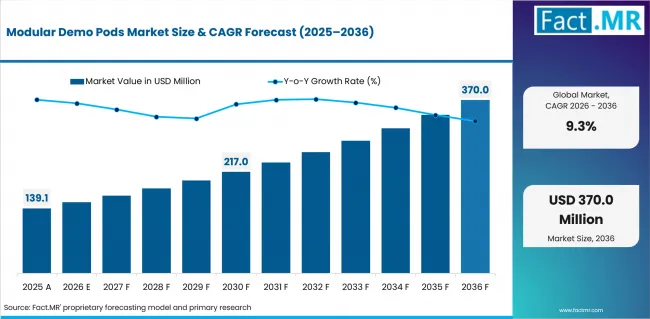
Modular Demo Pods Market Value Analysis | Source: Fact.MR
What are the defining numbers behind Modular Demo Pods Market growth?
USD 218.0 million absolute opportunity is expected by 2036.
- Demand Drivers in the Market
- Complex product demonstrations: Products such as medical equipment, industrial systems and immersive software are difficult to explain through a screen or display panel alone. A demo pod gives the exhibitor room to run the product while keeping cables, equipment and visitors within a defined area. AUMA recorded 150,260 exhibitors and 8.3 million visitors at 158 major German trade fairs in 2025. At events of this scale, the pod must support a useful demonstration without blocking the aisle or consuming more floor space than the product warrants.
- Need for focused conversations: Busy exhibition halls are not well suited to technical discussions, consultations or commercially sensitive conversations. Dubai World Trade Centre hosted 19,062 exhibiting companies at its exhibitions in 2024, including more than 15,000 international exhibitors. In that setting, a partly enclosed pod gives sales teams a quieter place to speak while keeping the brand visible from the show floor. Buyers still need to check that the enclosure does not slow visitor movement or make the stand feel closed.
- Roadshow reuse: The case for modular pods becomes stronger when the same structure can travel to several events. Frames, panels and graphics can be packed, rebuilt and adjusted for a different booth size instead of being replaced after one show. UFI’s Better Stands framework specifically supports reusable modular systems designed for quick construction, limited onsite tooling, disassembly and storage. This allows buyers to spread design and fabrication costs across a longer event programme, provided transport and labour do not erase the saving.
- Growth of healthcare and technology showcases: Healthcare and technology exhibitors often need space for equipment trials, software walkthroughs or one-to-one explanations that a conventional open stand cannot handle well. CCPIT listed nearly 1,500 economic and trade exhibitions across more than 80 Chinese cities for 2025, showing how widely exhibitors may need to move between venues. A pod that can be resized, rewired and rebuilt for each stop is therefore more useful than a fixed demonstration room created for one event.
- Key Segments Analyzed
- By Pod Type: Open demo pods are expected to lead the market with a 29.0% share in 2026. They give exhibitors some control over the demonstration area without cutting the product off from passing visitors. This makes them easier to use where visibility and visitor access matter as much as privacy.
- By Build System: Aluminium frame pods are projected to account for 31.0% of the market in 2026. Their lead comes from a practical mix of low weight, structural strength and reusability. Frames can be packed, transported and rebuilt for different booth sizes, which is useful for exhibitors attending several events.
- By Use Case: Product launches are forecast to hold a 26.0% share in 2026. New products often need more than a display counter, particularly when visitors must watch a live demonstration or try the product themselves. Demo pods give brands a controlled area for these interactions while keeping the launch visible from the show floor.
- By Buyer: Technology brands are expected to represent 27.0% of demand in 2026. Many technology products require screens, power connections, equipment trials and guided explanations. A modular pod helps organise these elements within a limited booth footprint and can be adjusted for later launches or roadshows.
- By Service Model: Custom builds are projected to capture a 25.0% share in 2026. Buyers often need the pod to match a particular product, visitor route or technical setup. Custom construction allows the supplier to account for equipment size, power requirements, graphics and privacy needs before the structure reaches the venue.
- Analyst Opinion at Fact.MR
- "For the Modular Demo Pods Market, the technical review starts with visitor flow, utility readiness and whether enclosure improves the demonstration enough to justify the footprint. A buyer should be able to see how balancing visibility, acoustic control and repeatable installation in limited booth space changes setup, use and follow-up. Providers that make this chain auditable are easier to compare and approve’, says, Shambhu Nath Jha, Sr. Consultant, Fact.MR.
- Strategic Implications
- Event buyers: Buyers should map how visitors will enter, view the demonstration and leave before approving the pod size. This matters most where equipment, screens or consultations can create queues inside a small booth. A simple movement plan gives the supplier clearer dimensions and helps the installation crew avoid last-minute changes at the venue.
- Suppliers: Suppliers should separate the physical pod from the services around it. The quote should show what is included in the frame, panels, lighting, graphics and utilities, and what will be charged for transport, assembly, testing and onsite support. This makes competing offers easier to compare and reduces disputes when the same pod is used at several events.
- Venue and agency teams: A reusable pod should be tested in more than one booth layout before it is adopted as a standard package. Entry points, ceiling limits, power access and aisle width can change from one venue to another. Reuse creates savings only when the structure can be adapted without repeated rebuilding, extra labour or a loss of visitor capacity.
The UAE follows at 10.0%, helped by frequent international exhibitions and the need to turn booths around quickly between events. Growth in the USA is projected at 9.3%, broadly matching the global market, as technology and healthcare exhibitors invest in more controlled demonstration spaces. Japan is close behind at 9.2%, where compact footprints and reliable installation matter heavily. The UK is forecast to expand at 9.0%, supported by repeat exhibitions and roadshow activity, while Germany is expected to grow at 8.7% within its mature and technically demanding trade-fair market.
How does the Modular Demo Pods Market break down by segment?
Open demo pods lead Pod Type at 29.0%, while Aluminum frame pods hold the largest Build System share at 31.0% in 2026.
Why do Open demo pods lead Pod Type?
Open demo pods are projected to account for 29.0% share in 2026.
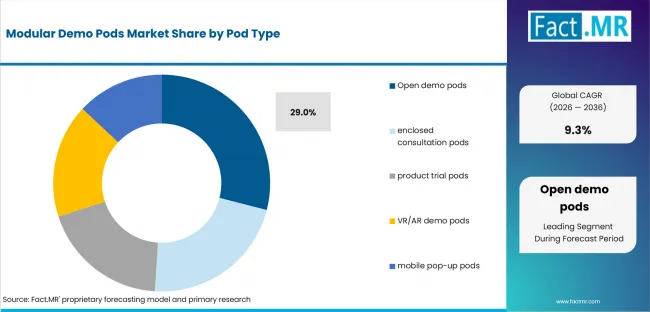
Modular Demo Pods Market Analysis By Pod Type | Source: Fact.MR
Open demo pods hold the largest Pod Type position by linking complex product demonstrations to a repeatable process. That process uses the following mechanism: modular frames and panels create a defined demonstration zone that can be reconfigured for different products or venues. It reduces uncertainty around balancing visibility, acoustic control and repeatable installation in limited booth space. The next value layer comes from acoustic and privacy modules, provided buyers can validate visitor flow, utility readiness and whether enclosure improves the demonstration enough to justify the footprint.
Why do Aluminum frame pods lead Build System?
Aluminum frame pods are projected to account for 31.0% share in 2026.
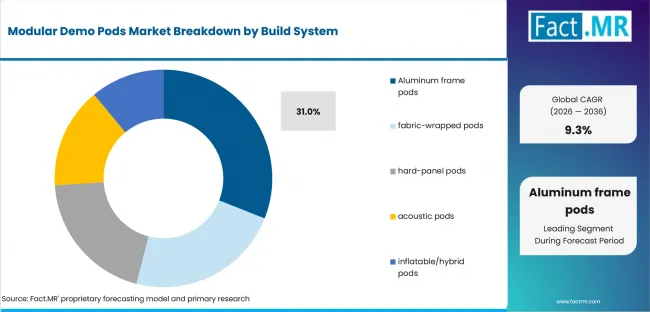
Modular Demo Pods Market Analysis By Build System | Source: Fact.MR
Aluminum frame pods lead Build System because balancing visibility, acoustic control and repeatable installation in limited booth space is handled through a clear operating method. In this format, modular frames and panels create a defined demonstration zone that can be reconfigured for different products or venues. Demand strengthens when need for focused conversations appears in the event brief. Buyers then verify visitor flow, utility readiness and whether enclosure improves the demonstration enough to justify the footprint, while custom utility requirements remains the main qualification risk.
Why does Product launch lead Use Case?
Product launch are projected to account for 26.0% share in 2026.
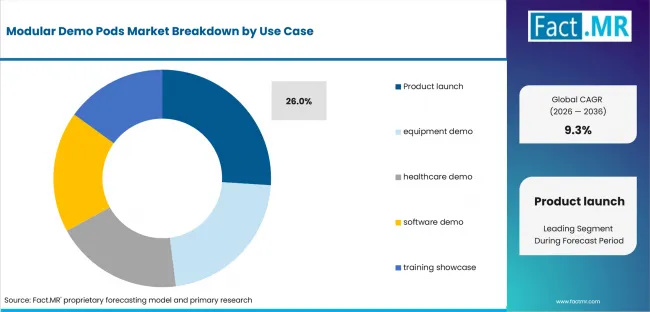
Modular Demo Pods Market Analysis By Use Case | Source: Fact.MR
Demand favors Product launch where event teams must control balancing visibility, acoustic control and repeatable installation in limited booth space under short setup windows. The segment works because modular frames and panels create a defined demonstration zone that can be reconfigured for different products or venues. Its share is reinforced by roadshow reuse, although poor visitor throughput in enclosed formats can reduce the advantage. Buyers compare suppliers through visitor flow, utility readiness and whether enclosure improves the demonstration enough to justify the footprint.
Why do Technology brands lead Buyer?
Technology brands are projected to account for 27.0% share in 2026.
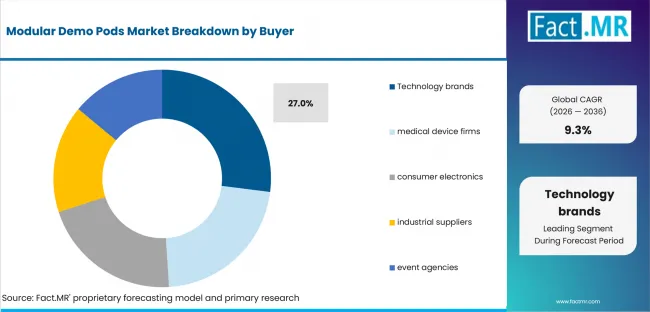
Modular Demo Pods Market Analysis By Buyer | Source: Fact.MR
Within Buyer, Technology brands are selected when the event specification gives priority to growth of healthcare and technology showcases. Their operating logic follows modular frames and panels create a defined demonstration zone that can be reconfigured for different products or venues. This helps teams manage balancing visibility, acoustic control and repeatable installation in limited booth space without relying on improvised site decisions. Acoustic and privacy modules can extend the value, but the purchase still turns on visitor flow, utility readiness and whether enclosure improves the demonstration enough to justify the footprint.
Why does Custom build lead Service Model?
Custom build are projected to account for 25.0% share in 2026.
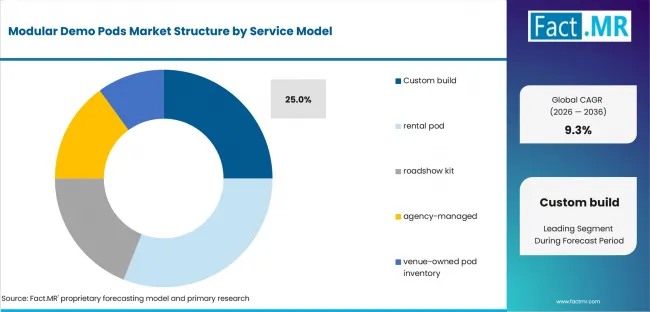
Modular Demo Pods Market Analysis By Service Model | Source: Fact.MR
For Service Model, Custom build give buyers the clearest route to manage balancing visibility, acoustic control and repeatable installation in limited booth space. The segment relies on this operating principle: modular frames and panels create a defined demonstration zone that can be reconfigured for different products or venues. Complex product demonstrations supports the purchase case, and prewired demo utilities creates room for later improvement. Final approval depends on visitor flow, utility readiness and whether enclosure improves the demonstration enough to justify the footprint.
What is accelerating Modular Demo Pods Market adoption, and what is holding it back?
Complex product demonstrations is anticipated to remain the primary demand catalyst. Footprint inefficiency is expected to restrain adoption when the operating case is incomplete.
Drivers Impact Analysis
| DRIVER | (~) % IMPACT ON CAGR | GEOGRAPHIC RELEVANCE | IMPACT TIMELINE |
|---|---|---|---|
| Complex product demonstrations | +2.5% | China and UAE | Short term (<=2 years) |
| Need for focused conversations | +2.0% | Mature exhibition markets | Short term (<=2 years) |
| Roadshow reuse | +1.5% | Global | Medium term (2-4 years) |
| Growth of healthcare and technology showcases | +1.0% | North America and Europe | Medium term (2-4 years) |
Source: Fact.MR analysis. Updated Jul 28, 2026
- Complex product demonstrations: Modular demo pods become more useful when a product cannot be explained properly from an open counter or screen. They give exhibitors enough control over lighting, sound, equipment and visitor movement to run the same demonstration several times during the day. The purchase case is strongest when the pod improves the quality of the demonstration without taking too much space from the rest of the booth.
- Need for focused conversations: Some sales discussions need more privacy than an open exhibition stand can provide. A partly enclosed pod gives staff a quieter place for consultations, technical discussions or product walkthroughs while keeping the area connected to the wider booth. Buyers will still reject the format if the enclosure feels closed off or slows the flow of visitors.
- Roadshow reuse: Reuse matters because many exhibitors attend several events with the same product or campaign. A modular pod can be dismantled, transported and adjusted for different floor plans instead of being rebuilt from scratch each time. The savings are real only when the frame, panels and utilities can move between venues without repeated redesign or excessive installation labour.
- Growth of healthcare and technology showcases: Healthcare and technology events often involve equipment trials, software demonstrations and detailed one-to-one explanations. These activities need power, screens, controlled access and enough separation from surrounding noise. Modular pods suit this work because the same structure can be adapted for a medical device launch, a software demo or a training session without creating a permanent room inside the booth.
Opportunity Impact Analysis
| OPPORTUNITY | (~) % IMPACT ON CAGR | GEOGRAPHIC RELEVANCE | IMPACT TIMELINE |
|---|---|---|---|
| Acoustic and privacy modules | +1.7% | China and UAE | Short term (<=2 years) |
| Prewired demo utilities | +1.2% | USA and UK | Medium term (2-4 years) |
| Standard roadshow pod fleets | +0.8% | Germany and Japan | Medium term (2-4 years) |
Source: Fact.MR analysis. Updated Jul 28, 2026
Restraints Impact Analysis
| RESTRAINT | (~) % IMPACT ON CAGR | GEOGRAPHIC RELEVANCE | IMPACT TIMELINE |
|---|---|---|---|
| Footprint inefficiency | -1.8% | Global | Short term (<=2 years) |
| Custom utility requirements | -1.3% | Cost-sensitive regional markets | Medium term (2-4 years) |
| Poor visitor throughput in enclosed formats | -0.9% | Highly regulated venues | Short term (<=2 years) |
Source: Fact.MR analysis. Updated Jul 28, 2026
- Footprint inefficiency: Demo pods can take up valuable booth space without adding enough commercial value. The risk is highest when the enclosure reduces display area, narrows visitor movement or leaves too little room for staff and equipment. Buyers are more likely to approve the format when the supplier can show how many people the pod can handle and what the extra space will achieve.
- Custom utility requirements: Some products need dedicated power, data connections, ventilation, lighting or reinforced flooring. These requirements can increase cost and create installation problems when they are identified too late. Suppliers can reduce the risk by confirming utility needs with the venue before fabrication and stating clearly which party is responsible for each connection.
- Poor visitor throughput in enclosed formats: Fully or partly enclosed pods can create queues when entry and exit points are too narrow or demonstrations run longer than expected. This can limit the number of visitors reached during the event, even when the experience inside the pod is strong. Wider openings, timed sessions and a clear waiting area can improve flow without removing the privacy the pod is meant to provide.
Which countries are scaling Modular Demo Pods Market fastest?
- For modular demo pods, country variation comes from the procurement route and the operating problem being solved, not from the CAGR ranking alone.
- Open demo pods benefit from China's multi-city calendar because repeat deployment raises the value of standard work instructions. In the UAE, balancing visibility, acoustic control and repeatable installation in limited booth space places more weight on turnaround and support readiness.
- Complex product demonstrations gives US buyers a measurable reason to invest, while Japan tests whether visitor flow, utility readiness and whether enclosure improves the demonstration enough to justify the footprint can be maintained in compact configurations.
- Aluminum frame pods face higher documentation expectations in Germany. In the UK, recurring shows create several commercial routes for acoustic and privacy modules.
- Visitor flow, utility readiness and whether enclosure improves the demonstration enough to justify the footprint is therefore the common approval test, although each country reaches that test through a different event model.
The broader country analysis tests whether complex product demonstrations, footprint inefficiency and acoustic and privacy modules behave differently across North America, Latin America, Europe, East Asia, South Asia and Oceania, and the Middle East and Africa.
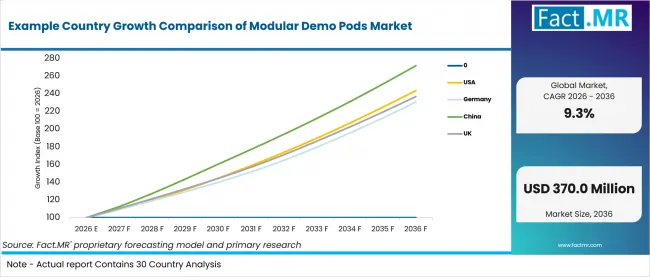
Example Country Growth Comparison Of Modular Demo Pods Market | Source: Fact.MR
| COUNTRY | CAGR, 2026 to 2036 |
|---|---|
| UAE | 10.0% |
| USA | 9.3% |
| Japan | 9.2% |
| UK | 9.0% |
| Germany | 8.7% |
Source: Fact.MR analysis. Updated Jul 28, 2026
What is driving UAE's growth through 2036?
10.0% CAGR, driven by high event throughput and international participation.
Growth in the UAE is estimated at 10.0%, with quick turnaround shaping the specification. DWTC reported 19,062 exhibiting companies across its exhibitions in 2024, with international exhibitors forming the clear majority. Suppliers that prevent custom utility requirements before arrival are better placed to support repeat programs.
What is driving USA's growth through 2036?
9.3% CAGR, supported by measurement-led exhibitor procurement.
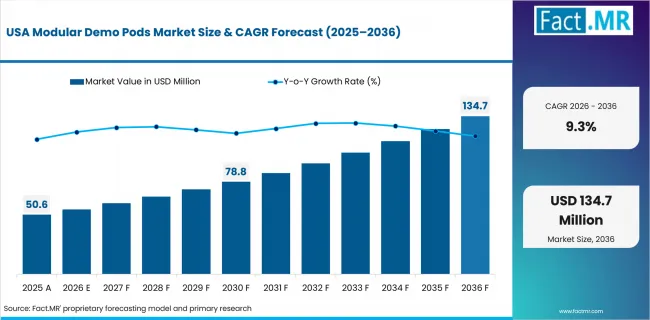
Modular Demo Pods Market Country Value Analysis | Source: Fact.MR
The USA is expected to post a 9.3% CAGR. CEIR operates as the official research division of IAEE and maintains exhibition benchmarks, forecasts and event-performance tools for the US market. Mature measurement practices make generic claims less useful, so providers must show how balancing visibility, acoustic control and repeatable installation in limited booth space changes an exhibitor decision.
What is driving Japan's growth through 2036?
9.2% CAGR, linked to compact systems and reliable operation.
For modular demo pods, Japan's 9.2% outlook is shaped by compact layouts and reliable operation. Japan sits within an Asia-Pacific exhibition region that leads the world in indoor exhibition space, increasing the relevance of compact, reliable and repeatable event systems. Suppliers need to prove visitor flow, utility readiness and whether enclosure improves the demonstration enough to justify the footprint because constrained space leaves little tolerance for footprint inefficiency.
What is driving UK's growth through 2036?
9.0% CAGR, supported by a broad base of exhibitions and recurring exhibitors.
The UK is projected at 9.0%, supported by recurring exhibitor demand for roadshow reuse. The Events Industry Alliance estimated 1,154 exhibitions and conferences with an exhibition element at leading UK venues in 2025, generating about 6.8 million visits. Providers can use this frequency to refine assets, training and the workflow behind modular frames and panels create a defined demonstration zone that can be reconfigured for different products or venues.
What is driving Germany's growth through 2036?
8.7% CAGR, driven by an international and technically demanding trade-fair base.
A 8.7% CAGR in Germany reflects recurring demand from experienced organizers and exhibitors. AUMA recorded 158 national and international trade fairs in Germany during 2025, with 150,260 exhibitors and 8.3 million visitors. In this environment, balancing visibility, acoustic control and repeatable installation in limited booth space is exposed quickly, so suppliers must model entry, demo and exit movement before locking the pod size or enclosure level.
Who leads the Modular Demo Pods Market?
The competitive field is led by firms that can combine design and onsite delivery. Freeman and Derse are well placed as they can support the full event cycle, from early planning and engineering through installation, operation and removal. Sparks and MC2 are competing by innovative product launches and technically demanding demonstrations.
beMatrix’s aluminium-frame systems give agencies and exhibit builders a flexible base that can be reconfigured across venues. Furthermore, Czarnowski adds strength in custom builds and branded environments, particularly where the pod forms part of a wider launch or exhibition programme.
Which companies are the key providers?
Key companies include Freeman; Derse; Sparks; MC2; beMatrix; Czarnowski.
- Freeman
- Derse
- Sparks
- MC2
- beMatrix
- Czarnowski
Bibliography
- UFI. (2026, January 29). 36th Global Exhibition Barometer. UFI, The Global Association of the Exhibition Industry.
- UFI. (2026, February). Global Exhibition Industry Statistics, January 2026. UFI, The Global Association of the Exhibition Industry.
- AUMA. (2026). Key figures for the trade fair industry in Germany. Association of the German Trade Fair Industry.
- Events Industry Alliance. (2026, April 15). UK exhibitions reach highest level in a decade according to EIA 2025 SASIE report. Events Industry Alliance.
- Dubai World Trade Centre. (2026, April 7). DWTC welcomes nearly 3 million participants in 2025. Dubai World Trade Centre.
- Center for Exhibition Industry Research. (2026). CEIR research and event-performance resources. International Association of Exhibitions and Events.
This Report Addresses
- Strategic intelligence on Modular Demo Pods Market across Pod Type and Build System choices that shape purchasing decisions.
- Segment analysis covering Open demo pods as the 2026 share leader within Pod Type.
- Regional analysis comparing China and UAE with USA and Japan, while UK and Germany complete the growth view.
- Competitive analysis profiling Freeman and Derse with additional active providers.
- Use-case assessment of the categories that shape demand across the forecast period.
What does the Modular Demo Pods Market cover?
Semi-enclosed exhibition modules created for product demonstrations, consultations or immersive trials.
The market includes open, enclosed, trial, VR and mobile demonstration pods supplied as configurable event structures. Commercial value comes from the configured product and its direct event function. The covered solution must be usable within an exhibition workflow rather than supplied as an unrelated component.
The market differs from broader event equipment because the boundary is defined by the specific function described in this report. Permanent retail rooms, general meeting-room construction, standalone av equipment and exhibition floor-space charges remain outside the valuation.
What is included in the scope?
The scope includes solutions used by the buyer groups identified in the segmentation and deployed for exhibitions, conferences, activations or related temporary business events.
Coverage spans Pod Type: Open demo pods, enclosed consultation pods, product trial pods, VR/AR demo pods, mobile pop-up pods; Build System: Aluminum frame pods, fabric-wrapped pods, hard-panel pods, acoustic pods, inflatable/hybrid pods; Use Case: Product launch, equipment demo, healthcare demo, software demo, training showcase; Buyer: Technology brands, medical device firms, consumer electronics, industrial suppliers, event agencies; Service Model: Custom build, rental pod, roadshow kit, agency-managed, venue-owned pod inventory.
Components remain in scope when they are supplied as part of the complete modular demo pods solution and contribute directly to visitor flow, utility readiness and whether enclosure improves the demonstration enough to justify the footprint.
What is excluded from the scope?
Permanent retail rooms, general meeting-room construction, standalone av equipment and exhibition floor-space charges.
The scope excludes unrelated venue construction, general event management, floor-space rental and services that do not deliver the defined product function. It also excludes the value of the event, venue or exhibitor business in which the solution is used.
How Was the Analysis Built?
The analysis draws on 120+ sources, 35+ company portfolios, 25+ countries and more than 20 industry interviews.
- Primary Research: Discussions with manufacturers, rental providers, exhibit builders, organizers, venues and end users examined visitor flow, utility readiness and whether enclosure improves the demonstration enough to justify the footprint, purchasing criteria and operational constraints.
- Desk Research: Research covered official exhibition statistics, association publications, company portfolios, technical material, public policy and other authoritative sources. Sources used in the country context are documented in the bibliography.
- Market Sizing and Forecasting: Estimates combine historical performance, segment shares, company participation, pricing and volume indicators, country growth, adoption patterns and barriers.
- Data Validation and Update Cycle: Findings are cross-checked against company activity, event-industry statistics, technical feasibility and the internal consistency of segment and country assumptions.
Segmentation
What is the report's scope and coverage?
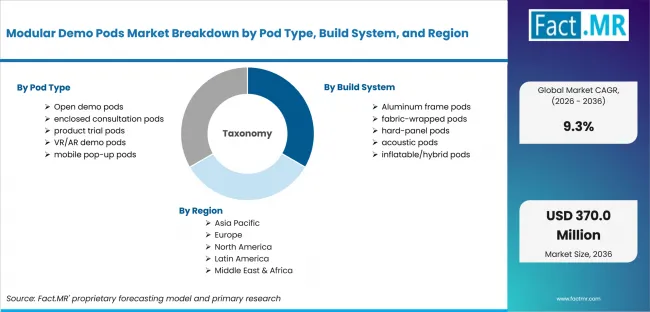
Modular Demo Pods Market Breakdown By Pod Type, Build System, And Region | Source: Fact.MR
| Attribute | Details |
|---|---|
| Quantitative Units | USD million in 2026 to USD million by 2036 at a CAGR |
| Market Definition | The market covers semi-enclosed exhibition modules created for product demonstrations, consultations or immersive trials when supplied as a commercial event solution. |
| Pod Type | Open demo pods; enclosed consultation pods; product trial pods; VR/AR demo pods; mobile pop-up pods |
| Build System | Aluminum frame pods; fabric-wrapped pods; hard-panel pods; acoustic pods; inflatable/hybrid pods |
| Use Case | Product launch; equipment demo; healthcare demo; software demo; training showcase |
| Buyer | Technology brands; medical device firms; consumer electronics; industrial suppliers; event agencies |
| Service Model | Custom build; rental pod; roadshow kit; agency-managed; venue-owned pod inventory |
| Regions Covered | North America; Latin America; Europe; East Asia; South Asia & Oceania; Middle East & Africa |
| Countries Covered | USA; Canada; Brazil; Mexico; Germany; U.K.; France; Italy; Spain; South Korea; Japan; Australia & New Zealand; GCC Countries; South Africa; UAE |
| Key Companies Profiled | Freeman; Derse; Sparks; MC2; beMatrix; Czarnowski |
| Forecast Period | 2026 to 2036 |
| Approach | Hybrid top-down and bottom-up analysis using demand indicators across Pod Type, Build System, Use Case, Buyer, Service Model; country growth; company participation and adoption patterns |
Source: Fact.MR analysis. Updated Jul 28, 2026
How is the market segmented?
-
By Pod Type:
- Open demo pods
- enclosed consultation pods
- product trial pods
- VR/AR demo pods
- mobile pop-up pods
-
By Build System:
- Aluminum frame pods
- fabric-wrapped pods
- hard-panel pods
- acoustic pods
- inflatable/hybrid pods
-
By Use Case:
- Product launch
- equipment demo
- healthcare demo
- software demo
- training showcase
-
By Buyer:
- Technology brands
- medical device firms
- consumer electronics
- industrial suppliers
- event agencies
-
By Service Model:
- Custom build
- rental pod
- roadshow kit
- agency-managed
- venue-owned pod inventory
-
By Region:
- North America
- USA
- Canada
- Latin America
- Brazil
- Mexico
- Rest of Latin America
- Europe
- Germany
- U.K.
- France
- Italy
- Spain
- Rest of Europe
- East Asia
- South Korea
- Japan
- China
- South Asia & Oceania
- India
- Australia & New Zealand
- Rest of South Asia & Oceania
- Middle East & Africa
- GCC Countries
- South Africa
- UAE
- Rest of Middle East & Africa
- North America
Frequently Asked Questions
Which Pod Type leads the Modular Demo Pods Market?
Which Build System leads the Modular Demo Pods Market?
Which Use Case leads the Modular Demo Pods Market?
Which Buyer leads the Modular Demo Pods Market?
Which Service Model leads the Modular Demo Pods Market?
How does UAE perform in the Modular Demo Pods Market?
How does USA perform in the Modular Demo Pods Market?
What is the primary driver in the Modular Demo Pods Market?
What is the main restraint in the Modular Demo Pods Market?
Who worked on this report


Preview the report firsthand - request a free sample
Free SampleGet the brochure for pricing and purchase details
Download PDF