- Market Value (2025): USD 74.2 Bn
- Estimated Value (2026): USD 77.1 Bn
- Forecast Value (2036): USD 113.2 Bn
- CAGR (2026-2036): 3.9%
What is the Phosphorite and Phosphorous Chemical Market forecast to be worth by 2036?
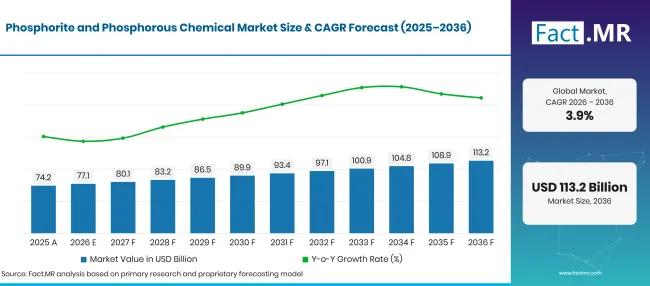
USD 77.1 billion in 2026 to USD 113.2 billion by 2036 at a 3.9% CAGR.
- According to Fact.MR analysis, the phosphorite and phosphorous chemical market reached USD 74.2 billion in 2025.
- Sales are projected to move from USD 77.1 billion in 2026 to USD 113.2 billion by 2036.
- The market is forecast to record a 3.9% CAGR between 2026 and 2036 as phosphate fertilizers remain central to crop nutrition.
Factmr Phosphorite And Phosphorous Chemical Market Forecast Global | Source: Fact.MR
| Year | Basis | Market value (USD billion) |
|---|---|---|
| 2025 | Actual | 74.2 |
| 2026 | Estimate | 77.1 |
| 2036 | Forecast | 113.2 |
| CAGR 2026 to 2036 | Forecast period | 3.9% |
Source: Fact.MR analysis. Updated Oct 14, 2026
What are the defining numbers behind Phosphorite and Phosphorous Chemical Market growth?
Fact.MR estimates that the absolute opportunity is USD 36.1 billion between 2026 and 2036.
- Demand Drivers in the Market
- Phosphate fertilizer makers require steady phosphate rock and phosphoric acid deliveries.
- Brazilian fertilizer blenders buy large quantities of imported nutrients. Brazil’s Ministry of Development trade statistics recorded 45.48 million metric tons of chemical fertilizer imports in 2025 [2].
- German farm suppliers adjust phosphate fertilizer orders to crop use and nutrient plans.
- Key Segments Analyzed
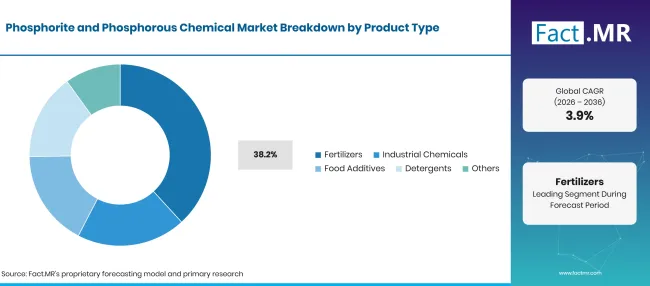
- By Product Type: Fertilizers account for 38.2% share in 2026 as phosphate nutrients serve established crop production needs.
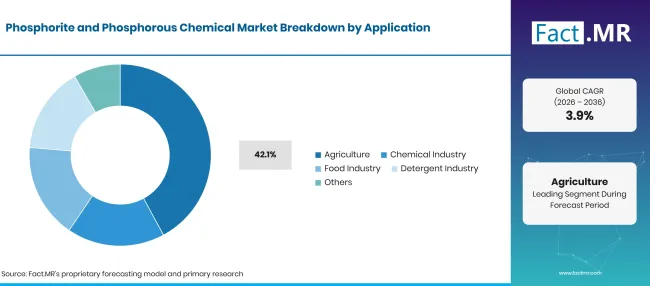
- By Application: Agriculture represents 42.1% share in 2026 because nutrient use creates repeat buying across seasons.
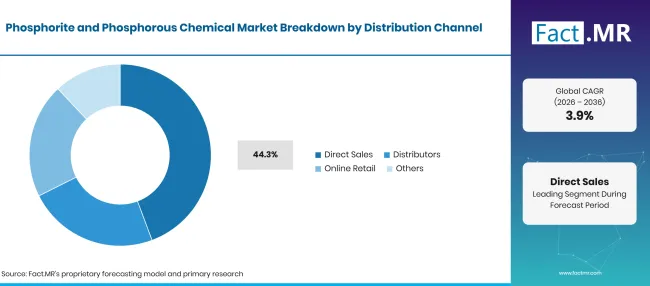
- By Distribution Channel: Direct Sales capture 44.3% share in 2026 as large industrial and fertilizer customers arrange bulk volumes with makers.
- Analyst Opinion at Fact.MR
- Shambhu Nath Jha, Principal Consultant at Fact.MR, states, “Integrated producers can coordinate rock processing with acid production, helping them manage feedstock quality and plant schedules. Buyers compare delivered nutrient costs, batch specifications and supply reliability when choosing between domestic and imported materials.”
- Strategic Implications
- Mining groups should match rock beneficiation plans to the quality required by phosphoric acid plants, since impurities affect downstream processing costs.
- Fertilizer makers should plan seasonal production against crop nutrient needs and port delivery schedules, mainly when imported rock or finished phosphates are involved.
- Industrial chemical buyers should qualify food or technical grades separately from fertilizer-grade acid to keep product specs clear.
Germany is forecast at 4.7% CAGR where specialty fertilizer planning affects phosphate purchases. Brazil follows at 4.3% as crop nutrient supply relies on both domestic processing and imports. The United States is estimated at 3.9% with established mining and acid production. The United Kingdom is projected at 3.5% amid tighter nutrient use choices. Japan records a 3.1% forecast as imported fertilizer feedstocks remain central to supply.
How does the Phosphorite and Phosphorous Chemical Market break down by segment?
Fact.MR estimates that fertilizers lead Product Type at 38.2%; Agriculture leads Application at 42.1%; Direct Sales lead Distribution Channel at 44.3%.
Which Product Type dominates?
Fertilizers account for 38.2% share in 2026.
Factmr Phosphorite And Phosphorous Chemical Market Breakdown Product Type | Source: Fact.MR
| Product Type | Share (2026) |
|---|---|
| Fertilizers (Leading segment) | 38.2% |
| Other segments combined | 61.8%* |
| Total | 100.0% |
Source: Fact.MR analysis. Updated Oct 14, 2026
The primary use of phosphate rock is for the production of fertilizer, which is converted into phosphoric acid and crop nutrients. Phosphorus is an important nutrient for plant growth and root development. Farmers apply phosphate fertilizers to provide phosphorus. Demand is driven by farm economics and crop needs. Companies that operate both mines and processing plants often have greater control over raw material supply and production planning.
What leads the Application segment?
Agriculture represents 42.1% share in 2026.
Factmr Phosphorite And Phosphorous Chemical Market Breakdown Application | Source: Fact.MR
| Application | Share (2026) |
|---|---|
| Agriculture (Leading segment) | 42.1% |
| Other segments combined | 57.9%* |
| Total | 100.0% |
Source: Fact.MR analysis. Updated Oct 14, 2026
Agriculture draws phosphate nutrients into repeated buying cycles tied to planting and soil conditions. Fertilizer blenders choose between finished phosphate products and input materials according to plant capability. Crop advisers also influence product choice when soil testing shows a nutrient need.
How does Distribution Channel shape sales?
Direct Sales capture 44.3% share in 2026.
Factmr Phosphorite And Phosphorous Chemical Market Breakdown Distribution Channel | Source: Fact.MR
| Distribution Channel | Share (2026) |
|---|---|
| Direct Sales (Leading segment) | 44.3% |
| Other segments combined | 55.7%* |
| Total | 100.0% |
Source: Fact.MR analysis. Updated Oct 14, 2026
Direct sales are common between phosphate mines and integrated chemical producers shipping contracted volumes to fertilizer plants or large other processors. Long-standing customers expect a uniform quality of the material as well as delivery according to the agreed schedule.
What is accelerating Phosphorite and Phosphorous Chemical Market adoption, and what is holding it back?
Crop nutrition purchases support sales; mineral processing costs and trade exposure limit flexibility.
Drivers Impact Analysis
| DRIVER | (~) % IMPACT ON CAGR | GEOGRAPHIC RELEVANCE | IMPACT TIMELINE |
|---|---|---|---|
| Crop phosphate application | +0.8% | Global | Medium term (2–4 years) |
| Integrated rock-to-acid processing | +0.7% | North America, Africa | Long term (>= 4 years) |
| Bulk fertilizer import requirements | +0.6% | Latin America, East Asia | Short term (<= 2 years) |
| High-purity chemical uses | +0.5% | Europe, East Asia | Medium term (2–4 years) |
| Seasonal distributor orders | +0.4% | Global | Short term (<= 2 years) |
Source: Fact.MR analysis. Updated Oct 14, 2026
Opportunity Impact Analysis
| OPPORTUNITY | (~) % IMPACT ON CAGR | GEOGRAPHIC RELEVANCE | IMPACT TIMELINE |
|---|---|---|---|
| Efficient acid processing | +0.7% | Global | Long term (>= 4 years) |
| Recovered phosphorus streams | +0.6% | Western Europe, East Asia | Long term (>= 4 years) |
| Specialty food and chemical grades | +0.5% | Global | Medium term (2–4 years) |
| Closer farm distribution | +0.4% | Latin America | Medium term (2–4 years) |
Source: Fact.MR analysis. Updated Oct 14, 2026
Restraints Impact Analysis
| RESTRAINT | (~) % IMPACT ON CAGR | GEOGRAPHIC RELEVANCE | IMPACT TIMELINE |
|---|---|---|---|
| Ore quality and beneficiation costs | -0.8% | Global | Long term (>= 4 years) |
| Import and freight exposure | -0.6% | Brazil, Japan | Short term (<= 2 years) |
| Nutrient application limits | -0.5% | Europe | Medium term (2–4 years) |
| Chemical-grade qualification | -0.4% | Global | Medium term (2–4 years) |
Source: Fact.MR analysis. Updated Oct 14, 2026
Which countries are scaling the Phosphorite and Phosphorous Chemical Market through 2036?
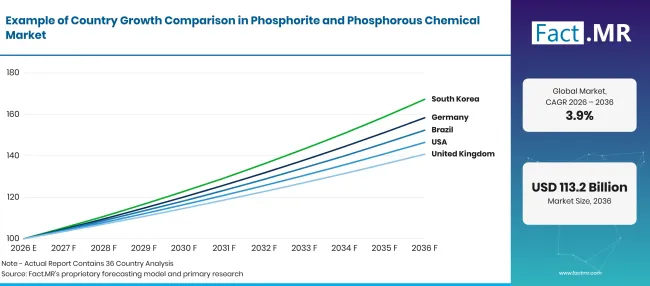
Factmr Phosphorite And Phosphorous Chemical Market Growth Index | Source: Fact.MR
| Country | CAGR (2026–2036) |
|---|---|
| Germany | 4.7% |
| Brazil | 4.3% |
| United States | 3.9% |
| United Kingdom | 3.5% |
| Japan | 3.1% |
Source: Fact.MR analysis. Updated Oct 14, 2026
Why is Germany leading phosphate chemical growth?
4.7% CAGR, supported by regular fertilizer use and industrial phosphate applications.
Germany has demand for phosphate products from both farming and industrial users. Destatis reported 50,856 metric tons of P₂O₅ in domestic phosphate fertilizer sales during the first quarter of 2026 [3]. Fertilizer suppliers plan deliveries around seasonal crop requirements. Industrial customers select phosphate products based on quality and purity needs.
How is Brazil expanding phosphate chemical sales?
4.3% CAGR, driven by large fertilizer requirements and growing local processing capacity.
Brazil relies heavily on crop nutrients and continues to expand its phosphate processing capacity. The National Mining Agency reported planned annual output of 1.05 million metric tons of phosphate fertilizers at the Santa Quitéria project [5]. Fertilizer companies need reliable supplies before major planting seasons. Exchange-rate movements and the cost of imported materials also influence purchasing decisions.
What supports phosphate chemical sales in the United States?
3.9% CAGR, shaped by domestic phosphate-rock production and integrated acid conversion.
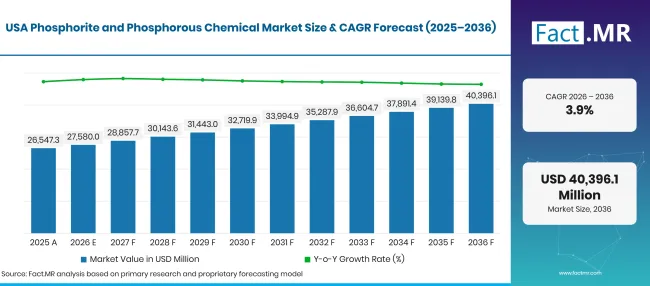
Factmr Phosphorite And Phosphorous Chemical Market Forecast Usa | Source: Fact.MR
The United States has a large phosphate mining industry that supplies fertilizer and chemical manufacturers. The U.S. Geological Survey estimated 20 million metric tons of marketable phosphate rock production in 2025 [1]. Local phosphate production helps support a steady supply of raw materials for downstream industries. Specialty buyers select phosphate products based on quality, concentration, and performance needs.
How is the United Kingdom managing phosphate chemical demand?
3.5% CAGR, supported by measured fertilizer application and specialist chemical distribution.
The United Kingdom uses phosphate fertilizers in a more targeted way, with purchasing often based on crop and soil requirements. Defra reported average phosphate fertilizer use of 10 kg per hectare across crops and grass in 2024 [4]. Fertilizer demand is closely linked to annual farming programs rather than large increases in volume.
Why is Japan more dependent on phosphate inventory planning?
3.1% CAGR, influenced by imported fertilizer feedstocks and tightly managed stocks.
Japan relies heavily on imported phosphate materials, making prices and shipping costs important factors in purchasing decisions. The Ministry of Agriculture reported 2.4 months of ammonium phosphate reserve cover at the end of March 2026 [6]. Fertilizer companies adjust purchases to meet local crop requirements and seasonal demand.
Who leads the Phosphorite and Phosphorous Chemical Market?
The phosphate market includes companies that mine phosphate rock as well as those that produce fertilizer products. Mosaic and OCP Group operate across both mining and fertilizer production, giving them control over raw material supply and processing. Nutrien, EuroChem, and PhosAgro are also active in phosphate fertilizer production.
ICL Group and J.R. Simplot offer phosphate-based fertilizer and chemical products. Innophos focuses on specialty phosphate ingredients used in food and industrial applications. Yara includes phosphate products within its broader fertilizer range. CF Industries is mainly known for nitrogen fertilizers, so its involvement in phosphate products is smaller than that of integrated phosphate producers.
Which companies are the key providers?
Key companies include The Mosaic Company; OCP Group; Nutrien Ltd.; Yara International ASA; EuroChem Group AG; PhosAgro; ICL Group Ltd.; CF Industries Holdings; Innophos Holdings; J.R. Simplot Company.
- The Mosaic Company
- OCP Group
- Nutrien Ltd.
- Yara International ASA
- EuroChem Group AG
- PhosAgro
- ICL Group Ltd.
- CF Industries Holdings
- Innophos Holdings
- J.R. Simplot Company
How is the market segmented?
-
By Product Type
- Fertilizers
- Industrial Chemicals
- Food Additives
- Detergents
- Others
-
By Application
- Agriculture
- Chemical Industry
- Food Industry
- Detergent Industry
- Others
-
By Distribution Channel
- Direct Sales
- Distributors
- Online Retail
- Others
-
By Region
- North America
- Latin America
- Western Europe
- Eastern Europe
- East Asia
- South Asia & Pacific
- Middle East & Africa
Bibliography
- [1] BASF SE. (2025, November 5). Hyundai Transys and BASF unveil modular concept seat using Elastollan® TPU with SCF injection foaming technology.
- [2] Covestro AG. (2025, July 16). Covestro launches advanced flame-retardant encapsulation foam for EV batteries.
- [3] Statistisches Bundesamt (Destatis). (2026, February 6). Production in December 2025: -1.9% on the previous month.
- [4] Statistisches Bundesamt (Destatis). (2026, May 21). Export surplus in trade with United States down 30.5% in 1st quarter of 2026 compared with same quarter of previous year.
- [5] U.S. Census Bureau. (2026, September 1). Value of Construction Put in Place at a Glance: July 2026.
- [6] U.S. Census Bureau. (2026, September 1). Construction Spending (Construction Put in Place): July 2026.
- [7] Ministry of Economy, Trade and Industry. (2025, June 9). Mobility Digital Transformation (DX) Strategy Updated.
- [8] Statistisches Bundesamt (Destatis). (2026, August 7). Exports in June 2026: +0.9% on May 2026.
- [9] U.S. Bureau of Labor Statistics. (2026, October 2). Plastics and Rubber Products Manufacturing: NAICS 326.
- [10] Department for Transport. (2026, April 29). Vehicle licensing statistics: 2025.
- [11] German Association of the Automotive Industry. (2026, January 5). Passenger car production in 2025 slightly above previous year's level.
- [12] German Association of the Automotive Industry. (2026, February 16). Automobile Production.
This Report Addresses
- The report examines the relationship between rock supply and finished phosphate fertilizer or phosphorus chemical sales.
- Segment analysis explains why Fertilizers and Agriculture represent the principal forecast uses.
- Channel analysis discusses direct contracts and the part played by chemical distributors.
- Country comparisons examine phosphate import exposure and domestic production across five markets.
- The competitive overview separates integrated fertilizer makers from specialty phosphate suppliers.
- Cost analysis considers rock quality, conversion plants and freight terms for bulk materials.
What does the Phosphorite and Phosphorous Chemical Market cover?
The market covers mined phosphorite and phosphate-derived chemicals sold for agriculture or industrial use. Finished fertilizers and phosphoric acid are included when they fall within the stated value chain. Chemical grades are distinguished by their end use and product specs.
What is included in the scope?
Phosphate mineral production, phosphoric acid conversion and phosphate fertilizers are included. Downstream food and industrial phosphates are covered where their sales reflect phosphorus chemical use.
What is excluded from the scope?
The assessment excludes unrelated nitrogen and potash sales that contain no phosphate component. It also excludes standalone mining services that do not represent the sale of phosphate rock or phosphate chemicals.
How Was the Analysis Built?
The analysis draws on 120+ sources, 35+ company portfolios, 25+ countries, and more than 20 industry interviews.
- Primary Research: Primary research includes discussions with manufacturers, service providers, technology developers, distributors, end users, and subject-matter experts. These conversations examine purchasing priorities, product adoption, operational challenges, approval requirements, competitive positioning, and the factors that influence wider market acceptance.
- Desk Research: Desk research covers government statistics, regulatory publications, company filings, trade data, technical studies, industry associations, standards, public policy, and other authoritative sources. Every source used in the analysis is documented in the bibliography.
- Market Sizing and Forecasting: Market estimates combine historical performance, demand indicators, pricing and volume trends, segment shares, company participation, country-level growth, adoption patterns, investment activity, and barriers to market expansion.
- Data Validation and Update Cycle: Findings are validated by comparing primary interviews with public data, company activity, regulatory changes, trade patterns, and industry developments. Regular updates review new product launches, capacity changes, partnerships, approvals, and shifts in commercial adoption.
Segmentation
What is the report’s scope and coverage?
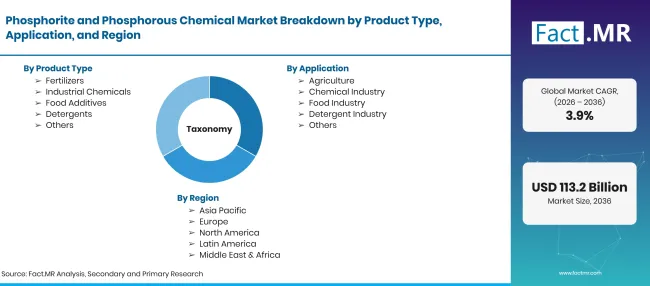
Factmr Phosphorite And Phosphorous Chemical Market Taxonomy | Source: Fact.MR
| Attribute | Details |
|---|---|
| Quantitative Units | USD Billion in 2026 to 2036; 3.9% CAGR |
| Market Definition | Phosphate rock and downstream phosphorus chemicals used in fertilizer and industrial applications. |
| Product Type | Fertilizers; Industrial Chemicals; Food Additives; Detergents; Others |
| Application | Agriculture; Chemical Industry; Food Industry; Detergent Industry; Others |
| Distribution Channel | Direct Sales; Distributors; Online Retail; Others |
| Regions Covered | North America; Latin America; Western Europe; Eastern Europe; East Asia; South Asia & Pacific; Middle East & Africa |
| Countries Covered | Germany; Brazil; United States; United Kingdom; Japan |
| Companies Profiled | The Mosaic Company; OCP Group; Nutrien Ltd.; Yara International ASA; EuroChem Group AG; PhosAgro; ICL Group Ltd.; CF Industries Holdings; Innophos Holdings; J.R. Simplot Company |
| Forecast Period | 2026 to 2036 |
| Approach | Market value and segment forecasts with official mineral, agriculture and trade evidence. |
Source: Fact.MR analysis. Updated Oct 14, 2026
Frequently Asked Questions
How big is the market in 2026?
What is the CAGR between 2026 and 2036?
Which product type has the largest forecast share?
Which distribution channel leads?
Which companies participate?
Who worked on this report


Preview the report firsthand - request a free sample
Free SampleGet the brochure for pricing and purchase details
Download PDF