- Market Value (2025): USD 86.3 Mn
- Estimated Value (2026): USD 96.0 Mn
- Forecast Value (2036): USD 280.0 Mn
- CAGR (2026-2036): 11.3%
What is the Rental Booth Asset Tracking Market forecast to be worth by 2036?
USD 96.0 million in 2026 to USD 280.0 million by 2036 at 11.3% CAGR.
- The rental booth asset tracking market reached USD 86.3 million in 2025 as rental firms increased control over reusable booth inventory.
- Demand is projected to increase from USD 96.0 million in 2026 to USD 280.0 million by 2036.
- The market is forecast to record 11.3% CAGR from 2026 to 2036 as asset availability and return discipline shape buying decisions.
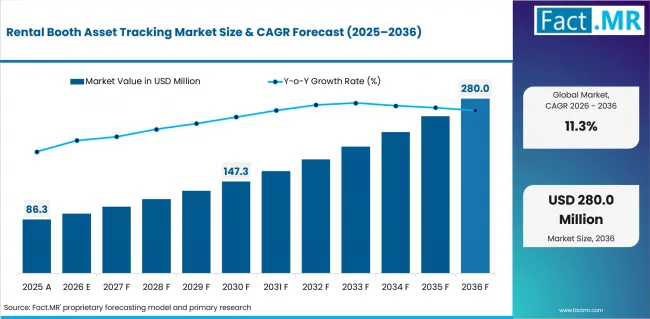
Rental Booth Asset Tracking Market Value Analysis | Source: Fact.MR
What are the defining numbers behind Rental Booth Asset Tracking Market growth?
USD 184.0 million absolute opportunity by 2036, led by QR labels and booth frames alongside inventory check-in/out and cloud SaaS deployment.
- Demand Drivers in the Market
- Larger rental inventories require a simple record for frames and cases that move between customers and cities.
- Loss control improves when teams scan assets during dispatch and return instead of searching for missing parts later.
- Maintenance scheduling becomes easier when damaged frames and graphics are recorded before they are booked again.
- Utilization records help managers decide which reusable assets need replacement and which items can remain in circulation.
- Key Segments Analyzed
- By Tracking Method: QR labels are expected to hold 30.0% share in 2026 as low tagging cost supports fast rollout across mixed booth assets.
- By Asset Type: Booth frames are projected to account for 28.0% share in 2026 since structural parts affect installation timing first.
- By Software Function: Inventory check-in/out is anticipated to capture 31.0% share in 2026 as the function manages daily movement records.
- By Buyer: Exhibit rental firms are estimated to represent 34.0% share in 2026 because repeat-use asset pools require steady control.
- By Deployment: Cloud SaaS is forecast to hold 37.0% share in 2026 as shared access helps warehouse and field teams work from one record.
- Analyst Opinion at Fact.MR
- Shambhu Nath Jha, Senior Analyst at Fact.MR, states, “Rental booth asset tracking creates value when every reusable part has a clean movement record. Providers are expected to earn more trust when check-in discipline and condition history are visible before the next order is loaded.”
- Strategic Implications
- Rental firms should tag high-value and failure-prone assets first. Wider rollout is expected to work better after staff follow the same scanning steps during intake and return.
- Providers can improve comparability by defining responsibility across tags and mobile applications. The same scope should show how records stay current during busy event weeks.
- Venue and agency teams should test scanning discipline during real setup and dismantling work. This check helps prevent a clean software record from failing under venue pressure.
The UAE follows 12.0% CAGR by 2036, supported by strong market expansion. The USA is forecast to grow at 11.3% during the same period. Japan is likely to expand at 11.2% CAGR by 2036, while the United Kingdom is projected to rise at 11.0% CAGR through 2036. Germany is expected to record a 10.7% CAGR from 2026 to 2036.
How does the Rental Booth Asset Tracking Market break down by segment?
QR labels are expected to lead Tracking Method at 30.0% share in 2026. Booth frames are projected to lead Asset Type at 28.0% share in 2026.
Which tracking method holds the largest share?
QR labels are projected to account for 30.0% share in 2026.
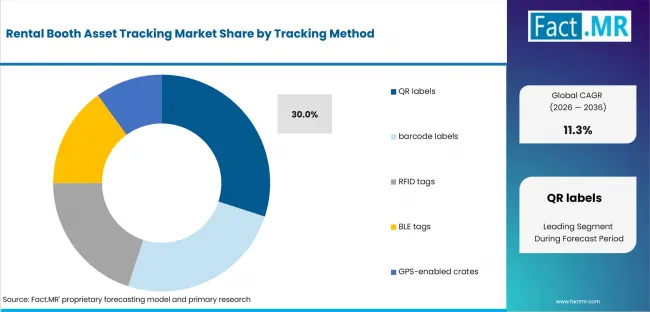
Rental Booth Asset Tracking Market Analysis By Tracking Method | Source: Fact.MR
QR labels offer rental teams an affordable way to identify reusable booth assets without replacing existing warehouse systems. They can be attached easily to frames, cases and display parts. Their effectiveness depends on consistent scanning when equipment is issued, received and inspected.
Why are Booth frames the leading Asset Type?
Booth frames are expected to hold 28.0% share in 2026.
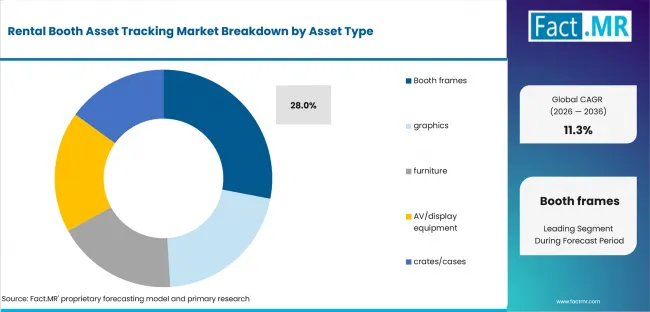
Rental Booth Asset Tracking Market Analysis By Asset Type | Source: Fact.MR
Booth frames form the structural base of most rental exhibits. Missing or damaged units can interrupt installation and create costly delays before an event begins. Tracking allows providers to verify stock levels, physical condition and transport readiness before each shipment.
What makes Inventory check-in/out the main Software Function?
Inventory check-in/out is anticipated to lead with 31.0% share in 2026.
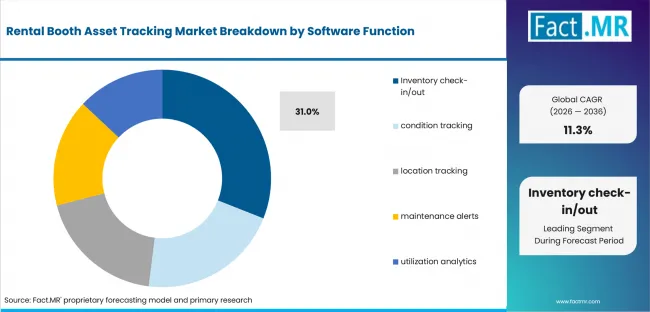
Rental Booth Asset Tracking Market Analysis By Software Function | Source: Fact.MR
Inventory check-in/out records each asset movement between warehouses, vehicles and event sites. This gives staff a clear view of which items are available, rented or awaiting return. Additional integration may be required when booking systems and physical inventory records do not match.
Why do Exhibit rental firms account for the largest Buyer share?
Exhibit rental firms are estimated to represent 34.0% share in 2026.
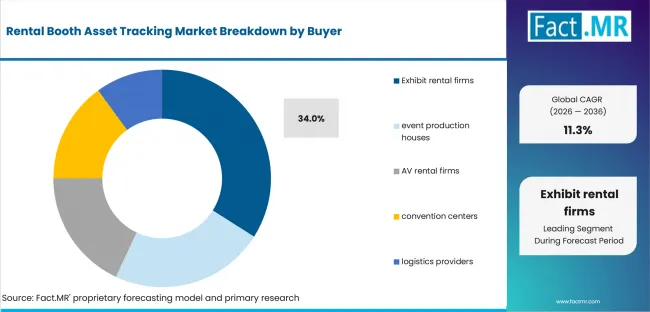
Rental Booth Asset Tracking Market Analysis By Buyer | Source: Fact.MR
Exhibit rental firms earn revenue by using the same equipment across multiple events. Tracking reduces losses and supports better control over frames, graphics and display components. Maintenance history and utilization data also help firms decide when to repair, replace or purchase additional inventory.
How does Cloud SaaS lead the Deployment segment?
Cloud SaaS is forecast to hold 37.0% share in 2026.
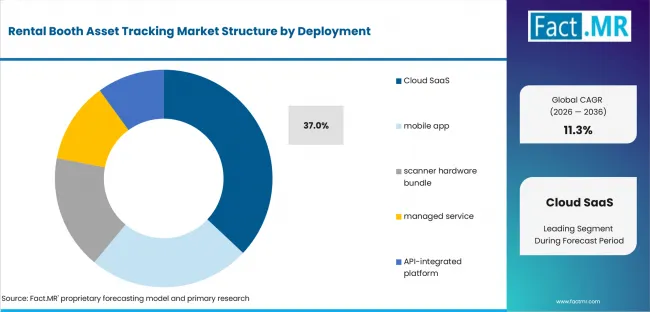
Rental Booth Asset Tracking Market Analysis By Deployment | Source: Fact.MR
Cloud SaaS allows teams at different warehouses and exhibition sites to view the same asset information. It reduces dependence on separate spreadsheets and local records. Successful deployment requires accurate scanning practices, timely updates and clear responsibility for maintaining asset data.
What is accelerating Rental Booth Asset Tracking Market adoption, and what is holding it back?
Demand is growing as rental inventories expand and firms work to reduce asset losses. Adoption may slow because older assets need new tags and staff may not scan items consistently.
Drivers Impact Analysis
| DRIVER | (~) % IMPACT ON CAGR | GEOGRAPHIC RELEVANCE | IMPACT TIMELINE |
|---|---|---|---|
| Larger rental inventories | +3.1% | Global | Short term (<=2 years) |
| Loss and misallocation control | +2.4% | North America and Europe | Short term (<=2 years) |
| Maintenance scheduling | +1.8% | China and UAE | Medium term (2-4 years) |
| Utilization-based purchasing | +1.2% | Mature exhibition markets | Medium term (2-4 years) |
Source: Fact.MR analysis. Updated Jul 28, 2026
- Larger rental inventories: Bigger asset pools are expected to increase the need for formal identification records. The benefit is clearest when staff confirm availability before loading.
- Loss and misallocation control: Tracking records are expected to reduce disputes over missing parts after an event. A clear scan trail separates loss from delayed returns.
- Maintenance scheduling: Condition notes are expected to help teams repair frames and display components before they are booked again. This turns maintenance into a planned step.
- Utilization-based purchasing: Usage history is expected to make replacement decisions more disciplined. Managers can compare active assets with items that remain unused before buying more inventory.
Opportunity Impact Analysis
| OPPORTUNITY | (~) % IMPACT ON CAGR | GEOGRAPHIC RELEVANCE | IMPACT TIMELINE |
|---|---|---|---|
| Predictive refurbishment planning | +2.0% | USA and UK | Short term (<=2 years) |
| Customer-visible asset portals | +1.5% | Germany and Japan | Medium term (2-4 years) |
| Cross-warehouse availability optimization | +1.0% | China and UAE | Medium term (2-4 years) |
Source: Fact.MR analysis. Updated Jul 28, 2026
- Predictive refurbishment planning: Refurbishment planning is expected to widen revenue beyond the first tagging project. Condition records help schedule repainting and part retirement.
- Customer-visible asset portals: Customer portals are expected to give exhibitors more confidence in booked assets before the event. The feature has value when the customer view matches the warehouse record.
- Cross-warehouse availability optimization: Multi-location rental firms are expected to use availability records to avoid duplicate purchases. The benefit weakens if scan discipline differs between warehouses.
Restraints Impact Analysis
| RESTRAINT | (~) % IMPACT ON CAGR | GEOGRAPHIC RELEVANCE | IMPACT TIMELINE |
|---|---|---|---|
| Tagging effort for legacy stock | -2.1% | Cost-sensitive regional markets | Short term (<=2 years) |
| Incomplete scanning discipline | -1.6% | Highly active venues | Medium term (2-4 years) |
| Integration with quoting and logistics systems | -1.1% | Global | Short term (<=2 years) |
Source: Fact.MR analysis. Updated Jul 28, 2026
- Tagging effort for legacy stock: Older inventory can slow adoption when parts need labels and records before the system is useful. Providers should phase the work by asset value.
- Incomplete scanning discipline: Missed scans can weaken trust in the record even when the software fits the task. Training and supervisor checks are expected to limit this risk.
- Integration with quoting and logistics systems: Adoption can stall when sales orders and warehouse records do not match. Written ownership rules help decide who updates each handoff.
Which countries are scaling Rental Booth Asset Tracking Market fastest?
The country comparison is defined more by event throughput and rental operating discipline than by the CAGR ranking alone. China and the UAE form the upper group. The USA and Japan remain close to the global average. The UK and Germany track slightly lower but remain shaped by recurring exhibition activity.
- The UAE follows closely with large venues and international events that place pressure on quick asset turnaround.
- USA demand remains close to the global rate as mature exhibitors already expect measurable operating records.
- Japan’s position reflects compact storage conditions and careful operating discipline across rental asset pools.
- The UK remains supported by recurring exhibitions where the same frames and graphics move between events.
- Germany grows through documentation-heavy buying and trade-fair activity that rewards clean asset assignment before setup.
Comparable CAGRs can therefore produce different entry conditions across these countries. Deployment timing depends on scan discipline and local service depth. Commercial readiness also depends on whether the system makes asset availability easier to verify before the event opens.
The full report provides country-level CAGR analysis across North America and Europe. It also covers East Asia and the Middle East and Africa.
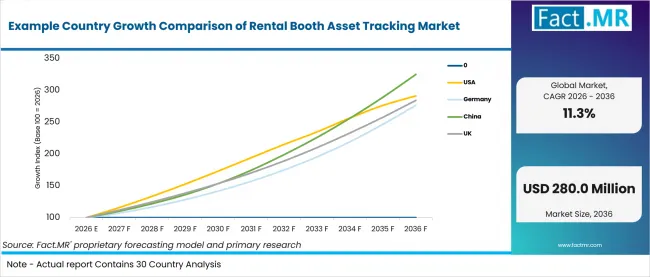
Example Country Growth Comparison Of Rental Booth Asset Tracking Market | Source: Fact.MR
| Country | CAGR (2026-2036) |
|---|---|
| UAE | 12.0% |
| USA | 11.3% |
| Japan | 11.2% |
| UK | 11.0% |
| Germany | 10.7% |
Source: Fact.MR analysis. Updated Jul 28, 2026
What supports USA adoption?
11.3% CAGR, supported by measurement-led exhibitor procurement.
The USA market is shaped by rental companies that increasingly connect asset records with quoting, utilization and post-show reporting. Large exhibit programs create a need to know which frames, cases and graphics are available before a proposal is confirmed. Adoption will be strongest where scanning fits existing warehouse routines and produces records that commercial teams can use without extra manual reconciliation.
What is driving UAE growth from 2026 to 2036?
12.0% CAGR, driven by high event throughput and international participation.
The UAE market benefits from closely scheduled exhibitions that leave little time to inspect, repair and redeploy booth equipment. Asset tracking helps providers identify missing parts and condition issues before the next installation begins. International exhibitors also increase the need for accurate handover records. Local onboarding, fast technical support and simple mobile access are likely to influence supplier selection.
How is Japan developing demand?
11.2% CAGR, backed by compact systems and reliable operation.
Japan’s growth is linked to tightly managed rental inventories where space efficiency and accurate location records matter. Buyers are likely to prefer gradual tagging programs that improve control without making warehouse work more complex. Simple mobile tools, clear asset histories and dependable check-in processes may carry more value than large feature sets. Systems that reduce handling errors without adding extra steps will be better placed.
What is supporting UK market expansion?
11.0% CAGR, supported by recurring exhibitions and repeat-use assets.
The UK market is developing around frequent reuse of booth frames, graphics and display components across regional event schedules. Tracking becomes valuable when the same asset moves through storage, refurbishment and multiple venues. Rental firms can use return records to decide which items need repair before the next booking. Providers that connect asset condition with maintenance planning are likely to gain stronger acceptance.
How does Germany perform?
10.7% CAGR, driven by documentation-heavy trade-fair requirements.
Germany’s growth is shaped by detailed installation checks and a strong focus on asset condition before exhibition setup. Rental firms need clear records showing that frames, cases and technical components have been inspected and approved for use. Older inventory may slow rollout because each item must be tagged and entered correctly. Adoption will depend on structured implementation plans rather than fast system replacement.
Who leads the Rental Booth Asset Tracking Market?
Cheqroom and Rentman show the clearest direct fit for equipment checkout and event-rental workflows. Asset Panda, Sortly and EZO strengthen the broader asset-control landscape.
Cheqroom supports equipment checkout workflows through QR and barcode scanning. Rentman fits event-rental operations where quotations and inventory planning must stay coordinated. Asset Panda and Sortly add mobile audits and barcode-based asset control for organizations with mixed equipment pools. EZO adds checkout and lifecycle records for multi-location equipment teams.
By 2036, competition is expected to depend on ease of tagging and staff scan discipline. Providers are expected to gain preference when the platform stays simple during dispatch and return work. Rental firms are also likely to test whether records remain useful at busy show sites.
Which companies are the key providers?
Key companies include the five active providers listed below.
- Cheqroom
- Rentman
- Asset Panda
- Sortly
- EZO
Bibliography
- European Commission. (2026, July 14). Commission Implementing Decision (EU) 2026/1736 on harmonised standards for digital product passports. EUR-Lex.
- European Commission, Directorate-General for Internal Market, Industry, Entrepreneurship and SMEs. (2025, April 9). Commission launches consultation on the Digital Product Passport.
- Sortly. (2025, April 8). How to use QR codes for asset tracking.
- South Yorkshire Fire & Rescue. (2026, March 9). Operational asset distribution, tracking and management solution. Contracts Finder.
This Report Answers
- The report provides strategic intelligence on the Rental Booth Asset Tracking Market across Tracking Method and Asset Type choices that shape rental asset-control decisions.
- Segment analysis covers QR labels and booth frames as the share leaders within the 2026 market.
- Country outlook evaluates China and the UAE alongside the USA and Japan. The UK and Germany complete the growth comparison across the profiled markets.
- Competitive analysis profiles Cheqroom and Rentman alongside Asset Panda and Sortly. EZO completes the provider set.
- Software-function assessment covers inventory check-in/out and condition tracking. Location tracking and maintenance alerts complete the process view alongside utilization analytics.
What does the Rental Booth Asset Tracking Market cover?
Software and identification systems are used to locate and check reusable exhibition-rental assets.
The Rental Booth Asset Tracking Market covers asset tags and mobile applications configured for exhibition-rental operations. Coverage extends to scanners and cloud inventory functions. The platform must help teams control reusable booth assets during intake and dispatch. It is included only when the product serves the event-rental workflow.
The market differs from broader event equipment because commercial value comes from keeping reusable parts visible through several event cycles. General accounting software remains outside the boundary. Vehicle fleet systems and event registration tools are excluded unless they directly control booth assets.
What is included in the scope?
Rental booth asset tracking systems are used by exhibit rental firms and event production houses. AV rental firms, convention centers and logistics providers are also included.
The scope includes Tracking Method and Asset Type alongside Software Function, Buyer and Deployment. Coverage spans QR labels and barcode labels. RFID tags and BLE tags complete the tracking scope alongside GPS-enabled crates. Booth frames and graphics remain in scope when they are reusable rental assets.
What is excluded from the scope?
General event management tools and unrelated venue services remain outside the scope of this market.
The scope excludes floor-space rental and exhibitor services that do not deliver asset-control functions. Standalone accounting software is excluded. Vehicle fleet systems and labor services are excluded unless demand depends on booth asset records. Company revenue without a clear rental booth tracking connection is also excluded.
How Was the Analysis Built?
The analysis draws on 120+ sources, 35+ company portfolios, 25+ countries, and more than 20 industry interviews.
- Primary Research: Primary research includes discussions with manufacturers, service providers, technology developers, distributors, end users, procurement teams, and subject-matter experts. These conversations examine purchasing priorities, product adoption, operational challenges, approval requirements, competitive positioning, and the factors that influence wider market acceptance.
- Desk Research: Desk research covers government statistics, regulatory publications, company filings, trade data, technical studies, industry associations, standards, public policy, and other authoritative sources. Every source used in the analysis is documented in the bibliography.
- Market Sizing and Forecasting: Market estimates combine historical performance, demand indicators, pricing and volume trends, segment shares, company participation, country-level growth, adoption patterns, investment activity, and barriers to market expansion.
- Data Validation and Update Cycle: Findings are validated by comparing primary interviews with public data, company activity, regulatory changes, trade patterns, and industry developments. Regular updates review new product launches, capacity changes, partnerships, approvals, procurement trends, and shifts in commercial adoption.
Segmentation
What is the report’s scope and coverage?
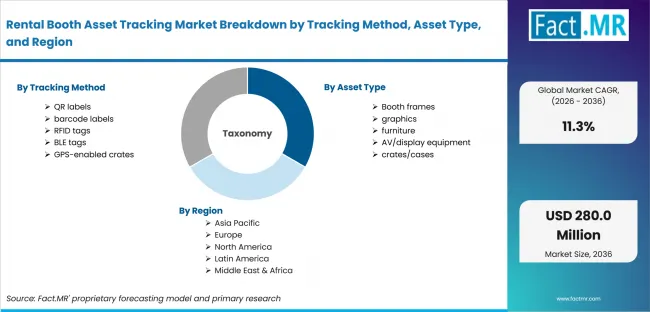
Rental Booth Asset Tracking Market Breakdown By Tracking Method, Asset Type, And Region | Source: Fact.MR
| Attribute | Details |
|---|---|
| Quantitative Units | USD million in 2026 to USD million by 2036 at CAGR |
| Market Definition | Software and identification systems used to locate and check reusable exhibition-rental assets. These systems also support maintenance when configured as a commercial event platform. |
| Tracking Method | QR labels; Barcode labels; RFID tags; BLE tags; GPS-enabled crates |
| Asset Type | Booth frames; Graphics; Furniture; AV/display equipment; Crates/cases |
| Software Function | Inventory check-in/out; Condition tracking; Location tracking; Maintenance alerts; Utilization analytics |
| Buyer | Exhibit rental firms; Event production houses; AV rental firms; Convention centers; Logistics providers |
| Deployment | Cloud SaaS; Mobile app; Scanner hardware bundle; Managed service; API-integrated platform |
| Regions Covered | North America; Europe; East Asia; Middle East and Africa |
| Countries Covered | USA; China; UAE; Japan; UK; Germany |
| Key Companies Profiled | Cheqroom; Rentman; Asset Panda; Sortly; EZO |
| Forecast Period | 2026 to 2036 |
| Approach | Hybrid top-down and bottom-up analysis using exhibition-rental workflows; tracking method demand; asset type demand; software function demand; buyer adoption; deployment patterns; country growth; company participation and adoption barriers |
Source: Fact.MR analysis. Updated Jul 28, 2026
How is the market segmented?
-
By Tracking Method:
- QR labels
- Barcode labels
- RFID tags
- BLE tags
- GPS-enabled crates
-
By Asset Type:
- Booth frames
- Graphics
- Furniture
- AV/display equipment
- Crates/cases
-
By Software Function:
- Inventory check-in/out
- Condition tracking
- Location tracking
- Maintenance alerts
- Utilization analytics
-
By Buyer:
- Exhibit rental firms
- Event production houses
- AV rental firms
- Convention centers
- Logistics providers
-
By Deployment:
- Cloud SaaS
- Mobile app
- Scanner hardware bundle
- Managed service
- API-integrated platform
-
By Region:
- North America
- USA
- Canada
- Latin America
- Brazil
- Mexico
- Rest of Latin America
- Europe
- Germany
- U.K.
- France
- Italy
- Spain
- Rest of Europe
- East Asia
- South Korea
- Japan
- South Asia & Oceania
- Australia & New Zealand
- Rest of South Asia & Oceania
- Middle East & Africa
- GCC Countries
- South Africa
- UAE
- Rest of Middle East & Africa
- North America
Frequently Asked Questions
Which Tracking Method leads the market?
Which Asset Type leads the market?
Which Software Function category leads the market?
Which Buyer leads the market?
Which Deployment leads the market?
Which country records the highest listed CAGR?
What is the primary driver in this market?
What is the main restraint?
Why do exhibit rental firms lead demand?
Who worked on this report


Preview the report firsthand - request a free sample
Free SampleGet the brochure for pricing and purchase details
Download PDF