- Market Value (2025): USD 665.0 Mn
- Estimated Value (2026): USD 780.0 Mn
- Forecast Value (2036): USD 3850.0 Mn
- CAGR (2026-2036): 17.3%
What is the Reusable Booth Systems Market forecast to be worth by 2036?
USD 515.0 million in 2026 to USD 875.0 million by 2036 at 5.4% CAGR.
- The reusable booth systems market reached USD 488.4 million in 2025 as multi-show programs increased the need for booth assets that travel across events without repeated rebuilds.
- Market revenue is projected to move from USD 515.0 million in 2026 to USD 875.0 million by 2036.
- The market is forecast to record 5.4% CAGR from 2026 to 2036 through lifecycle cost control and faster booth configuration.
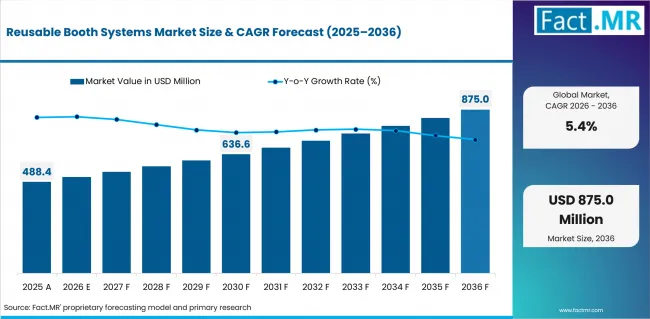
Reusable Booth Systems Market Value Analysis | Source: Fact.MR
What are the defining numbers behind Reusable Booth Systems Market growth?
USD 360.0 million absolute opportunity is expected by 2036 with aluminum modular frames and inline 10x10 booths forming the main segment base.
- Demand Drivers in the Market
- Multi-show capital efficiency is expected to widen demand because exhibitors can spread one booth investment across several shows. The purchase case becomes clearer when providers record reuse cycles and refurbishment responsibilities.
- Faster configuration changes are expected to matter most for exhibitors using one brand kit across different booth footprints. Indexed components and replaceable graphics reduce on-site decisions during tight move-in windows.
- Brand-program standardization is projected to support adoption when regional event staff need the same display quality across repeated shows. Documented components and approved layout rules then become part of provider selection.
- Key Segments Analyzed
- By System Type: Aluminum modular frames are expected to hold 31.0% share in 2026. Their position reflects the need for durable structures that can be rebuilt across show formats.
- By Booth Size: Inline 10x10 booths are projected to account for 28.0% share in 2026. The footprint fits compact aisles and supports repeatable rental planning.
- By Ownership Model: Rental inventory is anticipated to capture 36.0% share in 2026. The model gives exhibitors access to reusable systems without full asset ownership.
- By End User: B2B exhibitors are estimated to represent 30.0% share in 2026. Frequent trade-show calendars keep repeat deployment and setup reliability central to procurement.
- By Material Base: Anodized aluminum is forecast to hold 34.0% share in 2026. The material supports repeated assembly and a clean visible finish.
- Analyst Opinion at Fact.MR
- Shambhu Nath Jha, Sr. Consultant at Fact.MR, states, “Reusable booth systems need proof that the same asset can return to the show floor with a stable finish and predictable fit. Buyers are expected to value documented reuse cycles and replacement access more than broad claims about modularity alone.”
- Strategic Implications
- Event marketing teams should define reuse limits before booth procurement begins. That record helps procurement compare capital spending with rental options and keeps every show from becoming a separate build.
- Exhibit providers can strengthen proposals by separating delivered hardware from installation and refurbishment duties. This makes the service boundary clearer when customers compare modular containers with other reusable event assets.
- Venue operators and agencies should standardize component checks before each deployment. Categories such as digital signage systems and outdoor signage show why display assets need installation-ready documentation.
Dubai World Trade Centre reported in April 2026 that its venues hosted 401 events in 2025. For reusable booth systems, that event density reinforces the need for standardized packing and reassembly routines.
China is projected to record a 7.3% CAGR from 2026 to 2036 with multi-city exhibition programs raising the value of repeated booth deployment. UAE is anticipated to grow at 6.1% through high event throughput and short turnaround windows. USA is expected to post a 5.4% CAGR where exhibitors connect booth spending with measurable event outcomes. Japan is forecast at 5.3% through compact layouts and reliable component handling. UK is estimated to reach 5.1% as regional rental pools support recurring shows. Germany is projected to record a 4.8% CAGR with technical trade fairs keeping documentation standards high.
How does the Reusable Booth Systems Market break down by segment?
Aluminum modular frames are expected to lead System Type at 31.0% share. Inline 10x10 booths are projected to lead Booth Size at 28.0% share in 2026.
Why do Aluminum modular frames lead System Type?
Aluminum modular frames are projected to account for 31.0% share in 2026.
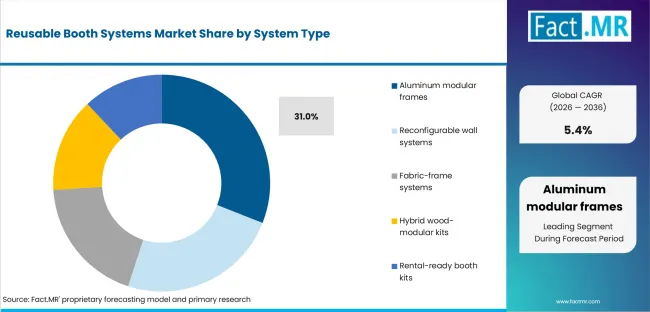
Reusable Booth Systems Market Analysis By System Type | Source: Fact.MR
Durability and flexible configuration give aluminum modular frames the leading position. These structures can support panels, graphics, counters, and lighting across several booth layouts. Their lighter weight also simplifies transport and repeated assembly between events. Clear component labeling further helps exhibitors rebuild the same design after storage without affecting fit or presentation.
Why do Inline 10x10 booths lead Booth Size?
Inline 10x10 booths are projected to account for 28.0% share in 2026.
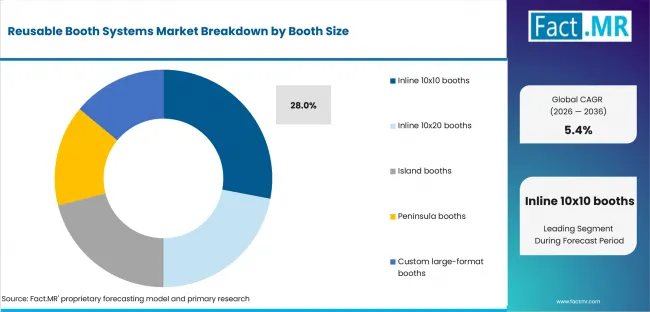
Reusable Booth Systems Market Analysis By Booth Size | Source: Fact.MR
Compact dimensions make inline 10x10 booths suitable for standard exhibition aisles and frequent trade-show programs. Rental companies can store, transport, and prepare these booths with limited turnaround time. Exhibitors can also replace graphics or adjust display elements without rebuilding the entire structure, which supports repeated use across different events.
Why does Rental inventory lead Ownership Model?
Rental inventory is projected to account for 36.0% share in 2026.
Access without full ownership supports the leading position of rental inventory. Exhibitors can use frames, panels, fabrics, lighting, and counters for individual events while avoiding long-term storage and maintenance costs. Rental providers can circulate the same system across several customers when inspection, refurbishment, and replacement procedures are properly managed.
Why do B2B exhibitors lead End User?
B2B exhibitors are projected to account for 30.0% share in 2026.
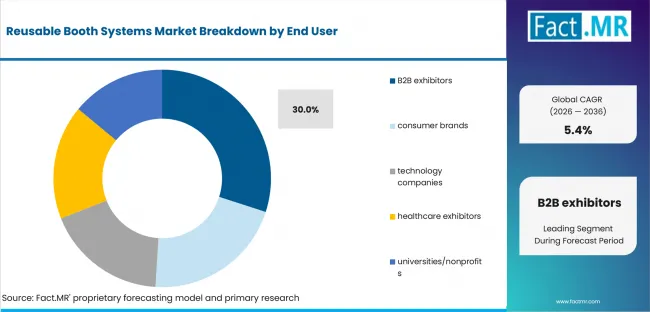
Reusable Booth Systems Market Analysis By End User | Source: Fact.MR
Frequent participation in trade shows keeps B2B exhibitors at the forefront of demand. Booth quality directly affects product demonstrations, client meetings, and brand presentation during business events. Reusable layouts also reduce preparation work across annual exhibition calendars. Reliable installation allows sales staff to concentrate on customer discussions rather than last-minute setup problems.
Why does Anodized aluminum lead Material Base?
Anodized aluminum is projected to account for 34.0% share in 2026.
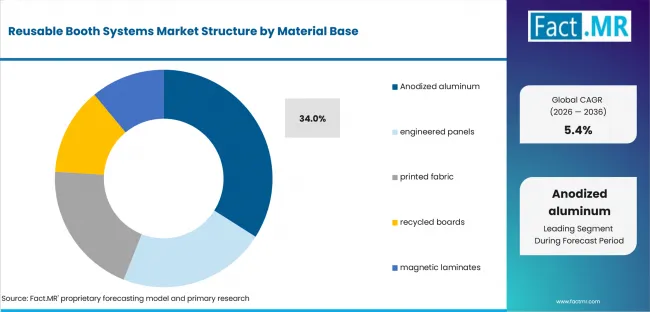
Reusable Booth Systems Market Analysis By Material Base | Source: Fact.MR
Repeated handling favors anodized aluminum because it combines low weight with a clean and durable surface. Booth structures made from this material are easier to move between venues and require fewer appearance corrections after storage. Its finish also supports premium visual presentation, which matters when exhibitors reuse the same frame system across several events.
What is accelerating Reusable Booth Systems Market adoption, and what is moderating its pace?
Demand is expected to be shaped by lifecycle cost control and repeatable booth configuration. Adoption pace is expected to depend on storage planning and component compatibility across reuse cycles.
Drivers Impact Analysis
| DRIVER | (~) % IMPACT ON CAGR | GEOGRAPHIC RELEVANCE | IMPACT TIMELINE |
|---|---|---|---|
| Multi-show capital efficiency | +1.5% | North America and Europe | Short term (<=2 years) |
| Lower rebuild waste | +1.1% | China and UAE | Short term (<=2 years) |
| Faster configuration changes | +0.9% | Mature exhibition markets | Medium term (2-4 years) |
| Brand-program standardization | +0.6% | Global | Medium term (2-4 years) |
Source: Fact.MR analysis. Updated Jul 27, 2026
- Multi-show capital efficiency: Exhibitors are expected to compare reusable booth systems with repeated carpentry spending across annual show calendars. The driver becomes stronger when providers prove reuse cycles and repair routines before approval.
- Faster configuration changes: Event staff value systems that move from one footprint to another without a full redesign. Indexed components and approved layout rules are expected to shorten setup decisions.
- Brand-program standardization: Regional marketing groups need the same visual outcome across recurring events. Standardized booth kits are expected to support that requirement when frames and graphics remain documented.
Opportunity Impact Analysis
| OPPORTUNITY | (~) % IMPACT ON CAGR | GEOGRAPHIC RELEVANCE | IMPACT TIMELINE |
|---|---|---|---|
| Regional rental pools | +1.0% | USA and UK | Short term (<=2 years) |
| Component refurbishment services | +0.7% | Germany and Japan | Medium term (2-4 years) |
| Digital inventory configuration | +0.5% | China and UAE | Medium term (2-4 years) |
Source: Fact.MR analysis. Updated Jul 27, 2026
- Regional rental pools: Local rental pools are expected to improve access for exhibitors that need recurring booths without full ownership. The opportunity depends on consistent component quality after storage and transport.
- Component refurbishment services: Refurbishment is expected to extend the life of frames and panels between shows. Providers that define repair duties can keep reusable systems commercially credible across more deployments.
- Digital inventory configuration: Configuration tools are expected to help providers track components and approved layouts before each event. The opportunity is strongest when the tool reduces errors during packing and setup.
Restraints Impact Analysis
| RESTRAINT | (~) % IMPACT ON CAGR | GEOGRAPHIC RELEVANCE | IMPACT TIMELINE |
|---|---|---|---|
| Storage and reverse-logistics cost | -1.0% | Cost-sensitive regional markets | Short term (<=2 years) |
| Mixed-generation component compatibility | -0.8% | Highly regulated venues | Medium term (2-4 years) |
| Damage accumulation across reuse cycles | -0.5% | Global | Short term (<=2 years) |
Source: Fact.MR analysis. Updated Jul 27, 2026
- Storage and reverse-logistics cost: Reusable booths require storage and return transport between shows. Adoption pace improves when providers give customers clear cost schedules and inspection steps before contract approval.
- Mixed-generation component compatibility: Older frames and newer panels require careful matching during installation. The impact is easier to manage when providers maintain component maps and remove unsupported parts from active stock.
- Damage accumulation across reuse cycles: Repeated handling can affect finish quality and fitting strength. Inspection records help customers treat a reusable booth as a reliable multi-show asset.
Which countries are scaling Reusable Booth Systems Market fastest?
The country comparison is defined by event frequency and rental-system depth across each market. China and UAE form the upper growth pair above the global CAGR. USA and Japan remain close to the global path. UK and Germany show measured expansion through recurring events and documentation-led trade fairs. The ranking reflects operating conditions more than event size alone.
- UAE remains close to China because high event throughput rewards fast installation and reliable service support. Reusable systems gain more value when storage and setup tasks follow one documented process.
- USA follows the global CAGR path where exhibitors connect booth investment with measurable event outcomes. The approval case improves when providers show how reusable structures protect brand appearance across several shows.
- Japan stays near the middle of the range because compact layouts favor accurate components and controlled handling. Providers can strengthen adoption by matching smaller footprints with repeatable graphics and lighting.
- UK demand is supported by recurring exhibitor programs and regional rental pools. The market is expected to favor providers that combine booth availability with quick refresh work between events.
- Germany records a measured CAGR because technical trade fairs place more weight on documentation and installation precision. Adoption improves where providers make storage planning and compatibility review easier before purchase.
Comparable CAGRs can therefore produce different market entry conditions. Reusable booth providers need to match sales routes with local storage and refurbishment expectations.
The full report provides country-level CAGR analysis across North America, Latin America, Europe, East Asia, South Asia & Oceania, and the Middle East & Africa.
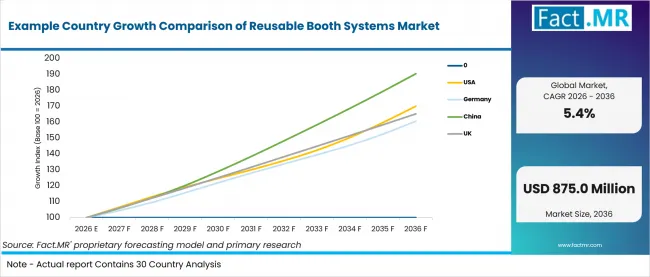
Example Country Growth Comparison Of Reusable Booth Systems Market | Source: Fact.MR
| Country | CAGR (2026-2036) |
|---|---|
| UAE | 6.1% |
| USA | 5.4% |
| Japan | 5.3% |
| UK | 5.1% |
| Germany | 4.8% |
Source: Fact.MR analysis. Updated Jul 27, 2026
How is UAE scaling demand?
6.1% CAGR, driven by dense event schedules and short installation windows.
UAE demand benefits from a busy calendar of business exhibitions where booth preparation often takes place within limited timeframes. Reusable systems help exhibitors move faster when components arrive organized and ready for installation. Local storage, repair support, and rapid setup services are likely to influence supplier selection as companies seek smoother redeployment between consecutive events.
What supports USA adoption?
5.4% CAGR, backed by outcome-based event spending and recurring exhibition programs. U
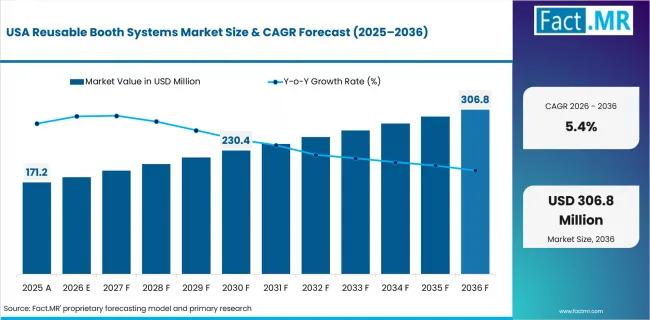
Reusable Booth Systems Market Country Value Analysis | Source: Fact.MR
SA growth is shaped by exhibitors that compare booth expenditure with lead generation, meetings, and commercial returns. Reusable systems improve the spending case by reducing the need for a new build at every show. Buyers are also likely to examine repair coverage, replacement-part availability, and service continuity before selecting a long-term booth solution.
How does Japan perform?
5.3% CAGR, supported by compact layouts and precise component handling.
Japan’s market reflects a preference for orderly installation and efficient use of limited exhibition space. Lightweight frames and inline booths fit this requirement while allowing graphics and counters to be refreshed between events. Accurate labelling, controlled storage, and careful post-show inspection help preserve fit and appearance across multiple deployment cycles.
What supports UK growth?
5.1% CAGR, driven by recurring trade shows and established rental networks.
K demand is connected to repeat exhibition programs that favor booth systems capable of quick renewal. Rental availability gives exhibitors access to modular structures without taking on full ownership or storage responsibility. Clear agreements covering refurbishment, damaged parts, and turnaround time can strengthen confidence in reusable formats across successive events.
How does Germany perform?
4.8% CAGR, supported by technical trade fairs and documentation-led installation standards.
Germany’s growth is shaped by exhibitions where structural accuracy and visual consistency carry significant importance. Providers are likely to gain attention when they can prove that frames, panels, and connectors remain compatible after several uses. Detailed assembly guidance and dependable refurbishment support also help reduce installation risk during demanding international trade fairs.
Who leads the Reusable Booth Systems Market?
beMatrix and Octanorm have the direct fit with reusable booth systems. Aluvision and Skyline Displays broaden the modular display options available to exhibitors.
beMatrix supports reusable booth programs through tool-free frame systems for stand and event builders. Octanorm contributes modular exhibition systems built around frames and lighted surfaces. Aluvision offers modular stand systems using reusable aluminum structures. Skyline Displays covers custom modular trade show booths and inline display systems. Nimlok and Nomadic Display extend the field through modular displays and portable trade show exhibits.
From 2026 to 2036, competition is expected to depend on documented reuse cycles and post-show refurbishment support. Providers are expected to be compared on how quickly they return a booth to show-ready condition after transport. Companies that connect design and service duties in one program are expected to gain stronger consideration from B2B exhibitors.
Which companies are the key providers?
Key companies include beMatrix, Octanorm, Aluvision, Skyline Displays, Nimlok, and Nomadic Display.
- beMatrix
- Octanorm
- Aluvision
- Skyline Displays
- Nimlok
- Nomadic Display
Bibliography
- Dubai World Trade Centre. (2026, April 7). DWTC welcomes nearly 3 million participants in 2025.
- Japan National Tourism Organization. (2025, September 9). Media information for Visit Japan Travel & MICE Mart 2025.
- National Bureau of Statistics of China. (2025, July 2). Statistical survey system for the exhibition industry.
- Ministry of Commerce of the People’s Republic of China. (2025). Fairs and exhibitions in China 2025.
- beMatrix. Leading system for easy and sustainable event building.
- Octanorm. Modular systems for exhibition, project and cleanroom.
- Aluvision. Modular solutions for exhibition stand construction.
- Skyline Exhibits. Custom exhibit booths and trade show partner.
- Nimlok. Custom, modular and portable display solutions.
- Nomadic Display. Modular and portable trade show display systems.
This Report Answers
- The report provides strategic intelligence on Reusable Booth Systems Market across System Type and Booth Size choices that shape exhibitor procurement.
- Segment analysis covers Aluminum modular frames and Inline 10x10 booths as the share leaders within the 2026 market.
- Country outlook evaluates China and UAE alongside USA and Japan. UK and Germany complete the growth comparison across the profiled markets.
- Competitive analysis profiles beMatrix and Octanorm alongside Aluvision and Skyline Displays. Nimlok and Nomadic Display complete the provider set.
- Use-case assessment covers rental inventory and anodized aluminum. Reconfiguration and refurbishment expectations complete the demand view.
What does the Reusable Booth Systems Market cover?
Complete exhibition structures designed to be dismantled, stored and configured again for later shows.
The Reusable Booth Systems Market covers frames, wall systems, graphics, connectors, counters, and related booth modules sold or rented as a coordinated event solution. Coverage includes systems used in exhibitions and temporary business events. The covered product must support repeated use inside an exhibition workflow.
The market differs from broader event equipment because commercial value comes from repeated deployment and controlled brand presentation. Single-use carpentry, venue floor-space fees, general freight, and unrelated event production services remain outside the valuation.
What is included in the scope?
Reusable booth systems are used across B2B exhibitors, consumer brands, technology companies, healthcare exhibitors, and universities or nonprofits.
The scope includes System Type and Booth Size alongside Ownership Model, End User and Material Base. Coverage spans aluminum modular frames, reconfigurable wall systems, fabric-frame systems, hybrid wood-modular kits, and rental-ready booth kits. It includes inline booths, island booths, peninsula booths, and custom large-format booths when these formats are designed for repeated use.
What is excluded from the scope?
Single-use carpentry, venue floor-space fees, general freight, and unrelated event production services remain outside the scope of this market.
The scope excludes unrelated venue construction, general event management, floor-space rental, and services that do not deliver the defined booth-system function. It also excludes the value of the event or venue in which the solution is used. Permanent site systems and modular cleanroom solutions are excluded unless they are sold as exhibition booth systems.
How Was the Analysis Built?
The analysis draws on 120+ sources, 35+ company portfolios, 25+ countries, and more than 20 industry interviews.
- Primary Research: Primary research includes discussions with manufacturers, service providers, technology developers, distributors, end users, procurement teams, and subject-matter experts. These conversations examine purchasing priorities, product adoption, operational challenges, approval requirements, competitive positioning, and the factors that influence wider market acceptance.
- Desk Research: Desk research covers government statistics, regulatory publications, company filings, trade data, technical studies, industry associations, standards, public policy, and other authoritative sources. Every source used in the analysis is documented in the bibliography.
- Market Sizing and Forecasting: Market estimates combine historical performance, demand indicators, pricing and volume trends, segment shares, company participation, country-level growth, adoption patterns, investment activity, and barriers to market expansion.
- Data Validation and Update Cycle: Findings are validated by comparing primary interviews with public data, company activity, regulatory changes, trade patterns, and industry developments. Regular updates review new product launches, capacity changes, partnerships, approvals, procurement trends, and shifts in commercial adoption.
Segmentation
What is the report’s scope and coverage?
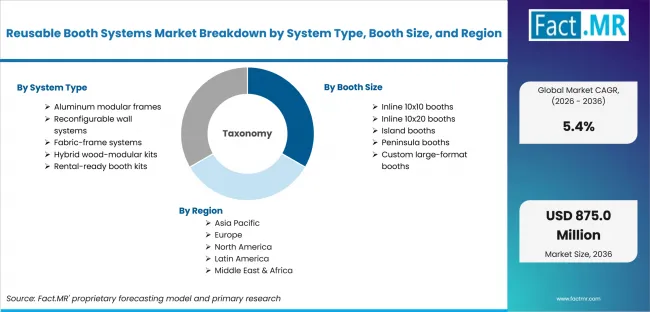
Reusable Booth Systems Market Breakdown By System Type, Booth Size, And Region | Source: Fact.MR
| Attribute | Details |
|---|---|
| Quantitative Units | USD 515.0 million in 2026 to USD 875.0 million by 2036 at 5.4% CAGR |
| Market Definition | Complete reusable exhibition booth systems designed to be dismantled, stored, reconfigured and deployed again across business events while preserving fit and brand appearance |
| System Type | Aluminum modular frames, Reconfigurable wall systems, Fabric-frame systems, Hybrid wood-modular kits, Rental-ready booth kits |
| Booth Size | Inline 10x10 booths, Inline 10x20 booths, Island booths, Peninsula booths, Custom large-format booths |
| Ownership Model | Rental inventory, Brand-owned reusable systems, Agency-managed systems, Venue-managed stock, Distributor-owned stock |
| End User | B2B exhibitors, consumer brands, technology companies, healthcare exhibitors, universities/nonprofits |
| Material Base | Anodized aluminum, engineered panels, printed fabric, recycled boards, magnetic laminates |
| Regions Covered | North America, Latin America, Europe, East Asia, South Asia & Oceania, Middle East & Africa |
| Countries Covered | USA, Canada, Brazil, Mexico, Germany, UK, France, Italy, Spain, South Korea, Japan, China, India, Australia & New Zealand, GCC Countries, South Africa, UAE |
| Key Companies Profiled | beMatrix, Octanorm, Aluvision, Skyline Displays, Nimlok, Nomadic Display |
| Forecast Period | 2026 to 2036 |
| Approach | Hybrid top-down and bottom-up approach using event demand indicators, reusable booth configuration requirements, system type shares, booth size adoption, rental inventory depth, material selection, country growth, company portfolio review, and adoption barriers |
Source: Fact.MR analysis. Updated Jul 27, 2026
How is the market segmented?
-
By System Type:
- Aluminum modular frames
- Reconfigurable wall systems
- Fabric-frame systems
- Hybrid wood-modular kits
- Rental-ready booth kits
-
By Booth Size:
- Inline 10x10 booths
- Inline 10x20 booths
- Island booths
- Peninsula booths
- Custom large-format booths
-
By Ownership Model:
- Rental inventory
- Brand-owned reusable systems
- Agency-managed systems
- Venue-managed stock
- Distributor-owned stock
-
By End User:
- B2B exhibitors
- consumer brands
- technology companies
- healthcare exhibitors
- universities/nonprofits
-
By Material Base:
- Anodized aluminum
- engineered panels
- printed fabric
- recycled boards
- magnetic laminates
-
By Region:
- North America
- USA
- Canada
- Latin America
- Brazil
- Mexico
- Rest of Latin America
- Europe
- Germany
- U.K.
- France
- Italy
- Spain
- Rest of Europe
- East Asia
- South Korea
- Japan
- China
- South Asia & Oceania
- India
- Australia & New Zealand
- Rest of South Asia & Oceania
- Middle East & Africa
- GCC Countries
- South Africa
- UAE
- Rest of Middle East & Africa
- North America
Frequently Asked Questions
Which System Type leads the Reusable Booth Systems Market?
Which Booth Size leads the Reusable Booth Systems Market?
Which Ownership Model leads the Reusable Booth Systems Market?
Which End User leads the Reusable Booth Systems Market?
Which Material Base leads the Reusable Booth Systems Market?
How does UAE perform in the Reusable Booth Systems Market?
How does USA perform in the Reusable Booth Systems Market?
What is the primary driver in this market?
What is the main restraint?
Who worked on this report


Preview the report firsthand - request a free sample
Free SampleGet the brochure for pricing and purchase details
Download PDF