- Market Value (2025): USD 83.7 Mn
- Estimated Value (2026): USD 95.0 Mn
- Forecast Value (2036): USD 337.0 Mn
- CAGR (2026-2036): 13.5%
What is the smart mooring bollards market forecast to be worth by 2036?
USD 95.0 million in 2026 to USD 337.0 million by 2036, at 13.5% CAGR.
- The smart mooring bollards market crossed a valuation of USD 83.7 million in 2025.
- Demand is expected to increase from USD 95.0 million in 2026 to USD 337.0 million by 2036.
- The market is forecast to record 13.5% CAGR during 2026 to 2036 as ports add sensor-based mooring load monitoring to improve berth safety.
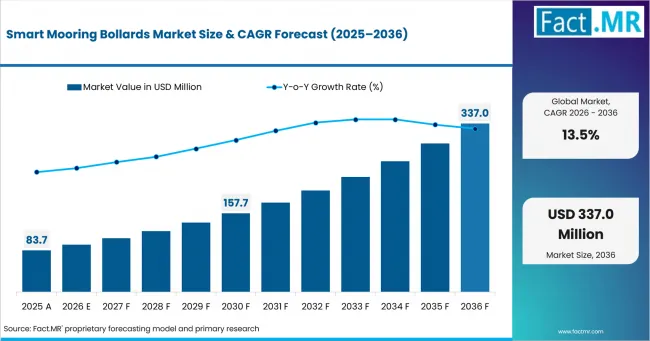
Smart Mooring Bollards Market Market Value Analysis | Source: Fact.MR
What are the defining numbers behind smart mooring bollards growth?
USD 242.0 million absolute opportunity by 2036, led by China and India.
- Demand Drivers in the Market
- Ports need direct load evidence before approving berth operations during high wind and swell conditions.
- Terminal operators need alarm-based visibility when larger vessels remain alongside longer than planned.
- EPC contractors need sensor-ready bollard specifications for quay upgrades and new berth projects.
- Harbor engineers need retrofit systems that avoid full quay reconstruction while improving mooring safety records.
- Key Segments Analyzed
- By Bollard Type: Smart Retrofit Bollards are expected to hold 34.0% share in 2026 because ports can add load visibility to existing quay assets.
- By Sensor Package: Load Cells are projected to capture 38.0% share in 2026 because buyers prefer direct force measurement at the mooring point.
- By Port Type: Container Ports are likely to account for 42.0% share in 2026 as high berth utilization raises the value of live load alarms.
- By Installation: Retrofit is expected to hold 47.0% share in 2026 because brownfield quays outnumber new berth projects.
- By Buyer Type: Port Authorities are forecast to account for 40.0% share in 2026 since berth safety and public infrastructure risk sit with them.
- By Geography: China is projected to record 15.8% CAGR through 2036 as port throughput and berth modernization keep expanding.
- Analyst Opinion at Fact.MR
- Shambhu Nath Jha, Senior Analyst at Fact.MR, states, “Smart mooring bollards are becoming a practical safety layer for ports that cannot rebuild every quay. The value is not only the bollard body. The value is the load record that tells a harbor team whether a berth is operating safely under real conditions.”
- Strategic Implications
- Port authorities should map critical berths before selecting sensor packages.
- Terminal operators should connect bollard load data with weather and vessel movement records.
- EPC contractors should specify calibration access before quay works begin.
- Suppliers should offer retrofit kits with clear service and software responsibilities.
Sensor-enabled bollards form the core of this market because they measure mooring loads directly at the quay. International Maritime Organization rules made Maritime Single Window use mandatory in ports from 1 January 2024. This supports port data readiness and encourages buyers to connect berth equipment with operating systems.
China is projected to record 15.8% CAGR through 2036 as port throughput and berth modernization continue. India is expected to expand at 15.3% CAGR because port capacity growth supports sensor-ready berth upgrades. Singapore is forecast to grow at 14.7% CAGR as record port activity increases the value of real-time berth monitoring. South Korea is expected to advance at 14.3% CAGR as container terminals and shipbuilding links support monitored quay hardware. The United States is projected to rise at 13.8% CAGR as brownfield port upgrades create demand for retrofit monitoring.
How does the smart mooring bollards market break down by segment?
Smart retrofit bollards lead at 34.0%, Load cells lead at 38.0%.
Which bollard type dominates?
Smart Retrofit Bollards account for 34.0% share in 2026.
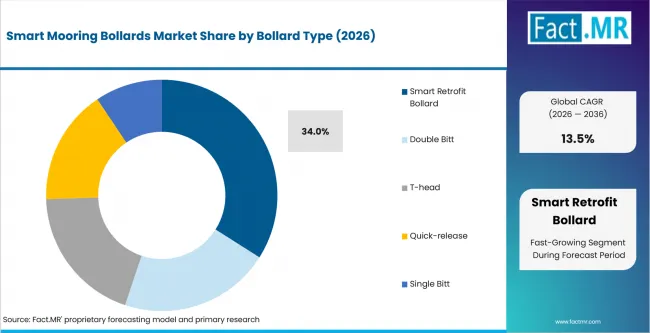
Smart Mooring Bollards Market Analysis By Bollard Type | Source: Fact.MR
Smart Retrofit Bollards lead because most commercial ports already have fixed quay assets. A retrofit package lets the buyer add load monitoring without replacing the full berth layout. This is important where shutdown windows are short and berth access is costly. Suppliers that can certify anchor loads and sensor accuracy gain better access to brownfield projects.
Which sensor package dominates?
Load Cells hold 38.0% share in 2026.
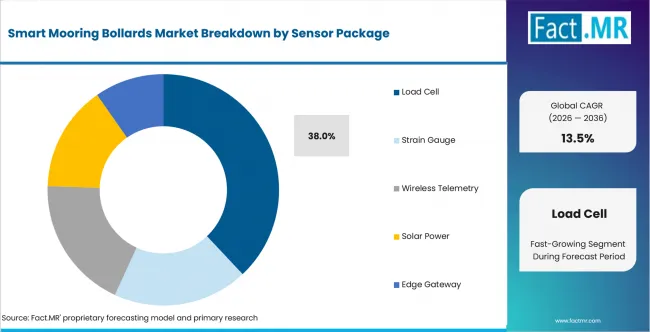
Smart Mooring Bollards Market Analysis By Sensor Package | Source: Fact.MR
Load Cells lead because they give direct force readings at the mooring point. Port engineers can compare line tension with safe working load and alarm thresholds. Straatman states that its Smart Bollard displays load with line angle and weather conditions through a dashboard. [10] This supports buyer preference for measurement that operators can use during a vessel stay.
Which port type dominates?
Container Ports lead with 2.0% share in 2026.
Container Ports lead because berth occupancy and vessel size make line load changes commercially important. Gantry crane work can be affected when a ship moves at the quay. Container terminals also have stronger software ecosystems than smaller general cargo berths. That makes integration of bollard alarms into terminal systems easier.
Which installation type dominates?
Retrofit holds 47.0% share in 2026.
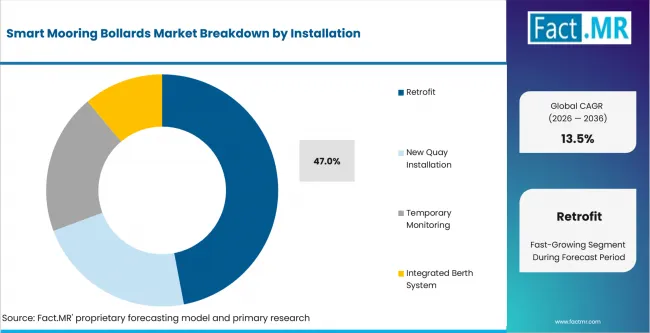
Smart Mooring Bollards Market Analysis By Installation | Source: Fact.MR
Retrofit installations lead because ports prefer staged safety upgrades over full quay rebuilding. Trelleborg described bollards as an important component of berthing operations in March 2025. [9] The same source explains that specification needs cover support structure, anchor hardware and testing. This makes retrofit engineering a service sale rather than a hardware swap.
Which buyer type dominates?
Port Authorities hold 40.0% share in 2026.
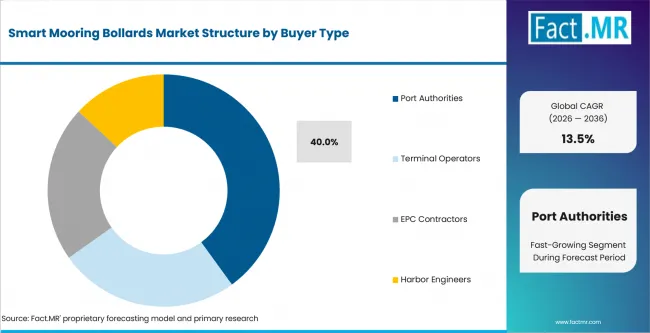
Smart Mooring Bollards Market Analysis By Buyer Type | Source: Fact.MR
Port Authorities lead because they own berth safety obligations and long-life infrastructure planning. Terminal operators are important buyers when concession contracts give them quay upgrade responsibility. EPC contractors influence the specification when a new quay or berth renewal is underway. Harbor engineers often shape whether the system is selected for load proof, alarm reliability or maintenance access.
What is accelerating smart mooring bollards adoption, and what is holding it back?
Port safety data and brownfield quay upgrades support adoption, while harsh marine conditions and calibration needs slow it.
Drivers Impact Analysis
| DRIVER | (~) % IMPACT ON CAGR | GEOGRAPHIC RELEVANCE | IMPACT TIMELINE |
|---|---|---|---|
| Ports moving berth safety records online | +2.8% | Container ports worldwide | Short term (≤ 2 years) |
| Larger vessel calls changing line loads | +2.4% | China; Singapore; Europe | Medium term (2-4 years) |
| Maritime Single Window supporting port data | +2.1% | IMO member states | Short term (≤ 2 years) |
| Retrofit budgets favoring low-disruption upgrades | +1.8% | North America; Europe; East Asia | Medium term (2-4 years) |
| LNG berths needing high-load alarms | +1.5% | Asia; Middle East; Europe | Long term (≥ 4 years) |
Source: Fact.MR analysis. Updated Jul 4, 2026
- Real-time load proof
- Ports are shifting berth checks from visual inspection toward recorded load evidence. This supports sensor upgrades around automated mooring systems and conventional bollard lines. A port team can use alarms when wind or passing traffic increases line force. Buyers therefore ask for repeatable calibration and clear safe working load settings.
- Port data mandates
- Port data exchange has moved from administration into berth operations. Sensor-based port equipment fits this shift when operators want one berth record for arrival, stay and departure. The strongest pull comes from ports that already connect traffic, weather and terminal systems.
- Retrofit-first berth upgrades
- Many berths cannot wait for full reconstruction before safety data improves. Retrofit bollards give ports a smaller project with measurable operating value. The method suits older quay walls where drawings may be incomplete. Suppliers win when they provide site checks, anchor guidance and sensor service plans in one offer.
Opportunity Impact Analysis
| OPPORTUNITY | (~) % IMPACT ON CAGR | GEOGRAPHIC RELEVANCE | IMPACT TIMELINE |
|---|---|---|---|
| Retrofit packages for existing quays | +2.6% | Global, strongest in brownfield ports | Short term (≤ 2 years) |
| Container berth analytics | +2.1% | China; Singapore; United States | Medium term (2-4 years) |
| LNG and tanker berth alarms | +1.9% | Asia; Europe; Middle East | Medium term (2-4 years) |
| API links into port systems | +1.6% | Europe; Singapore; North America | Long term (≥ 4 years) |
| Temporary monitoring for trials | +1.2% | Global | Short term (≤ 2 years) |
Source: Fact.MR analysis. Updated Jul 4, 2026
- Retrofit packages for quays
- Retrofit packages can turn a passive bollard replacement into a monitored berth upgrade. The opening is strongest where ports already specify marine loading arms and other berth systems through EPC contracts. Suppliers can bundle load cells, telemetry and commissioning support. This gives buyers a practical project that does not require a full quay shutdown.
- Data links into berth dashboards
- Container terminals need berth data that operations teams can read quickly. Bollard force alarms can sit beside container handling equipment status and weather feeds. The value improves when the system stores vessel history and alarm events. Straatman states that its platform connects through an application programming interface.
- LNG and tanker load alarms
- LNG and tanker berths have higher safety expectations because mooring failure can affect transfer operations. Load alarms support faster decisions during surge, wind or vessel movement. Port owners can use the data to justify berth limits and support incident reviews. This makes connected bollards a serviceable part of terminal safety management.
Restraints Impact Analysis
| RESTRAINT | (~) % IMPACT ON CAGR | GEOGRAPHIC RELEVANCE | IMPACT TIMELINE |
|---|---|---|---|
| Sensor calibration burden | -1.7% | Global | Short term (≤ 2 years) |
| Harsh quay conditions affecting electronics | -1.4% | Coastal and offshore-exposed ports | Medium term (2-4 years) |
| Unclear responsibility for alarms | -1.3% | Concession ports | Short term (≤ 2 years) |
| Old quay drawings slowing retrofit work | -0.9% | Older European and Asian ports | Medium term (2-4 years) |
| Legacy terminal systems limiting integration | -0.7% | Small and mid-sized ports | Long term (≥ 4 years) |
Source: Fact.MR analysis. Updated Jul 4, 2026
- Sensor calibration burden
- Load measurement must remain trusted after salt exposure, vibration and berth impact. That requirement can slow procurement for connected ship systems and quay-side sensors. Buyers need proof that readings stay useful after installation. Service access and calibration intervals can therefore decide supplier selection.
- Old quay drawings
- Retrofit projects often face missing foundation records or unknown reinforcement details. A supplier may need surveys before recommending load cells or anchor work. This adds cost before the buyer sees the first dashboard. Faster adoption depends on simple site assessment packages and clear responsibility for structural checks.
- Procurement proof gap
- Some ports still buy bollards as static steel or ductile iron hardware. Procurement teams may ask why a sensor package belongs in the same tender. Suppliers need to translate mooring force data into fewer incidents, shorter delays and better berth proof. Without that link, connected bollards remain a pilot purchase.
Which countries are scaling smart mooring bollards fastest?
China 15.8%; India 15.3%; Singapore 14.7%; South Korea 14.3%; United States 13.8%; Germany 12.9%; Netherlands 12.6%
Based on regional analysis, the smart mooring bollards market is segmented into East Asia, South Asia and Pacific. It also covers North America, Western Europe, Latin America and Middle East and Africa.
| Country | CAGR |
|---|---|
| China | 15.8% |
| India | 15.3% |
| Singapore | 14.7% |
| South Korea | 14.3% |
| United States | 13.8% |
| Germany | 12.9% |
| Netherlands | 12.6% |
Source: Fact.MR analysis. Updated Jul 4, 2026
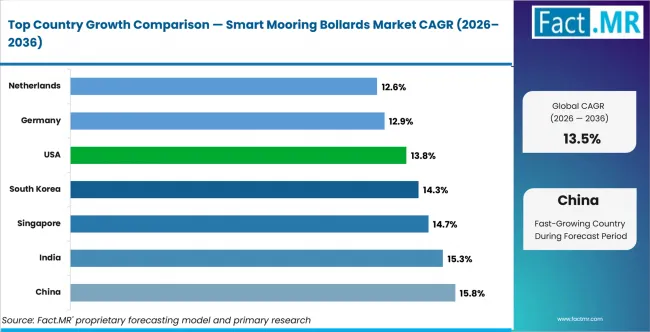
Smart Mooring Bollards Market Cagr Analysis By Country | Source: Fact.MR
What is powering China’s lead?
15.8% CAGR, supported by port throughput and berth modernization.
China is projected to record 15.8% CAGR through 2036. The country handled 5.75 billion tonnes of port cargo during January to April 2025. Port material handling equipment vehicles become more relevant when berth assets need to support faster vessel handling. Smart retrofit bollards fit ports that want load visibility without slowing high-volume quay operations.
Why is India a high-growth buyer base?
15.3% CAGR, driven by capacity expansion and berth upgrades.
India is expected to expand at 15.3% CAGR from 2026 to 2036. Major port capacity reached 1,630 million tonnes per annum by March 2024. The same modernization logic supports sensor-ready berth hardware. Buyers are likely to prefer retrofit packages because active ports cannot remove berth capacity for long periods.
What supports Singapore’s fast adoption?
14.7% CAGR, supported by record port performance and vessel arrivals.
Singapore is forecast to grow at 14.7% CAGR through 2036. The port handled 44.66 million TEUs in 2025. Marine fender systems and connected bollards are specified together when a berth needs safer vessel contact and line load evidence. The country favors systems that connect quickly with port operating platforms.
How is South Korea scaling berth monitoring?
14.3% CAGR, backed by container throughput and terminal investment.
South Korea is expected to advance at 14.3% CAGR by 2036. Korean trade ports handled 31.73 million TEUs in 2024. The country has active container and shipbuilding ecosystems. Suppliers with load monitoring and local service access should gain better positions in terminal upgrades.
What supports the United States outlook?
13.8% CAGR, supported by port performance reporting and brownfield upgrades.
The United States is projected to rise at 13.8% CAGR through 2036. The Bureau of Transportation Statistics reports top-25 port profiles by tonnage, TEU or dry bulk tonnage. This data culture supports equipment that produces traceable berth records. Adoption is likely to focus on high-risk terminals and ports exposed to congestion reviews.
Why does Germany expand below the global rate?
12.9% CAGR, driven by replacement demand and EU port safety expectations.
Germany is forecast at 12.9% CAGR from 2026 to 2036. Eurostat reported that Hamburg remained among Europe’s top three goods ports in 2024. The country has established engineering requirements and disciplined procurement cycles. Suppliers need proof of compliance, service access and integration with existing terminal systems.
How does the Netherlands remain important?
12.6% CAGR, supported by Rotterdam and sensor-based berth pilots.
The Netherlands is expected to post 12.6% CAGR through 2036. Rotterdam gives suppliers a reference base for real-time mooring load monitoring. The opportunity is concentrated in retrofit expansion and repeat service contracts.
Who leads the smart mooring bollards landscape?
Trelleborg Marine & Infrastructure, Straatman and Prosertek lead through mooring hardware and load monitoring experience.
Smart mooring bollards are used by port authorities and terminal operators that need trusted berth safety evidence. Trelleborg Marine & Infrastructure supports bollards, Quick Release Hooks and load monitoring through its marine portfolio. Straatman offers Smart Bollards that measure load, line direction and conditions through MoorControl. Prosertek supplies harbor equipment including bollards, quick release hooks and berthing aid systems.
Trelleborg stated that Mampaey strengthens vessel berthing and mooring capabilities for LNG, petrochemical and commercial port applications. Mooring connector equipment suppliers can use similar service depth when ports ask for monitored hardware instead of passive fixtures.
Cavotec is not a bollard supplier in the narrow sense, but its MoorMaster deployment shows how berth buyers value faster and safer mooring operations. Cavotec reported that its Tangier installation reached 45 units. The units covered an 800-meter quay segment. Trailer terminal tractors and berth-side equipment are increasingly evaluated together when terminals model vessel turnaround.
Providers with direct load measurement, installation support and software integration are better placed. Hardware-only suppliers can win standard bollard orders, but they face pressure when buyers ask for operational proof. The strongest position through 2036 belongs to companies that combine bollard engineering, sensor calibration and port software access.
Which companies are the key players?
Trelleborg Marine & Infrastructure; Straatman; Prosertek; Glen Engineering; ShibataFenderTeam; LCM Systems and Cavotec.
- Trelleborg Marine & Infrastructure
- Straatman Mooring Systems
- Prosertek
- Glen Engineering
- ShibataFenderTeam
- LCM Systems
- Cavotec
Bibliography
- International Maritime Organization. (2024, January 31). Maritime Single Window: Advancing digitalization in shipping.
- World Ports Sustainability Program. (2026, April). IAPH World Ports Tracker 2026 reveals state of global port sustainability.
- The State Council of the People’s Republic of China. (2025, June 1). Cargo throughput at China’s ports logs solid growth in January–April.
- Press Information Bureau, Government of India. (2024, December 31). Year End Review of Ministry of Ports, Shipping and Waterways 2024.
- Maritime and Port Authority of Singapore. (2026, January 13). Singapore posts record port performance in 2025 and develops future readiness through industry collaborations for 2026.
- Ministry of Oceans and Fisheries, Republic of Korea. (2025, January 24). Korea’s ports handle record-high container volume of 31.73 million TEUs in 2024.
- Bureau of Transportation Statistics. (2026, January 14). 2026 Port Performance Freight Statistics Program: Annual Report to Congress.
- Eurostat. (2025, November). Maritime transport of goods: Annual data. Statistics Explained.
- Trelleborg Marine & Infrastructure. (2025, March 24). Simplifying port infrastructure projects: Trelleborg’s updated bollard tool explained.
- Strietman, G. (2024). Smart Bollard: Real-time monitoring of mooring line loads for enhanced port safety and efficiency. Straatman Mooring Systems.
- Trelleborg Marine & Infrastructure. (2024, December 12). Trelleborg acquires Mampaey Offshore Industries, expanding global presence and enhancing vessel berthing expertise.
- Cavotec. (2024, August 21). Cavotec commissions MoorMaster system in APM Terminals MedPort Tangier’s 800 m expansion.
This Report Addresses
- Strategic intelligence on smart mooring bollards across bollard type, sensor package and buyer type.
- Segment analysis covering Smart Retrofit Bollards, Load Cells, Container Ports, Retrofit and Port Authorities.
- Regional outlook covering China, India, Singapore, South Korea, United States, Germany and Netherlands.
- Competitive analysis of Trelleborg Marine & Infrastructure, Straatman, Prosertek, Glen Engineering, ShibataFenderTeam, LCM Systems and Cavotec.
- Product assessment covering load cells, wireless telemetry, solar power and edge gateways.
- Port application assessment covering container ports, cruise terminals, LNG berths, bulk terminals and naval ports.
- Primary interviews, port traffic data, supplier checks and official source review support the forecast.
What does the smart mooring bollards market cover?
Sensor-enabled bollards that measure mooring loads at port berths.
The smart mooring bollards market covers bollards fitted with sensors, communication modules and software interfaces for real-time mooring load monitoring. It includes new quay installations and retrofit bollard packages. The market differs from standard bollard supply because the buyer pays for safety data. The buyer also pays for alarms, calibration and system integration.
What is included in the scope?
Bollard hardware with sensors and berth data integration.
The scope includes single bitt, double bitt, T-head, quick-release and smart retrofit bollards. It covers load cells, strain gauges, wireless telemetry, solar power and edge gateways. It includes container ports, cruise terminals, LNG berths, bulk terminals and naval ports. It also includes installation support, calibration and API-based integration with berth management systems.
What is excluded from the scope?
Standard passive bollards without load monitoring are excluded.
The scope excludes passive bollards sold without sensor packages. It excludes fender systems unless supplied with bollard load monitoring. It excludes automated vacuum mooring systems when no bollard-based measurement is supplied. It also excludes vessel-side mooring line sensors sold without quay hardware.
How was the analysis built?
100+ sources, 40+ company portfolios, 25+ countries, 20+ interviews.
- Primary Research: Primary research includes interviews with port engineers and terminal operations managers. It includes input from EPC contractors, harbor consultants and marine equipment suppliers.
- Desk Research: Desk research reviews port data exchange rules, port freight statistics and supplier product portfolios. It covers bollard specification tools, smart bollard deployments and mooring load monitoring systems.
- Market-Sizing and Forecasting: Forecasting uses berth counts, retrofit intensity and monitored port investment signals. Values were reconciled against port equipment spending and sensor package pricing.
- Data Validation and Update Cycle: Forecasts are validated through supplier checks and port infrastructure signals. Updates track maritime safety rules, port traffic shifts and company product activity.
Segmentation
What is the report’s scope and coverage?
| Attribute | Details |
|---|---|
| Quantitative Units | USD Million in 2026 to USD Million by 2036 at CAGR |
| Market Definition | Sensor-enabled mooring bollards used to measure and report berth line loads |
| Bollard Type | Single Bitt, Double Bitt, T-head, Quick-release, Smart Retrofit Bollard |
| Sensor Package | Load Cell, Strain Gauge, Wireless Telemetry, Solar Power, Edge Gateway |
| Port Type | Container Port, Cruise Terminal, LNG Berth, Bulk Terminal, Naval Port |
| Installation | New Quay Installation, Retrofit, Temporary Monitoring, Integrated Berth System |
| Buyer Type | Port Authorities, Terminal Operators, EPC Contractors, Harbor Engineers |
| Regions Covered | North America, Latin America, Europe, Asia Pacific, Middle East and Africa |
| Countries Covered | China, India, Singapore, South Korea, United States, Germany, Netherlands |
| Key Companies Profiled | Trelleborg Marine & Infrastructure, Straatman, Prosertek, Glen Engineering, ShibataFenderTeam, LCM Systems and Cavotec |
| Forecast Period | 2026 to 2036 |
| Approach | Hybrid top-down and bottom-up approach using berth counts, retrofit intensity, sensor pricing and supplier validation |
Source: Fact.MR analysis. Updated Jul 4, 2026
How is the market segmented?
-
By Bollard Type:
- Single Bitt
- Double Bitt
- T-head
- Quick-release
- Smart Retrofit Bollard
-
By Sensor Package:
- Load Cell
- Strain Gauge
- Wireless Telemetry
- Solar Power
- Edge Gateway
-
By Port Type:
- Container Port
- Cruise Terminal
- LNG Berth
- Bulk Terminal
- Naval Port
-
By Installation:
- New Quay Installation
- Retrofit
- Temporary Monitoring
- Integrated Berth System
-
By Buyer Type:
- Port Authorities
- Terminal Operators
- EPC Contractors
- Harbor Engineers
-
By Region:
- North America
- United States
- Canada
- Mexico
- Latin America
- Brazil
- Argentina
- Rest of Latin America
- Europe
- Germany
- United Kingdom
- France
- Netherlands
- Rest of Europe
- Asia Pacific
- China
- India
- Japan
- South Korea
- Singapore
- ASEAN
- Middle East & Africa
- GCC Countries
- South Africa
- UAE
- Rest of Middle East & Africa
- North America
Frequently Asked Questions
Which bollard type leads the Smart Mooring Bollards Market?
Which country expands faster in the Smart Mooring Bollards Market?
How does India perform in the Smart Mooring Bollards Market?
How does Singapore perform in the Smart Mooring Bollards Market?
How does South Korea perform in the Smart Mooring Bollards Market?
How does the United States perform in the Smart Mooring Bollards Market?
What is the primary driver in the Smart Mooring Bollards Market?
What is the main restraint in the Smart Mooring Bollards Market?
Why are load cells important in this market?
Who worked on this report


Preview the report firsthand - request a free sample
Free SampleGet the brochure for pricing and purchase details
Download PDF