- Market Value (2025): USD 1.3 Bn
- Estimated Value (2026): USD 1.6 Bn
- Forecast Value (2036): USD 10.2 Bn
- CAGR (2026-2036): 20.0%
What is the Supply Resilience Platforms Market forecast to be worth by 2036?
USD 1.6 billion in 2026 to USD 10.2 billion by 2036 at a 20.0% CAGR.
- The supply resilience platforms market reached USD 1.3 billion in 2025.
- Demand is projected to increase from USD 1.6 billion in 2026 to USD 10.2 billion by 2036.
- The market is forecast to record 20.0% CAGR from 2026 to 2036 as procurement teams and logistics operators move resilience work into shared software workflows.
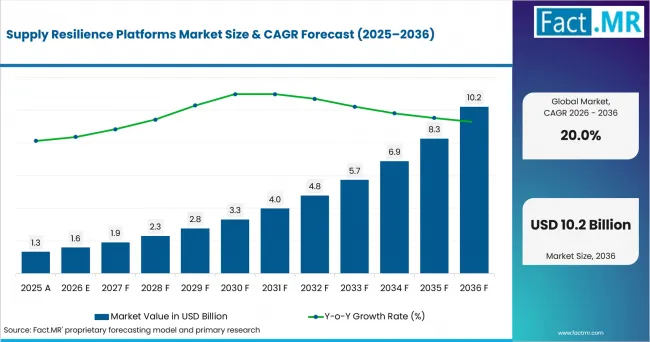
Supply Resilience Platforms Market Value Analysis | Source: Fact.MR
What are the defining numbers behind Supply Resilience Platforms Market growth?
USD 8.5 billion absolute opportunity by 2036, led by subscription pricing, cloud deployment and large enterprise customers.
- Demand Drivers in the Market
- Procurement teams need supplier risk scoring that connects alerts with approved mitigation actions and alternate sourcing routes.
- Supply planners need scenario views since demand changes and port delays can alter production plans within days.
- Logistics operators need route visibility where port flows shape recovery timing. The UK Department for Transport reported on July 29, 2026 that UK ports handled 428.3 million tonnes of freight in 2025.
- Executive teams need financial exposure views so risk work can move into budget decisions and customer-service planning.
- Key Segments Analyzed
- By Offering: Software platform is projected to hold 39.0% share in 2026 due to buyer preference for a persistent system of record for supplier and disruption data.
- By Deployment: Cloud is anticipated to account for 45.0% share in 2026 since cross-border teams need shared access to live risk signals.
- By Capability: Forecasting is estimated to capture 36.0% share in 2026 as planners prioritize early disruption signals before formal recovery work begins.
- By Customer: Large enterprise is forecast to represent 41.0% share in 2026 owing to multi-country supplier networks and dedicated risk teams.
- By Pricing: Subscription is expected to hold 50.0% share in 2026 because customers prefer recurring data coverage and predictable platform access.
- Analyst Opinion at Fact.MR
- Shambhu Nath Jha, Principal Consultant at Fact.MR, states, "Resilience software is becoming a decision layer for teams that own supply commitments. The strongest buying case is expected to come from platforms that connect supplier exposure, inventory impact and recovery action in one workflow. Vendors should combine verified supplier data, scenario reasoning and task ownership so customers can act before a disruption becomes a missed shipment."
- Strategic Implications
- Platform vendors should connect supplier mapping, risk scoring and playbook execution so users work from one event record during a disruption. The workflow should show who owns the action and which order or lane is affected.
- Data providers should document refresh frequency and source lineage because enterprise accounts check how alerts are built before approving automated recommendations. Refresh rules need clear owners when the platform blends trade data, weather alerts and supplier disclosures.
- Implementation partners should align setup with procurement and logistics roles. Korea's Ministry of SMEs and Startups announced on October 24, 2025 that its AI-based Smart Manufacturing Innovation 3.0 strategy targets 12,000 AI-centered smart factories and 500 manufacturing-AI specialist companies.
- Enterprise customers should define response thresholds early since resilience platforms lose value when every alert requires manual escalation.
The USA is projected to post 25.6% CAGR through 2036 because large import flows make supplier exposure expensive to manage manually. South Korea is anticipated to advance at 24.7% as export manufacturers add AI and smart-factory programs to supply planning. Japan is forecast to record 20.6% due to high-value trade flows and policy attention on supply-chain security. The UK is estimated to reach 18.7% as ports and import channels require better disruption visibility. Germany is expected to record 17.0% through industrial order complexity and manufacturing digitalization.
How does the Supply Resilience Platforms Market break down by segment?
Cloud leads Deployment at 45.0%; Subscription leads Pricing at 50.0%.
Which Offering dominates?
Software platform holds 39.0% share in 2026.
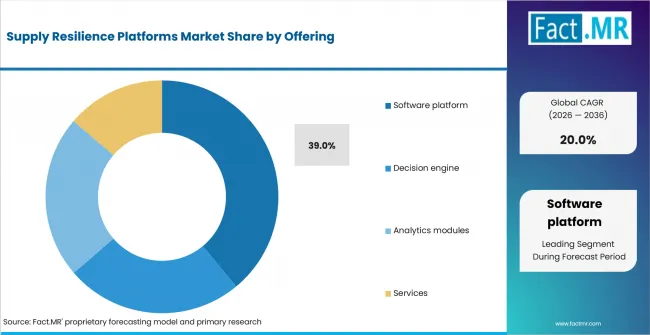
Supply Resilience Platforms Market Analysis By Offering | Source: Fact.MR
Software platforms lead because customers want one environment for supplier records, risk signals and response actions. A single platform carries more value when a delay or tariff change needs an owner and a recovery path. Platform vendors gain when their product connects external event signals to internal planning data with lighter custom work.
What leads the Deployment segment?
Cloud accounts for 45.0% share in 2026.
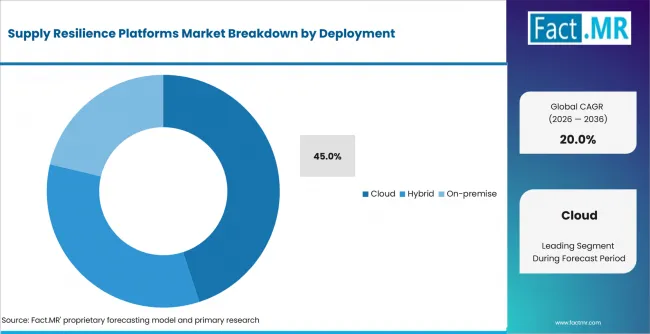
Supply Resilience Platforms Market Analysis By Deployment | Source: Fact.MR
Cloud deployment leads because supply resilience work crosses sites and partner networks. Procurement teams need the same risk view as logistics and planning teams when a route or supplier changes status. The U.S. Census Bureau and BEA reported on February 19, 2026, that U.S. goods imports reached USD 3,438.4 billion in 2025 on a balance-of-payments basis.
How does Capability shape demand?
Forecasting leads with 36.0% share in 2026.
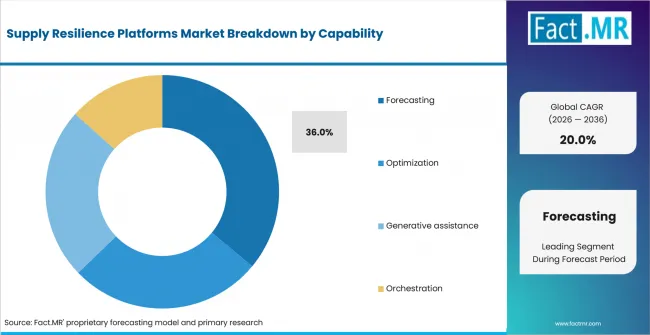
Supply Resilience Platforms Market Analysis By Capability | Source: Fact.MR
Forecasting leads because the first commercial value comes from knowing which disruption needs action. Platforms that connect event signals with delivery commitments help planners decide whether to expedite or build inventory cover.
What supports Large enterprise within Customer?
Large enterprise represents 41.0% share in 2026.
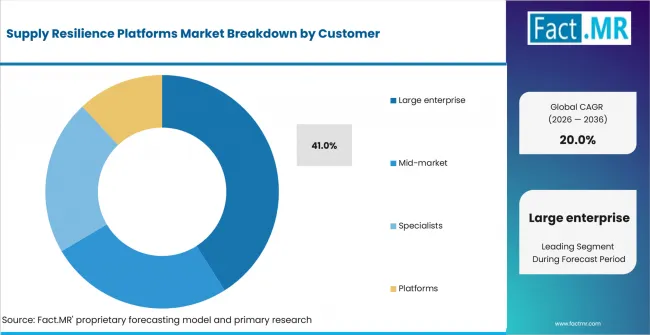
Supply Resilience Platforms Market Analysis By Customer | Source: Fact.MR
Large enterprises lead because they manage more suppliers and more compliance obligations. They have formal owners for procurement, planning, logistics and finance risk. The platform business case is strongest where supplier exposure can be tied to part availability and customer delivery commitments.
What leads Pricing?
Subscription accounts for 50.0% share in 2026.
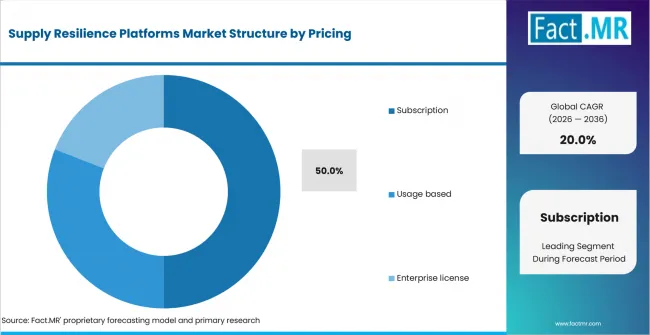
Supply Resilience Platforms Market Analysis By Pricing | Source: Fact.MR
Subscription pricing leads because customers need continuous monitoring instead of one-time assessments. Risk data must be refreshed and supplier maps need maintenance during normal operations. Craft.co announced on March 11, 2026 that it had achieved SOC 2 Type II certification following an independent third-party audit, providing independently verified assurance around the security controls supporting its supplier-intelligence platform.
What is accelerating Supply Resilience Platforms Market adoption, and what is holding it back?
Demand is rising through supplier visibility, import exposure and AI-assisted planning, while adoption is constrained by data quality and workflow integration.
Drivers Impact Analysis
| DRIVER | (~) % IMPACT ON CAGR | GEOGRAPHIC RELEVANCE | IMPACT TIMELINE |
|---|---|---|---|
| Multi-tier supplier exposure and tariff risk | +2.3% | Global | Short term (<= 2 years) |
| Cloud control towers for procurement and planning | +1.7% | North America, Europe, East Asia | Medium term (2-4 years) |
| AI-based forecasting and event triage | +1.2% | USA, South Korea, Japan | Medium term (2-4 years) |
| Enterprise subscription preference for live risk data | +0.8% | Global | Long term (>= 4 years) |
Source: Fact.MR analysis. Updated Aug 25, 2026
- Multi-tier supplier exposure and tariff risk: Enterprise accounts need mapped supplier relationships when tariffs or weather events affect sub-tier inputs. Platform value increases when exposure is tied to spend and customer commitments.
- Cloud control towers for procurement and planning: Shared workflows help users see the same disruption record and assign recovery work faster.
- AI-based forecasting and event triage: Forecasting tools help users separate high-impact disruptions from routine alerts. The strongest use cases connect external events with customer commitments and inventory policy.
Opportunity Impact Analysis
| OPPORTUNITY | (~) % IMPACT ON CAGR | GEOGRAPHIC RELEVANCE | IMPACT TIMELINE |
|---|---|---|---|
| Supplier financial exposure scoring | +1.4% | North America, Europe | Short term (<= 2 years) |
| Connected planning and risk workflows | +1.1% | Global | Medium term (2-4 years) |
| AI-assisted mitigation playbooks | +0.9% | USA, Japan, South Korea | Long term (>= 4 years) |
Source: Fact.MR analysis. Updated Aug 25, 2026
- Supplier financial exposure scoring: Platforms can gain budget access when they quantify revenue at risk and alternative sourcing cost in terms finance teams understand.
- Connected planning and risk workflows: Altana announced on June 11, 2025 that, following a competitive tender, the UK Department for Business and Trade selected the company to continue supporting its Global Supply Chain Intelligence Programme under an £8 million, three-year engagement. The engagement centers on a supply-chain common operating picture for UK government users.
- AI-assisted mitigation playbooks: Generative assistance can convert a risk event into suggested tasks and escalation summaries while planners retain final decision control.
Restraints Impact Analysis
| RESTRAINT | (~) % IMPACT ON CAGR | GEOGRAPHIC RELEVANCE | IMPACT TIMELINE |
|---|---|---|---|
| Supplier master-data gaps | -0.8% | Global | Short term (<= 2 years) |
| Integration with ERP and planning systems | -0.6% | North America, Europe | Medium term (2-4 years) |
| Alert fatigue and unclear ownership | -0.5% | Global | Long term (>= 4 years) |
Source: Fact.MR analysis. Updated Aug 25, 2026
- Supplier master-data gaps: Missing supplier hierarchy, site and part information can limit platform accuracy. Users often need data cleanup before multi-tier mapping becomes decision ready.
- Integration with ERP and planning systems: Resilience tools create more value when risk signals connect to purchase orders and production plans. Integration cost can delay mid-market adoption.
- Alert fatigue and unclear ownership: Teams may ignore alerts when each event lacks a threshold, owner or playbook. Adoption improves when alerts are ranked by commercial impact.
Which countries are scaling the Supply Resilience Platforms Market through 2036?
- The country comparison spans 8.6 percentage points from the USA to Germany.
- The USA remains 0.9 percentage point above South Korea due to deeper enterprise import exposure.
- South Korea remains 4.1 percentage points above Japan as smart-manufacturing policy lifts exporter digitization.
- Japan remains 1.9 percentage points above the UK through high-value trade lanes.
- The UK remains 1.7 percentage points above Germany as port-flow visibility is a clearer platform trigger.
Comparable CAGRs create different entry conditions due to supplier depth, trade exposure and ERP maturity. Full report coverage includes North America, Latin America, Western Europe, Eastern Europe, East Asia, South Asia & Pacific, Middle East & Africa.
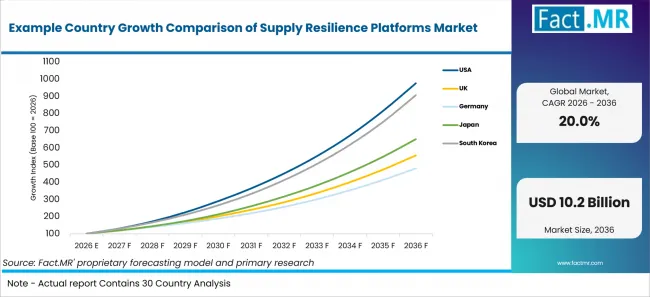
Example Country Growth Comparison Of Supply Resilience Platforms Market | Source: Fact.MR
| Country | CAGR (2026-2036) |
|---|---|
| USA | 25.6% |
| South Korea | 24.7% |
| Japan | 20.6% |
| UK | 18.7% |
| Germany | 17.0% |
Source: Fact.MR analysis. Updated Aug 25, 2026
What supports USA adoption?
25.6% CAGR, supported by import exposure and enterprise risk budgets.
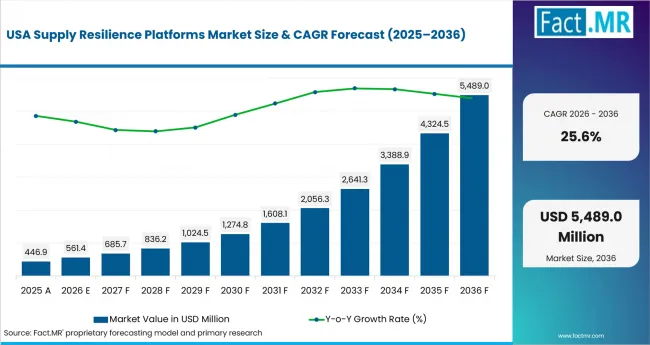
Supply Resilience Platforms Market Country Value Analysis | Source: Fact.MR
U.S. enterprise accounts buy resilience platforms when supplier exposure carries direct financial visibility. The U.S. Census Bureau and BEA reported on February 19, 2026 that U.S. goods and services imports reached USD 4,333.8 billion in 2025. The USA is projected to record 25.6% CAGR through 2036. Platform uptake is expected to concentrate where purchase-order data, supplier sites and logistics alerts can be tied to mitigation actions.
How is South Korea scaling demand?
24.7% CAGR, driven by export scale and AI manufacturing programs.
South Korea links supplier resilience to export reliability in electronics, automotive and machinery networks. MOTIR reported on January 2, 2026 that Korea's exports reached USD 709.7 billion in 2025, up 3.8% year on year. South Korea is anticipated to post 24.7% CAGR through 2036. Adoption is expected to widen where AI factory programs connect production planning with supplier-risk alerts.
How does Japan perform?
20.6% CAGR, backed by trade-flow visibility and supply-chain security needs.
Japanese manufacturers need early signals when high-value export lanes or imported inputs change quickly. Japan Customs reported on August 20, 2026 that provisional, not seasonally adjusted July 2026 exports were JPY 11,511,798 million, up 23.2% year on year. Japan is forecast to record 20.6% CAGR through 2036. Resilience platforms fit buyers that link supplier risk with component availability and economic-security review.
What supports the United Kingdom's growth?
18.7% CAGR, backed by import scale and port-flow visibility.
UK procurement teams use resilience platforms to manage exposure across Europe and non-EU supplier lanes. The Department for Business and Trade reported in August 2026 that UK goods and services imports were GBP 969.3 billion in 2025 at current prices, up 5.6% from 2024. The UK is estimated to reach 18.7% CAGR through 2036. Cloud workflows remain attractive where import alerts must reach category, inventory and logistics owners at the same time.
What supports Germany adoption?
17.0% CAGR, supported by industrial order complexity and manufacturing digitalization.
German industrial customers evaluate resilience platforms through integration quality and supplier-data discipline. Destatis reported on August 6, 2026 that real manufacturing new orders rose 3.1% in June 2026 from the previous month after seasonal and calendar adjustment; the result was provisional. Germany is expected to record 17.0% CAGR through 2036. Adoption is likely to favor platforms that fit ERP routines, supplier-quality records and Manufacturing-X data-space ambitions.
Who leads the Supply Resilience Platforms Market?
Everstream Analytics provides supply-chain risk intelligence, multi-tier visibility and disruption monitoring for procurement, planning and logistics teams. In March 2025, Everstream announced that First Solar had selected its platform for enterprise risk insight and mitigation and supplier data management. Interos.ai provides multi-tier supplier mapping, standardized risk scoring and predictive exposure analytics.
Resilinc provides multi-tier supply-chain mapping and disruption monitoring through capabilities including EventWatchAI, with applications across sectors such as life sciences, aerospace, high tech and automotive. Prewave provides AI-based supplier-risk intelligence, Tier-N transparency, real-time scoring and risk-event detection. These capabilities position the platforms for procurement and supply-chain workflows where supplier exposure must be monitored and translated into mitigation actions.
Altana and Craft.co also operate across supplier-intelligence, compliance and government use cases. Altana achieved Awardable status through the CDAO Tradewinds Solutions Marketplace in April 2025 for its Supply Chain Resilience solution targeting defense supply-chain risks. Craft provides supplier and company intelligence, API access and continuous risk monitoring, while its March 2026 SOC 2 Type II certification provides independently verified assurance around its security controls.
Which companies are the key providers?
Key companies include Everstream Analytics; Interos.ai; Resilinc; Prewave; Altana; and Craft.co.
- Everstream Analytics
- Interos.ai
- Resilinc
- Prewave
- Altana
- Craft.co
Bibliography
- Altana. (2025, April 7). Altana deemed “awardable” for Department of Defense work in the CDAO’s Tradewinds Solutions Marketplace.
- Altana. (2025, June 11). Altana chosen to power UK Government’s Global Supply Chain Intelligence Programme.
- Craft. (2026, March 11). Craft achieves SOC 2 Type II certification.
- Department for Business, Innovation, Science and Trade. (2026, August 20). Trade and investment core statistics book. GOV.UK.
- Department for Transport. (2026, July 29). Port freight annual statistics 2025: Overview of port freight statistics and useful information. GOV.UK.
- Everstream Analytics. (2025, March 4). First Solar selects Everstream Analytics to enhance risk mitigation and multi-tier supply chain visibility.
- Federal Statistical Office. (2026, August 6). New orders in manufacturing in June 2026: +3.1% on the previous month.
- interos.ai. (2026, April 28). interos.ai launches iQ to elevate supply chain risks to the C-Level.
- Ministry of Finance, Japan. (2026, August 20). Value of exports and imports July 2026 (provisional).
- Ministry of Trade, Industry and Resources. (2026, January 2). Korea’s annual exports reach new highs in 2025.
- o9 Solutions. (2025, February 25). o9 and Prewave partner to enhance supply chain risk visibility for clients.
- U.S. Census Bureau, & U.S. Bureau of Economic Analysis. (2026, February 19). U.S. international trade in goods and services, December and annual 2025.
This Report Answers
- The report explains where supply resilience platforms are used across offering, deployment, capability, customer and pricing models. It also covers how platform users turn disruption signals into sourcing and logistics actions.
- Segment analysis identifies the leading subsegments and the operational reasons procurement and planning teams prioritize them. It separates monitoring software from services so recurring platform revenue is clear.
- Country analysis reviews the listed markets and the trade, manufacturing or policy factors shaping platform adoption.
- Competitive analysis reviews providers across predictive risk intelligence, supplier mapping, trade visibility and procurement intelligence.
- Application analysis assesses how alerts, forecasting, orchestration and financial exposure views influence software selection.
What does the Supply Resilience Platforms Market cover?
The Supply Resilience Platforms Market covers software that helps enterprises detect, prioritize and respond to supplier and logistics disruption. It includes risk-intelligence platforms, supplier-mapping tools, forecasting engines and mitigation workflows that connect to procurement and planning systems.
The assessment covers cloud, hybrid and on-premise deployment across large enterprises, mid-market customers and specialist risk teams. It considers how transportation management systems, marketplace logistics orchestration and AI fleet operations intersect with resilience workflows.
What is included in the scope?
The scope includes licensed or subscription supply resilience software, commercial platforms built around supplier-risk data, disruption forecasting, mitigation playbooks and orchestration workflows. It includes tools that support sourcing risk, logistics continuity and operational recovery, including adjacent global logistics automation and smart logistics service use cases.
It includes platforms used by procurement teams, supply planners, logistics managers and enterprise risk teams. It covers supplier intelligence where the platform supports live risk assessment, action tracking and integration with enterprise workflows such as logistics robot deployments and supply chain management BPO support models.
What is excluded from the scope?
The scope excludes general ERP software, standalone transportation execution tools and generic business-intelligence dashboards sold apart from supplier or disruption-risk functionality. It also excludes consulting-only resilience assessments sold apart from a platform component.
Raw logistics data feeds, customs brokerage services and one-time supplier audits are excluded unless they are bundled into a commercial platform that supports monitoring, forecasting or response orchestration.
How Was the Analysis Built?
The analysis draws on 120+ sources, 35+ company portfolios, 25+ countries, and more than 20 industry interviews.
- Primary Research: Primary research includes discussions with manufacturers, service providers, technology developers, distributors, end users, procurement teams, and subject-matter experts. These conversations examine purchasing priorities, product adoption, operational challenges, approval requirements, competitive positioning, and the factors that influence wider market acceptance.
- Desk Research: Desk research covers government statistics, regulatory publications, company filings, trade data, technical studies, industry associations, standards, public policy, and other authoritative sources. Every source used in the analysis is documented in the bibliography.
- Market Sizing and Forecasting: Market estimates combine historical performance, demand indicators, pricing and volume trends, segment shares, company participation, country-level growth, adoption patterns, investment activity, and barriers to market expansion.
- Data Validation and Update Cycle: Findings are validated by comparing primary interviews with public data, company activity, regulatory changes, trade patterns, and industry developments. Regular updates review new product launches, capacity changes, partnerships, approvals, procurement trends, and shifts in commercial adoption.
Segmentation
What is the report's scope and coverage?
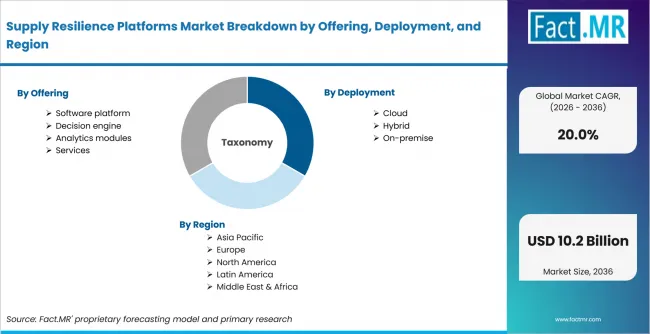
Supply Resilience Platforms Market Breakdown By Offering, Deployment, And Region | Source: Fact.MR
| Attribute | Details |
|---|---|
| Quantitative Units | USD billion |
| Market Definition | Software platforms that help enterprises identify supplier, logistics, regulatory and operational disruption risk, then prioritize mitigation actions across procurement, planning and operations workflows. |
| Offering | Software platform; Decision engine; Analytics modules; Services |
| Deployment | Cloud; Hybrid; On-premise |
| Capability | Forecasting; Optimization; Generative assistance; Orchestration |
| Customer | Large enterprise; Mid-market; Specialist teams; Platforms |
| Pricing | Subscription; Usage based; Enterprise license |
| Regions Covered | North America; Latin America; Western Europe; Eastern Europe; East Asia; South Asia & Pacific; Middle East & Africa |
| Countries Covered | USA; South Korea; Japan; UK; Germany |
| Key Companies Profiled | Everstream Analytics; Interos.ai; Resilinc; Prewave; Altana; Craft.co |
| Forecast Period | 2026 to 2036 |
| Approach | Hybrid top-down and bottom-up approach using platform subscriptions, enterprise supplier-network complexity, disruption exposure, deployment mix, country adoption and provider portfolio review. |
Source: Fact.MR analysis. Updated Aug 25, 2026
How is the market segmented?
-
By Offering:
- Software platform
- Decision engine
- Analytics modules
- Services
-
By Deployment:
- Cloud
- Hybrid
- On-premise
-
By Capability:
- Forecasting
- Optimization
- Generative assistance
- Orchestration
-
By Customer:
- Large enterprise
- Mid-market
- Specialist teams
- Platforms
-
By Pricing:
- Subscription
- Usage based
- Enterprise license
-
By Region:
- North America
- Latin America
- Western Europe
- Eastern Europe
- East Asia
- South Asia & Pacific
- Middle East & Africa
Frequently Asked Questions
How big is the supply resilience platforms market in 2026?
What is the CAGR of the supply resilience platforms market from 2026 to 2036?
Which offering leads the supply resilience platforms market?
Which deployment leads the supply resilience platforms market?
Who are the leading companies in the supply resilience platforms market?
Who worked on this report


Preview the report firsthand - request a free sample
Free SampleGet the brochure for pricing and purchase details
Download PDF