- Market Value (2025): USD 36.5 Bn
- Estimated Value (2026): USD 38.6 Bn
- Forecast Value (2036): USD 67.2 Bn
- CAGR (2026-2036): 5.7%
What is the Synthetic Drugs Market forecast to be worth by 2036?
USD 38.6 billion in 2026 to USD 67.2 billion by 2036, at a 5.7% CAGR.
- The Synthetic Drugs Market reached approximately USD 36.5 billion in 2025.
- Demand is projected to increase from USD 38.6 billion in 2026 to USD 67.2 billion by 2036.
- The market is projected to expand at a 5.7% CAGR from 2026 to 2036.
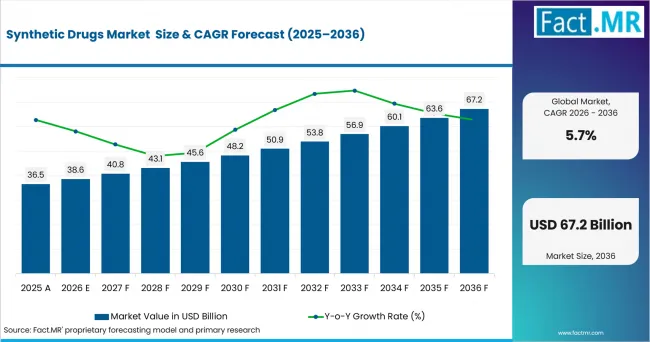
Synthetic Drugs Market Value Analysis | Source: Fact.MR
What are the defining numbers behind Synthetic Drugs Market growth?
An absolute opportunity of USD 28.6 billion is expected between 2026 and 2036.
- Demand Drivers in the Market
- A continuing flow of new pharmaceutical molecules supports demand for synthetic drug manufacturing. The U.S. Food and Drug Administration approved 46 novel drugs in 2025, while the European Medicines Agency recommended 104 medicines for marketing authorisation, including 38 with new active substances. Continued product development creates demand across API synthesis, formulation, analytical testing and commercial manufacturing.
- Generic competition expands treatment access after exclusivity periods end. FDA programs continue to support generic development, while Brazil maintains requirements for pharmaceutical equivalence and bioequivalence before generic medicines can be considered interchangeable with reference products. Larger generic portfolios increase requirements for scalable active pharmaceutical ingredient production and finished-dose manufacturing.
- Manufacturers are also modernizing production systems. FDA identifies continuous drug-substance and drug-product manufacturing, model-based control, 3D printing and advanced oral formulation among emerging manufacturing technologies. These approaches support investment in integrated pharmaceutical manufacturing where process control can improve consistency and reduce production interruptions.
- Supply reliability is becoming more important to pharmaceutical procurement. Manufacturing-quality deficiencies, shortages and concentrated sourcing can interrupt medicine availability, increasing buyer attention to validated production processes, alternate API sources and dependable pharmaceutical supply.
- Demand for oral therapies also supports established synthetic-drug manufacturing infrastructure. Tablets and other oral solid dosage pharmaceutical formats benefit from familiar administration, scalable manufacturing and broad use across chronic and acute therapy.
- Manufacturers requiring flexible synthesis or additional production capacity can use active pharmaceutical ingredient CDMO partners to supplement internal manufacturing, support product launches and establish alternate supply routes.
- Key Segments Analyzed
- Synthetic Pharmaceutical Drugs account for 78.4% of Product in 2026, supported by broad use of small-molecule medicines across chronic and acute therapeutic areas.
- Tablets account for 42.7% of Dosage Form in 2026 because scalable manufacturing, dose accuracy and shelf stability support high-volume pharmaceutical use.
- Oral accounts for 63.7% of Route of Administration in 2026 as self-administration and outpatient use reduce dependence on clinical administration infrastructure.
- Prescription Drugs account for 71.5% of Drug Classification in 2026 because many synthetic therapies require diagnosis, physician supervision, titration or continued patient monitoring.
- Chemical Synthesis accounts for 82.3% of Manufacturing Method in 2026 because small-molecule APIs commonly rely on controlled reaction, purification, crystallization and finishing processes.
- Analyst Opinion at Fact.MR
- Shambhu Nath Jha, Principal Consultant, Fact.MR, states, “Synthetic drug demand continues to be shaped by the interaction between product development, generic competition and manufacturing reliability. Companies need to combine synthesis economics with formulation capability, regulatory execution and resilient supply to support changing pharmaceutical requirements through 2036.”
- Strategic Implications
- Originator companies should evaluate route selection, solid-state control and manufacturability early in development because late process redesign can delay scale-up and commercial production.
- Generic manufacturers need portfolio discipline. High-volume oral solids reward manufacturing efficiency, while complex formulations and difficult APIs can justify greater technical investment.
- Procurement teams should evaluate API provenance, alternate suppliers, change-control procedures and inspection history alongside unit price.
- Manufacturers considering continuous production should prioritize products where integrated process control and demand variability create a practical operating advantage over conventional batch production.
- Suppliers should strengthen alternate sourcing and production-transfer capabilities because medicine shortages can increase buyer demand for qualified secondary manufacturing routes
How does the Synthetic Drugs Market break down by segment?
The market is segmented by Product, Dosage Form, Route of Administration, Drug Classification, Manufacturing Method and Region.
Why do Synthetic Pharmaceutical Drugs lead Product?
Synthetic Pharmaceutical Drugs are projected to account for a 78.4% share in 2026.
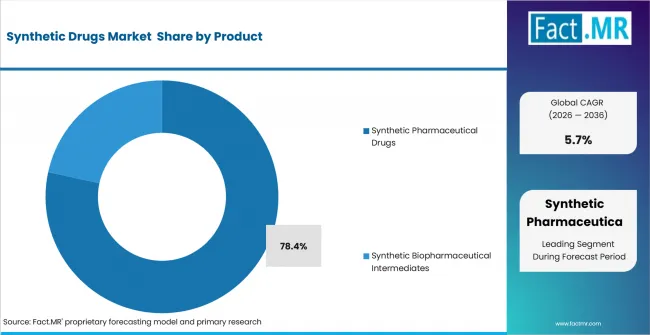
Synthetic Drugs Market Analysis By Product | Source: Fact.MR
Synthetic pharmaceutical drugs serve a broad range of therapeutic applications including cardiovascular disease, central nervous system disorders, infectious diseases, oncology, respiratory conditions, gastrointestinal disorders, endocrine conditions and pain management.
Their commercial base is reinforced by both new product introductions and generic competition. A molecule can continue generating prescription volume after patent expiry as multiple generic manufacturers enter the market.
This breadth supports recurring requirements for API synthesis, formulation development, analytical testing and commercial manufacturing.
Why do Tablets lead Dosage Form?
Tablets are projected to account for a 42.7% share in 2026.
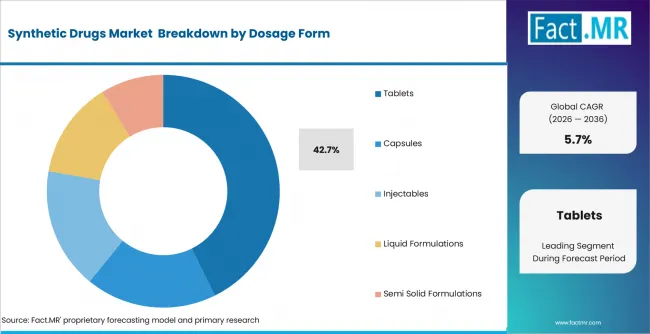
Synthetic Drugs Market Analysis By Dosage Form | Source: Fact.MR
Tablets combine manufacturing scale, dose accuracy, shelf stability and familiar patient use. Compression and coating processes are well established, making tablets suitable for high-volume medicines where predictable formulations justify dedicated manufacturing capacity.
Manufacturing technology is also evolving. FDA has incorporated continuous direct compression into established pharmaceutical quality assessment pathways for suitable products, supporting integrated tablet-production lines.
For manufacturers, the format offers a practical balance between production efficiency, packaging compatibility and patient convenience.
Why does Oral lead Route of Administration?
Oral is projected to account for a 63.7% share in 2026.
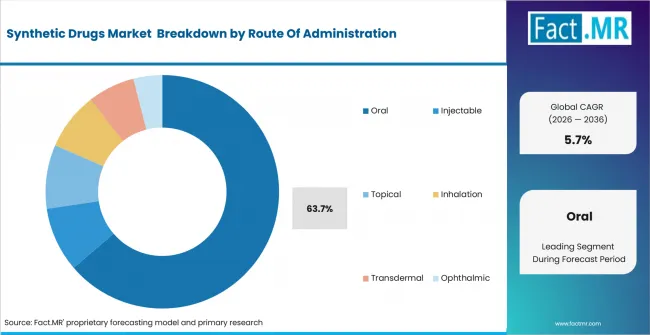
Synthetic Drugs Market Analysis By Route Of Administration | Source: Fact.MR
Oral administration is widely used across chronic and acute therapies because medicines can generally be taken without trained clinical personnel or administration equipment.
The route also supports repeat outpatient treatment, making it suitable for long-duration therapies where administration convenience influences adherence.
Formulation development continues to extend oral delivery through modified-release and other differentiated formats.
Why do Prescription Drugs lead Drug Classification?
Prescription Drugs are projected to account for a 71.5% share in 2026.
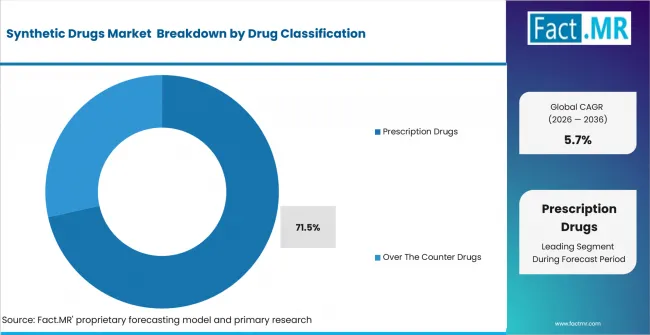
Synthetic Drugs Market Analysis By Drug Classification | Source: Fact.MR
Many synthetic medicines require diagnosis, physician supervision, dose adjustment or patient monitoring. These requirements keep substantial therapeutic categories within prescription channels.
Novel therapies introduced across oncology, neurology, cardiology, infectious disease and other areas also commonly enter the market as prescription products.
Generic entry can reduce prices and increase treatment volume without removing prescription requirements.
Why does Chemical Synthesis lead Manufacturing Method?
Chemical Synthesis is projected to account for an 82.3% share in 2026.
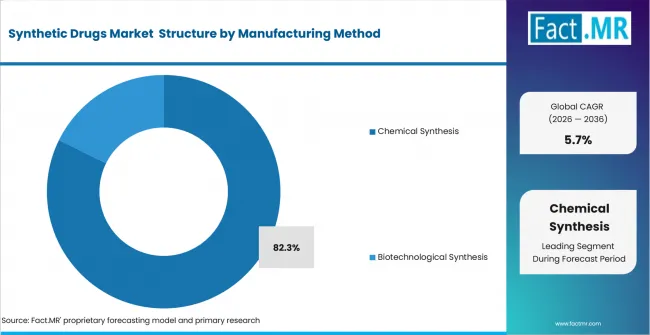
Synthetic Drugs Market Analysis By Manufacturing Method | Source: Fact.MR
Chemical synthesis remains central to small-molecule API production because active ingredients are commonly manufactured through controlled reaction, separation, purification, crystallization and finishing stages.
Manufacturing development increasingly focuses on improving control over these processes. Continuous manufacturing and model-based controls can integrate multiple production steps and improve consistency.
FDA Q13 provides a lifecycle framework for continuous manufacture of drug substances and finished drug products, giving manufacturers a regulatory pathway for modernizing chemical production.
What is accelerating Synthetic Drugs Market adoption, and what is holding it back?
Demand is being supported by continued pharmaceutical development, generic expansion, broad oral-drug use and investment in modern manufacturing technologies. Growth can be constrained by price erosion, manufacturing-quality failures, supply concentration and the regulatory investment required to maintain compliant production.
Drivers Impact Analysis
| Factor | (~) % Impact on CAGR | Geographic Relevance | Impact Timeline |
|---|---|---|---|
| Continued new drug development and commercial launches | +1.3% | Global | Short term (≤ 2 years) |
| Expansion of generic medicine availability | +1.1% | Global | Short term (≤ 2 years) |
| Modernization of pharmaceutical manufacturing | +0.8% | USA, Europe and Japan | Medium term (2–4 years) |
| Demand for resilient API and finished-dose supply | +0.6% | Global | Medium term (2–4 years) |
Source: Fact.MR analysis. Updated Sep 4, 2026
Opportunity Impact Analysis
| Factor | (~) % Impact on CAGR | Geographic Relevance | Impact Timeline |
|---|---|---|---|
| Complex generic and differentiated formulation development | +0.9% | USA, Europe, Brazil and Japan | Medium term (2–4 years) |
| Continuous manufacturing adoption | +0.7% | USA, Europe and Japan | Long term (≥ 4 years) |
| Alternate API sourcing and regional manufacturing capacity | +0.6% | Global | Medium term (2–4 years) |
| Controlled-release and advanced oral formulations | +0.4% | Global | Long term (≥ 4 years) |
Source: Fact.MR analysis. Updated Sep 4, 2026
Restraints Impact Analysis
| Factor | (~) % Impact on CAGR | Geographic Relevance | Impact Timeline |
|---|---|---|---|
| Generic price erosion | -1.0% | Global | Short term (≤ 2 years) |
| Manufacturing-quality and compliance requirements | -0.8% | Global | Short term (≤ 2 years) |
| API and intermediate supply concentration | -0.6% | Global | Medium term (2–4 years) |
| Cost of product and process revalidation | -0.4% | USA, Europe and Japan | Medium term (2–4 years) |
Source: Fact.MR analysis. Updated Sep 4, 2026
Which countries are scaling the Synthetic Drugs Market through 2036?
- Germany: Pharmaceutical authorization activity, established manufacturing capability and attention to medicine shortages support demand for reliable synthetic drug production and alternate supply routes.
- Brazil: Generic medicine regulation and equivalence requirements support a broad synthetic-drug base, while domestic pharmaceutical demand creates opportunities for API and finished-dose production.
- USA: Continued novel-drug approvals, a substantial generic market and adoption of advanced pharmaceutical manufacturing technologies support both new-product and lifecycle demand.
- UK: Ongoing medicinal-product authorization activity and established generic channels support continued product turnover, manufacturing and procurement requirements.
- Japan: New medicine approvals and close GMP oversight support demand for manufacturers able to maintain controlled processes, documentation and localized regulatory compliance.
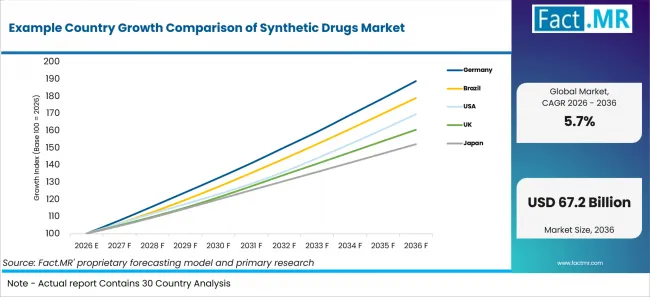
Example Country Growth Comparison Of Synthetic Drugs Market | Source: Fact.MR
| Country | CAGR |
|---|---|
| Germany | 6.6% |
| Brazil | 6.0% |
| USA | 5.4% |
| UK | 4.9% |
| Japan | 4.3% |
Source: Fact.MR analysis. Updated Sep 4, 2026
What is driving Germany’s growth through 2036?
Germany is forecast to expand at a 6.6% CAGR from 2026 to 2036.
Germany combines pharmaceutical manufacturing capabilities with an established medicinal-product authorization system. BfArM statistics indicate continued authorization activity, supporting recurring requirements for product development, manufacturing and lifecycle management.
Medicine availability has also become an important policy consideration. Manufacturers serving Germany therefore need to balance production cost with consistent quality, supply continuity and the ability to respond to shortages.
These requirements support investment in dependable API sourcing, compliant production and flexible manufacturing capacity.
What is driving Brazil’s growth through 2036?
Brazil is forecast to expand at a 6.0% CAGR from 2026 to 2036.
Brazil maintains a formal regulatory pathway for synthetic and semisynthetic medicines together with an established generic-drug framework.
ANVISA requires generic medicines to demonstrate pharmaceutical equivalence and bioequivalence to relevant reference products before interchangeability. This framework supports competition while maintaining defined quality requirements.
Manufacturers able to combine compliant formulation, local registration support and efficient production can participate in both branded and generic synthetic-drug demand.
What is driving USA’s growth through 2036?
The USA is forecast to expand at a 5.4% CAGR from 2026 to 2036.
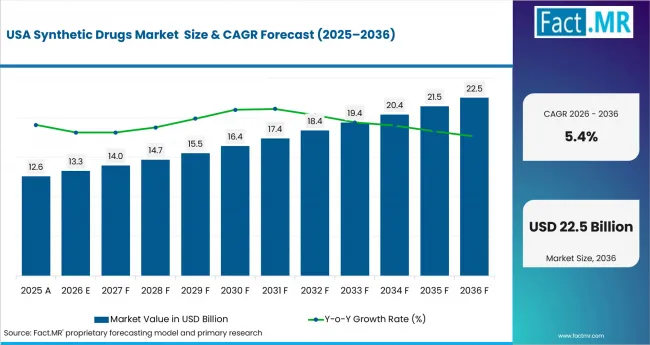
Synthetic Drugs Market Country Value Analysis | Source: Fact.MR
The U.S. market combines continued novel-drug development with substantial generic demand. FDA approved 46 novel drugs in 2025, sustaining new formulation and manufacturing requirements across therapeutic areas.
Manufacturing modernization provides an additional growth mechanism. FDA programs cover continuous manufacturing, model-based control, 3D printing and other emerging technologies.
This creates demand for suppliers able to support both new molecules and established products through efficient, validated manufacturing systems.
What is driving the UK’s growth through 2036?
The UK is forecast to expand at a 4.9% CAGR from 2026 to 2036.
The UK market benefits from continued medicinal-product authorization and a substantial generic medicine base.
MHRA reported 54 new medicinal substances and 805 generic medicinal products assessed and approved during its 2024 to 2025 reporting year. Continued product turnover creates requirements for formulation, scale-up, manufacturing and regulatory maintenance.
Competition places pressure on production economics, making manufacturing efficiency and dependable supply important purchasing factors.
What is driving Japan’s growth through 2036?
Japan is forecast to expand at a 4.3% CAGR from 2026 to 2036.
Japan combines continuing medicine approvals with detailed manufacturing-quality oversight.
PMDA publishes information on new drug approvals and quality-assurance activities, reinforcing requirements for controlled manufacturing, inspection readiness and reliable documentation.
Suppliers operating in Japan therefore need strong quality systems alongside the ability to support local regulatory requirements and consistent product supply.
Who Leads the Synthetic Drugs Market?
Key players in the Synthetic Drugs Market include Pfizer Inc., F. Hoffmann-La Roche Ltd, Novartis AG, Merck & Co., Inc., Sanofi SA, GSK plc and Teva Pharmaceutical Industries Ltd.
Competition is shaped by pharmaceutical portfolio breadth, manufacturing capacity, API sourcing, formulation expertise, regulatory execution and geographic reach.
Originator pharmaceutical companies compete through new product pipelines and lifecycle management, while generic manufacturers emphasize manufacturing economics, product breadth and the ability to enter markets after exclusivity periods end.
Manufacturing reliability is important because quality failures or shortages can interrupt supply even where production capacity is available. Companies with qualified manufacturing networks and alternate sourcing options can reduce this risk.
Complex formulations, difficult APIs and advanced manufacturing methods can provide additional differentiation because these capabilities require greater technical investment than conventional oral-solid production.
Which companies are the key providers?
Key players in the Synthetic Drugs Market include Pfizer Inc., F. Hoffmann-La Roche Ltd, Novartis AG, Merck & Co., Inc., Sanofi SA, GSK plc and Teva Pharmaceutical Industries Ltd.
- Pfizer Inc.
- F. Hoffmann-La Roche Ltd
- Novartis AG
- Merck & Co., Inc.
- Sanofi SA
- GSK plc
- Teva Pharmaceutical Industries Ltd.
Bibliography
- U.S. Food and Drug Administration. (2026). FDA Novel Drug Approvals for 2025. U.S. Department of Health and Human Services.
- U.S. Food and Drug Administration. (2026). Advancing Product Quality. U.S. Department of Health and Human Services.
- U.S. Food and Drug Administration. (2026). Examples of Accepted Emerging Technologies. U.S. Department of Health and Human Services.
- U.S. Food and Drug Administration. (2023). Q13 Continuous Manufacturing of Drug Substances and Drug Products. U.S. Department of Health and Human Services.
- U.S. Food and Drug Administration. (2026). FDA Science, Research, and Collaboration Advance Generic Medicines. U.S. Department of Health and Human Services.
- European Medicines Agency. (2026). EMA Annual Report 2025: Human Medicines. European Medicines Agency.
- Federal Institute for Drugs and Medical Devices. (2026). BfArM Medicinal Product Statistics 2025. Federal Government of Germany.
- ANVISA. (2025). Medicamentos Genéricos. Government of Brazil.
- ANVISA. (2025). Registro de Genéricos. Government of Brazil.
- ANVISA. (2026). Registro de Medicamentos Novos e Inovadores. Government of Brazil.
- Medicines and Healthcare products Regulatory Agency. (2026). MHRA Annual Report and Accounts 2025 to 2026. Government of the United Kingdom.
- Medicines and Healthcare products Regulatory Agency. (2026). Marketing Authorisations Granted in 2025. Government of the United Kingdom.
- Pharmaceuticals and Medical Devices Agency. (2026). 2025 New Drug Approvals. Government of Japan.
- Pharmaceuticals and Medical Devices Agency. (2026). Quality Assurance Activities. Government of Japan.
This Report Answers
- What is the Synthetic Drugs Market value in 2026 and what value is forecast for 2036?
- Why do Synthetic Pharmaceutical Drugs lead Product?
- Why do Tablets lead Dosage Form?
- Why does Oral lead Route of Administration?
- Why do Prescription Drugs lead Drug Classification?
- Why does Chemical Synthesis lead Manufacturing Method?
- How are new drug development and generic competition influencing synthetic-drug demand?
- How are pharmaceutical manufacturing technologies changing production requirements?
- Why does growth differ across Germany, Brazil, USA, UK and Japan?
- Which companies participate in the Synthetic Drugs Market?
- What factors could restrain market expansion through 2036?
What does the Synthetic Drugs Market cover?
The Synthetic Drugs Market covers commercial revenue generated from synthetic pharmaceutical drugs and related synthetic pharmaceutical products included within the defined Product, Dosage Form, Route of Administration, Drug Classification and Manufacturing Method categories.
Revenue includes regulated prescription and over-the-counter therapeutic products produced through chemical or other defined synthetic manufacturing processes.
The market covers commercial pharmaceutical activity rather than standalone research chemicals or non-therapeutic chemical compounds.
What is included in the scope?
Product includes Synthetic Pharmaceutical Drugs and Synthetic Biopharmaceutical Intermediates.
Dosage Form includes Tablets and other finished-dose forms within the market.
Route of Administration includes Oral and other administration routes within the market.
Drug Classification includes Prescription Drugs and other therapeutic classifications within the market.
Manufacturing Method includes Chemical Synthesis and other manufacturing approaches within the market.
The scope includes commercial synthetic medicines supplied through regulated pharmaceutical markets across the covered regions and countries.
What is excluded from the scope?
The scope excludes non-pharmaceutical synthetic chemicals that are not intended for therapeutic use.
Research chemicals that have not entered commercial pharmaceutical use are excluded from market revenue.
Standalone pharmaceutical manufacturing equipment, packaging equipment and laboratory instruments are outside the market unless their value forms part of the synthetic pharmaceutical product transaction.
Biological therapies produced principally through living-cell systems are outside the synthetic-drug scope unless included within the defined synthetic pharmaceutical categories.
How Was the Analysis Built?
The analysis combines pharmaceutical demand, manufacturing and regulatory evidence across the defined segment and country structure.
- Primary Research: Interviews with pharmaceutical manufacturers, API producers, formulation specialists, procurement teams, regulatory professionals and distribution participants examine product demand, pricing, manufacturing economics, generic competition, sourcing and supply reliability.
- Desk Research: The review covers pharmaceutical regulators, medicine authorization data, manufacturing-quality guidance, generic-drug frameworks and current pharmaceutical company information relevant to synthetic medicines.
- Market Sizing and Forecasting: Estimates consider pharmaceutical demand, product mix, dosage-form mix, route of administration, prescription and non-prescription demand, manufacturing method, pricing and country-level market conditions.
- Data Validation and Update Cycle: Findings are cross-checked against regulatory developments, medicine approvals, manufacturing activity, supply conditions and current company activity. Updates assess changes in product demand, manufacturing practices and regulatory requirements.
Segmentation
What is the report's scope and coverage?
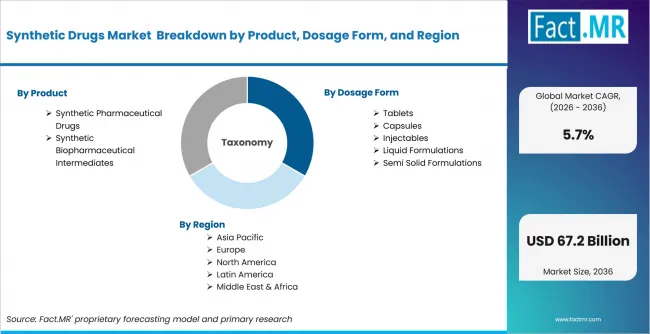
Synthetic Drugs Market Breakdown By Product, Dosage Form, And Region | Source: Fact.MR
| Attribute | Details |
|---|---|
| Quantitative Units | USD billion |
| Market Definition | Synthetic pharmaceutical drugs and related synthetic therapeutic products across the defined product, dosage-form, administration, drug-classification and manufacturing categories |
| Segments Covered | Product; Dosage Form; Route of Administration; Drug Classification; Manufacturing Method; Region |
| Regions Covered | North America; Latin America; Europe; East Asia; South Asia and Pacific; Middle East and Africa |
| Countries Covered | Germany; Brazil; USA; UK; Japan |
| Key Companies | Pfizer Inc.; F. Hoffmann-La Roche Ltd; Novartis AG; Merck & Co., Inc.; Sanofi SA; GSK plc; Teva Pharmaceutical Industries Ltd |
| Forecast Period | 2026 to 2036 |
| Base Year | 2025 |
| Market Value, 2026 | USD 38.6 billion |
| Market Value, 2036 | USD 67.2 billion |
| CAGR, 2026-2036 | 5.7% |
| Absolute Opportunity | USD 28.6 billion |
| Approach | Hybrid top-down and bottom-up assessment using pharmaceutical demand, product mix, dosage-form mix, administration route, drug classification, manufacturing method, pricing and country-level market conditions |
Source: Fact.MR analysis. Updated Sep 4, 2026
How is the market segmented?
-
By Product
- Synthetic Pharmaceutical Drugs
- Synthetic Biopharmaceutical Intermediates
-
By Dosage Form
- Tablets
- Capsules
- Injectables
- Oral Liquids
- Topical and Transdermal Forms
- Other Dosage Forms
-
By Route of Administration
- Oral
- Parenteral
- Topical
- Inhalation
- Other Routes of Administration
-
By Drug Classification
- Prescription Drugs
- Over-the-Counter Drugs
-
By Manufacturing Method
- Chemical Synthesis
- Semi-Synthetic Manufacturing
- Other Manufacturing Methods
-
By Region
- North America
- Latin America
- Europe
- East Asia
- South Asia and Pacific
- Middle East and Africa
Frequently Asked Questions
What is the Synthetic Drugs Market value in 2026?
At what CAGR is the market projected to grow?
What is the projected market value by 2036?
Which Product leads the market?
Which Dosage Form leads the market?
Which Route of Administration leads the market?
Which Drug Classification leads the market?
Which Manufacturing Method leads the market?
Which country records the highest listed CAGR?
What is the primary driver in this market?
What is the main restraint?
Which companies are included in the market?
Who worked on this report


Preview the report firsthand - request a free sample
Free SampleGet the brochure for pricing and purchase details
Download PDF