U.S. Lithium-ion Battery Packs Market
U.S. Lithium-ion Battery Packs Market Analysis, By Product Type (Lithium Cobalt Oxide, Lithium Magnesium Oxide, and Others), By Cell Type, By Nominal Voltage, By Battery Capacity, By End-Use and Region - Market Insights 2025 to 2035
The Lithium Magnesium Oxide segment is projected to grow at a CAGR of 12.7%, whereas another segment Lithium Iron Phosphate is likely to grow at 13%. In terms of regions Western U.S. is projected to grow at 11.6%, followed by Midwest U.S. at 13.3% and Southeast U.S. to grow at 13.5%.
U.S. Lithium-ion Battery Packs Market Outlook (2025 to 2035)
The U.S. Lithium-ion Battery Packs market is expected to reach USD 144.2 billion by 2035, up from USD 40.7 billion in 2024. During the forecast period (2025 to 2035), the industry is projected to expand at a CAGR of 12.4%, driven by immense and swiftly growing electric vehicle demand, the adoption of clean energy, technological innovation that enhances the efficiency, lifecycle, and price of batteries, and facilitated by clean energy-friendly policies.
Metric | Value |
---|---|
Industry Size (2025E) | USD 44.8 Billion |
Industry Size (2035F) | USD 144.2 Billion |
CAGR (2025 to 2035) | 12.4% |
What are the drivers of the U.S. Lithium-ion Battery Packs market?
The U.S. lithium-ion battery pack market is experiencing unprecedented growth, driven by the surging adoption of electric vehicles (EVs), advancements in renewable energy storage technologies, and widespread applications in consumer electronics. The automotive sector remains a primary driver, with increasing demand for EVs necessitating efficient and high-capacity battery packs.
Concurrently, the integration of renewable energy sources, such as solar and wind, into the power grid has heightened the need for reliable energy storage systems, where lithium-ion batteries play a crucial role.
Technological advancements have led to improvements in battery energy density, charging speed, and lifecycle, enhancing their appeal across various applications. Innovations in battery chemistries, such as lithium iron phosphate (LFP) and nickel-manganese-cobalt (NMC), offer tailored solutions for specific needs, balancing performance, cost, and safety.
Additionally, government initiatives and policies aimed at reducing carbon emissions have provided incentives for the adoption of clean energy technologies, thereby further stimulating market growth.
The consumer electronics segment also contributes to market expansion, with the increasing use of smartphones, laptops, and wearable devices requiring compact and efficient battery solutions. Overall, the convergence of environmental concerns, technological progress, and supportive policies is driving the strong growth of the U.S. Li-ion battery packs market.
What are the challenges and restraining factors of the U.S. Lithium-ion Battery Packs market?
Despite the promising growth trajectory, the U.S. lithium-ion battery packs market faces several challenges that could impede its progress. A primary concern is the volatility in raw material prices, particularly for lithium, cobalt, and nickel, which are essential components of battery cells. Fluctuations in these commodity markets can lead to increased production costs and supply chain uncertainties.
Supply chain dependencies, especially on foreign sources for critical minerals, pose strategic risks. The concentration of processing and manufacturing capabilities in countries like China exposes the U.S. market to geopolitical tensions and trade disruptions, which could potentially affect the availability and cost of battery components.
Environmental and safety concerns also present challenges. The extraction and processing of battery materials have ecological impacts, and improper disposal of batteries can lead to environmental hazards. Moreover, issues related to battery safety, such as thermal runaway and fire risks, necessitate stringent quality control and safety standards, which may increase compliance costs.
Policy uncertainties, including changes in government incentives and regulatory frameworks, can affect investment decisions and market stability. For instance, shifts in subsidies for EVs or renewable energy projects may influence demand for battery packs.
Addressing these challenges requires strategic investments in domestic supply chains, recycling infrastructure, technological innovation, and consistent policy support to ensure sustainable and resilient market growth.
Region-Wise Insights
Region | CAGR (2025 to 2035) |
---|---|
West U.S. | 11.6% |
Midwest U.S. | 13.3% |
Southeast U.S. | 13.5% |
Policy Push and Eco Culture Advance Western Growth
The West U.S. market is gaining significant momentum due to aggressive clean energy policies, widespread EV adoption, and a culturally ingrained sustainability ethos. States like California and Oregon are leading the way with mandates for zero-emission vehicles and ambitious storage targets, thereby spurring demand for lithium-ion battery packs across various sectors.
Residential adoption is climbing as solar-plus-storage systems become common for mitigating grid instability, especially in wildfire-prone areas. Consumers prioritize energy independence and environmental impact, aligning well with battery-based solutions. Urban tech hubs are driving innovation in battery monitoring and integration, enabling smarter energy use and more efficient storage systems. Regulatory support and carbon reduction goals are motivating utilities to scale battery-backed infrastructure.
With a mix of policy support, consumer awareness, and environmental urgency, the Western U.S. is poised to become a stronghold for energy storage evolution, making a substantial contribution to the national transition toward decarbonized power systems.
Industrial Backbone Spurs Midwest Momentum
The Midwest U.S. is emerging as a key industrial zone for lithium-ion battery pack growth, supported by federal clean energy initiatives and strong manufacturing infrastructure. The region’s deep-rooted expertise in large-scale production is being redirected toward battery component assembly, creating a reliable foundation for expanding the supply chain.
State-level incentives and economic revitalization programs are encouraging investment in battery-related facilities, while regional transportation networks ease distribution. Demand is rising from commercial users adopting storage systems to improve power reliability and reduce energy costs during peak loads. Consumers in the region are showing increased interest in EVs and energy-efficient technologies, supported by awareness campaigns and shifting fuel cost dynamics.
Utilities are integrating battery packs into grid modernization plans, particularly in areas with aging infrastructure. The convergence of industrial capabilities, supportive policies, and emerging consumer demand makes the Midwest a strategic hub for the sustained development of the Li-ion battery market.
Resilience Needs Propel Southeast Adoption
The Southeast U.S. lithium-ion battery pack market is expanding steadily, driven by concerns over energy reliability, favorable policy measures, and the need for climate resilience. States across the region are incentivizing grid-connected battery storage to manage outages caused by storms and hurricanes, while also supporting rural electrification programs.
Battery storage is gaining popularity among residential users seeking backup power and lower energy bills, especially when paired with rooftop solar. The cultural emphasis on self-sufficiency and cost-effective solutions aligns well with the growing interest in energy storage.
Utilities are modernizing grid systems by integrating distributed battery storage, particularly in suburban and coastal zones prone to disruptions. Economic development authorities are offering workforce training and land-use benefits to attract battery-related ventures.
As the region balances growing energy demand with climate vulnerabilities, the adoption of lithium-ion batteries is becoming central to both resilience planning and long-term sustainable energy goals in the Southeast.
Category-Wise Analysis
Lithium Iron Phosphate Enhances Mid-Range PHEV Battery Stability
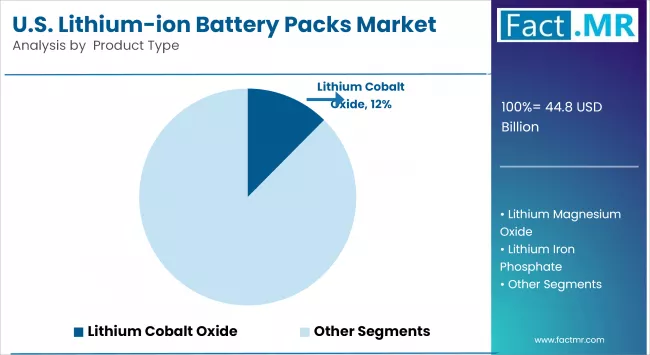
Lithium Iron Phosphate (LFP) is gaining momentum in the U.S. plug-in hybrid electric vehicle (PHEV) market, particularly in battery packs configured around 24V systems and 60–80 kWh capacities. Known for its thermal stability, safety, and long cycle life, LFP is an increasingly favored chemistry for mid-range energy storage where safety and longevity take precedence over absolute energy density. This makes it ideal for PHEVs that undergo frequent charge-discharge cycles and operate across diverse driving conditions.
The adoption of pouch cell architecture enables flexible and compact battery design, aligning with automakers’ efforts to optimize space in hybrid drivetrains. In addition, the absence of cobalt and nickel in LFP aligns with environmental, social, and governance (ESG) goals, as supply chain ethics and sustainability come under regulatory and consumer scrutiny in the U.S.
With domestic battery production incentives under the Inflation Reduction Act (IRA) and growing consumer interest in cost-effective electrification options, LFP is positioned as a stable, sustainable, and scalable solution for next-generation PHEVs.
Cylindrical Cells Bolster Manufacturing Scalability and Safety in EV Packs
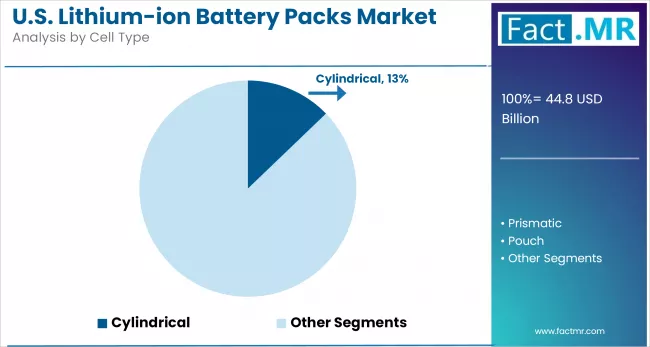
Cylindrical lithium-ion cells are experiencing strong demand across the U.S. battery pack landscape due to their mechanical structure, excellent thermal performance, and ease of manufacturing at scale. Originally popularized in consumer electronics and early EVs like the Tesla Model S, cylindrical formats (e.g., 18650, 21700, 4680) are now being deployed in diverse electric vehicle platforms as manufacturers prioritize standardization, modularity, and cost-efficiency.
The uniform shape of cylindrical cells facilitates automated assembly, ensuring high throughput and consistent quality, which is crucial for gigafactory-scale operations in the U.S. Moreover, their superior heat dissipation properties reduce the risk of thermal runaway, which is especially important for dense battery modules in automotive applications.
Cylindrical cells are also compatible with various chemistries, including LFP and NMC, making them versatile for different performance and cost targets. As next-generation formats, such as 4680 cells, move toward commercial maturity, the cylindrical segment is poised to drive innovation in energy density, fast charging, and lifecycle economics, thereby reinforcing its place in the U.S. EV battery ecosystem.
Consumer Electronics Propel Demand for Compact High-Cycle Battery Packs
The U.S. consumer electronics industry is driving demand for lithium-ion battery packs, particularly in smartphones, wearables, wireless audio devices, and tablets. This sector requires lightweight, compact, and high-cycle batteries that can support frequent charge-discharge patterns while maintaining long-term reliability.
Manufacturers are increasingly adopting chemistries like Lithium Cobalt Oxide (LCO) and Lithium Nickel Cobalt Aluminium Oxide (NCA) to achieve high energy density in constrained spaces. At the same time, pouch cell formats are preferred for their design flexibility and high volumetric efficiency.
With consumer behavior shifting toward always-connected, high-performance devices, battery longevity, fast charging, and thermal safety are becoming core innovation targets. Moreover, the growing interest in foldable devices, AR/VR headsets, and IoT-integrated wearables is expanding the parameters of battery design.
Sustainability initiatives are also emerging, with companies piloting recyclable cell structures and solid-state prototypes to reduce e-waste. As a result, battery packs tailored to consumer electronics are positioned for steady growth across both premium and mass-market device categories.
Competitive Analysis
Key players in the U.S. lithium-ion battery packs industry include Tesla, Inc., General Motors Company, Panasonic Energy Corporation, LG Energy Solution Michigan, Inc., Samsung SDI America, Inc., Microvast Holdings, Inc., EnerSys, A123 Systems LLC, Sila Nanotechnologies Inc., and Group14 Technologies, Inc.
The market is expanding rapidly due to rising demand for EVs, energy storage systems, and industrial power solutions. Federal incentives and clean energy mandates are promoting local production and the development of advanced batteries.
Technological advancements, including silicon anodes, fast-charging capabilities, and improvements in thermal management, are driving innovation. Companies are focusing on sustainable practices, including battery recycling, reduced cobalt dependence, and energy-efficient manufacturing. These strategies enhance competitiveness and align with national decarbonization goals, thereby securing long-term market relevance.
Recent Development
- In May 2025, General Motors unveiled lithium manganese-rich (LMR) prismatic battery cells, aiming to deliver over 400 miles of range at reduced costs. These cobalt-light batteries offer 33% higher energy density than lithium-iron-phosphate cells and are slated for U.S. production by 2028, enhancing EV affordability and performance.
- In October 2024, Fortescue Zero inaugurated a battery pack manufacturing facility in Detroit, marking a milestone for scalable clean energy solutions. The plant will produce battery modules using Fortescue’s proprietary SBM (scalable battery module) technology, enabling rapid production of customized systems for various applications, including e-mobility and stationary storage.
Fact.MR has provided detailed information about the price points of key manufacturers in the U.S. Lithium-ion Battery Packs Market, including their regional positioning, sales growth, production capacity, and speculative technological expansion, as recently published in the report.
Methodology and Industry Tracking Approach
Fact.MR’s 2025 report on the U.S. Lithium-ion Battery Packs Market draws insights from 9,200 participants across 27 countries, with each market comprising at least 300 responses. Of these, 64% were primary stakeholders, including EV manufacturers, battery pack producers, and energy storage system integrators, while the remaining 36% comprised sector professionals such as R&D experts, policy consultants, and sourcing leads.
Fieldwork was conducted from June 2024 to May 2025, focusing on investment drivers, technology shifts, regulatory hurdles, and latent demand. Data was statistically weighted to reflect accurate regional market dynamics.
The analysis integrated over 280 reputable sources, including patents, technical papers, compliance documents, and investor filings. Advanced analytics such as regression modeling and time-series forecasting ensured precision. With ongoing market surveillance since 2018, this study serves as a trusted reference for decision-makers across the lithium-ion battery value chain.
Segmentation of U.S. Lithium-ion Battery Packs Market
-
By Product Type :
- Lithium Cobalt Oxide
- Lithium Magnesium Oxide
- Lithium Iron Phosphate
- Lithium Nickel Manganese Cobalt Oxide
- Lithium Nickel Cobalt Aluminium Oxide
- Lithium Titanate
-
By Cell Type :
- Cylindrical
- Prismatic
- Pouch
-
By Nominal Voltage :
- Less than 12V
- 12V
- 24V
- More than 24V
-
By Battery Capacity :
- Less than 30 kWh
- 30-60 kWh
- 60-80 kWh
- More than 80 kWh
-
By End-Use :
- Automotive
- BEV
- PHEV
- HEV
- Consumer Electronics
- Laptops
- Digital Camera
- AIDC
- Others
- Medical Devices
- Industrial & Grid Energy
- Automotive
-
By Region :
- West U.S.
- Southwest U.S.
- Midwest U.S.
- Northeast U.S.
- Southeast U.S.
Table of Content
- Executive Summary
- U.S. Market Outlook
- Demand-side Trends
- Supply-side Trends
- Technology Roadmap Analysis
- Analysis and Recommendations
- Market Overview
- Market Coverage / Taxonomy
- Market Definition / Scope / Limitations
- Market Background
- Market Dynamics
- Drivers
- Restraints
- Opportunity
- Trends
- Scenario Forecast
- Demand in Optimistic Scenario
- Demand in Likely Scenario
- Demand in Conservative Scenario
- Opportunity Map Analysis
- Product Life Cycle Analysis
- Supply Chain Analysis
- Supply Side Participants and their Roles
- Producers
- Mid-Level Participants (Traders/ Agents/ Brokers)
- Wholesalers and Distributors
- Value Added and Value Created at Node in the Supply Chain
- List of Component Suppliers
- List of Existing and Potential Buyers
- Supply Side Participants and their Roles
- Investment Feasibility Matrix
- Value Chain Analysis
- Profit Margin Analysis
- Wholesalers and Distributors
- PESTLE and Porter’s Analysis
- Regulatory Landscape
- By Key Regions
- By Key Countries
- Production and Consumption Statistics
- Import and Export Statistics
- Market Dynamics
- U.S. Market Analysis 2020 to 2024 and Forecast, 2025 to 2035
- Historical Market Size Value (USD Bn) & Volume (Units) Analysis, 2020 to 2024
- Current and Future Market Size Value (USD Bn) & Volume (Units) Projections, 2025 to 2035
- Y-o-Y Growth Trend Analysis
- Absolute $ Opportunity Analysis
- U.S. Market Pricing Analysis 2020 to 2024 and Forecast 2025 to 2035
- U.S. Market Analysis 2020 to 2024 and Forecast 2025 to 2035, By Product Type
- Introduction / Key Findings
- Historical Market Size Value (USD Bn) & Volume (Units) Analysis By Product Type, 2020 to 2024
- Current and Future Market Size Value (USD Bn) & Volume (Units) Analysis and Forecast By Product Type, 2025 to 2035
- Lithium Cobalt Oxide
- Lithium Magnesium Oxide
- Lithium Iron Phosphate
- Lithium Nickel Manganese Cobalt Oxide
- Lithium Nickel Cobalt Aluminium Oxide
- Lithium Titanate
- Y-o-Y Growth Trend Analysis By Product Type, 2020 to 2024
- Absolute $ Opportunity Analysis By Product Type, 2025 to 2035
- U.S. Market Analysis 2020 to 2024 and Forecast 2025 to 2035, By Cell Type
- Introduction / Key Findings
- Historical Market Size Value (USD Bn) & Volume (Units) Analysis By Cell Type, 2020 to 2024
- Current and Future Market Size Value (USD Bn) & Volume (Units) Analysis and Forecast By Cell Type, 2025 to 2035
- Cylindrical
- Prismatic
- Pouch
- Y-o-Y Growth Trend Analysis By Cell Type, 2020 to 2024
- Absolute $ Opportunity Analysis By Cell Type, 2025 to 2035
- U.S. Market Analysis 2020 to 2024 and Forecast 2025 to 2035, By Nominal Voltage
- Introduction / Key Findings
- Historical Market Size Value (USD Bn) & Volume (Units) Analysis By Nominal Voltage, 2020 to 2024
- Current and Future Market Size Value (USD Bn) & Volume (Units) Analysis and Forecast By Nominal Voltage, 2025 to 2035
- Less than 12V
- 12V
- 24V
- More than 24V
- Y-o-Y Growth Trend Analysis By Nominal Voltage, 2020 to 2024
- Absolute $ Opportunity Analysis By Nominal Voltage, 2025 to 2035
- U.S. Market Analysis 2020 to 2024 and Forecast 2025 to 2035, By Battery Capacity
- Introduction / Key Findings
- Historical Market Size Value (USD Bn) & Volume (Units) Analysis By Battery Capacity, 2020 to 2024
- Current and Future Market Size Value (USD Bn) & Volume (Units) Analysis and Forecast By Battery Capacity, 2025 to 2035
- Less than 30 kWh
- 30-60 kWh
- 60-80 kWh
- More than 80 kWh
- Y-o-Y Growth Trend Analysis By Battery Capacity, 2020 to 2024
- Absolute $ Opportunity Analysis By Battery Capacity, 2025 to 2035
- U.S. Market Analysis 2020 to 2024 and Forecast 2025 to 2035, By End-Use
- Introduction / Key Findings
- Historical Market Size Value (USD Bn) & Volume (Units) Analysis By End-Use, 2020 to 2024
- Current and Future Market Size Value (USD Bn) & Volume (Units) Analysis and Forecast By End-Use, 2025 to 2035
- Automotive
- BEV
- PHEV
- HEV
- Consumer Electronics
- Laptops
- Digital Camera
- AIDC
- Others
- Medical Devices
- Industrial & Grid Energy
- Automotive
- Y-o-Y Growth Trend Analysis By End-Use, 2020 to 2024
- Absolute $ Opportunity Analysis By End-Use, 2025 to 2035
- U.S. Market Analysis 2020 to 2024 and Forecast 2025 to 2035, By Region
- Introduction
- Historical Market Size Value (USD Bn) & Volume (Units) Analysis By Region, 2020 to 2024
- Current Market Size Value (USD Bn) & Volume (Units) Analysis and Forecast By Region, 2025 to 2035
- West U.S.
- Southwest U.S.
- Midwest U.S.
- Northeast U.S.
- Southeast U.S.
- Market Attractiveness Analysis By Region
- West U.S. Market Analysis 2020 to 2024 and Forecast 2025 to 2035, By States
- Historical Market Size Value (USD Bn) & Volume (Units) Trend Analysis By Market Taxonomy, 2020 to 2024
- Market Size Value (USD Bn) & Volume (Units) Forecast By Market Taxonomy, 2025 to 2035
- By States
- By Product Type
- By Cell Type
- By Nominal Voltage
- By Battery Capacity
- By End-Use
- Market Attractiveness Analysis
- By States
- By Product Type
- By Cell Type
- By Nominal Voltage
- By Battery Capacity
- By End-Use
- Key Takeaways
- Southwest U.S. Market Analysis 2020 to 2024 and Forecast 2025 to 2035, By States
- Historical Market Size Value (USD Bn) & Volume (Units) Trend Analysis By Market Taxonomy, 2020 to 2024
- Market Size Value (USD Bn) & Volume (Units) Forecast By Market Taxonomy, 2025 to 2035
- By States
- By Product Type
- By Cell Type
- By Nominal Voltage
- By Battery Capacity
- By End-Use
- Market Attractiveness Analysis
- By States
- By Product Type
- By Cell Type
- By Nominal Voltage
- By Battery Capacity
- By End-Use
- Key Takeaways
- Midwest U.S. Market Analysis 2020 to 2024 and Forecast 2025 to 2035, By States
- Historical Market Size Value (USD Bn) & Volume (Units) Trend Analysis By Market Taxonomy, 2020 to 2024
- Market Size Value (USD Bn) & Volume (Units) Forecast By Market Taxonomy, 2025 to 2035
- By States
- By Product Type
- By Cell Type
- By Nominal Voltage
- By Battery Capacity
- By End-Use
- Market Attractiveness Analysis
- By States
- By Product Type
- By Cell Type
- By Nominal Voltage
- By Battery Capacity
- By End-Use
- Key Takeaways
- Northeast U.S. Market Analysis 2020 to 2024 and Forecast 2025 to 2035, By States
- Historical Market Size Value (USD Bn) & Volume (Units) Trend Analysis By Market Taxonomy, 2020 to 2024
- Market Size Value (USD Bn) & Volume (Units) Forecast By Market Taxonomy, 2025 to 2035
- By States
- By Product Type
- By Cell Type
- By Nominal Voltage
- By Battery Capacity
- By End-Use
- Market Attractiveness Analysis
- By States
- By Product Type
- By Cell Type
- By Nominal Voltage
- By Battery Capacity
- By End-Use
- Key Takeaways
- Southeast U.S. Market Analysis 2020 to 2024 and Forecast 2025 to 2035, By States
- Historical Market Size Value (USD Bn) & Volume (Units) Trend Analysis By Market Taxonomy, 2020 to 2024
- Market Size Value (USD Bn) & Volume (Units) Forecast By Market Taxonomy, 2025 to 2035
- By States
- By Product Type
- By Cell Type
- By Nominal Voltage
- By Battery Capacity
- By End-Use
- Market Attractiveness Analysis
- By States
- By Product Type
- By Cell Type
- By Nominal Voltage
- By Battery Capacity
- By End-Use
- Key Takeaways
- Key Countries Market Analysis
- California
- Pricing Analysis
- Market Share Analysis, 2024
- By Product Type
- By Cell Type
- By Nominal Voltage
- By Battery Capacity
- By End-Use
- Texas
- Pricing Analysis
- Market Share Analysis, 2024
- By Product Type
- By Cell Type
- By Nominal Voltage
- By Battery Capacity
- By End-Use
- Michigan
- Pricing Analysis
- Market Share Analysis, 2024
- By Product Type
- By Cell Type
- By Nominal Voltage
- By Battery Capacity
- By End-Use
- Ohio
- Pricing Analysis
- Market Share Analysis, 2024
- By Product Type
- By Cell Type
- By Nominal Voltage
- By Battery Capacity
- By End-Use
- Georgia
- Pricing Analysis
- Market Share Analysis, 2024
- By Product Type
- By Cell Type
- By Nominal Voltage
- By Battery Capacity
- By End-Use
- California
- Market Structure Analysis
- Competition Dashboard
- Competition Benchmarking
- Market Share Analysis of Top Players
- By Regional
- By Product Type
- By Cell Type
- By Nominal Voltage
- By Battery Capacity
- By End-Use
- Competition Analysis
- Competition Deep Dive
- Tesla, Inc.
- Overview
- Product Portfolio
- Profitability by Market Segments (Product/Age /Sales Channel/Region)
- Sales Footprint
- Strategy Overview
- Marketing Strategy
- Product Strategy
- Channel Strategy
- General Motors Company
- Overview
- Product Portfolio
- Profitability by Market Segments (Product/Age /Sales Channel/Region)
- Sales Footprint
- Strategy Overview
- Marketing Strategy
- Product Strategy
- Channel Strategy
- Panasonic Energy Corporation
- Overview
- Product Portfolio
- Profitability by Market Segments (Product/Age /Sales Channel/Region)
- Sales Footprint
- Strategy Overview
- Marketing Strategy
- Product Strategy
- Channel Strategy
- LG Energy Solution Michigan, Inc.
- Overview
- Product Portfolio
- Profitability by Market Segments (Product/Age /Sales Channel/Region)
- Sales Footprint
- Strategy Overview
- Marketing Strategy
- Product Strategy
- Channel Strategy
- Samsung SDI America, Inc.
- Overview
- Product Portfolio
- Profitability by Market Segments (Product/Age /Sales Channel/Region)
- Sales Footprint
- Strategy Overview
- Marketing Strategy
- Product Strategy
- Channel Strategy
- Microvast Holdings, Inc.
- Overview
- Product Portfolio
- Profitability by Market Segments (Product/Age /Sales Channel/Region)
- Sales Footprint
- Strategy Overview
- Marketing Strategy
- Product Strategy
- Channel Strategy
- EnerSys
- Overview
- Product Portfolio
- Profitability by Market Segments (Product/Age /Sales Channel/Region)
- Sales Footprint
- Strategy Overview
- Marketing Strategy
- Product Strategy
- Channel Strategy
- A123 Systems LLC
- Overview
- Product Portfolio
- Profitability by Market Segments (Product/Age /Sales Channel/Region)
- Sales Footprint
- Strategy Overview
- Marketing Strategy
- Product Strategy
- Channel Strategy
- Sila Nanotechnologies Inc.
- Overview
- Product Portfolio
- Profitability by Market Segments (Product/Age /Sales Channel/Region)
- Sales Footprint
- Strategy Overview
- Marketing Strategy
- Product Strategy
- Channel Strategy
- Group14 Technologies, Inc.
- Overview
- Product Portfolio
- Profitability by Market Segments (Product/Age /Sales Channel/Region)
- Sales Footprint
- Strategy Overview
- Marketing Strategy
- Product Strategy
- Channel Strategy
- QuantumScape Corporation
- Overview
- Product Portfolio
- Profitability by Market Segments (Product/Age /Sales Channel/Region)
- Sales Footprint
- Strategy Overview
- Marketing Strategy
- Product Strategy
- Channel Strategy
- Duracell Inc.
- Overview
- Product Portfolio
- Profitability by Market Segments (Product/Age /Sales Channel/Region)
- Sales Footprint
- Strategy Overview
- Marketing Strategy
- Product Strategy
- Channel Strategy
- ProTechnologies, Inc.
- Overview
- Product Portfolio
- Profitability by Market Segments (Product/Age /Sales Channel/Region)
- Sales Footprint
- Strategy Overview
- Marketing Strategy
- Product Strategy
- Channel Strategy
- Tesla, Inc.
- Competition Deep Dive
- Assumptions & Acronyms Used
- Research Methodology
List Of Table
- Table 1: U.S. Market Value (USD Bn) Forecast by Region, 2020 to 2035
- Table 2: U.S. Market Volume (Units) Forecast by Region, 2020 to 2035
- Table 3: U.S. Market Value (USD Bn) Forecast by Product Type, 2020 to 2035
- Table 4: U.S. Market Volume (Units) Forecast by Product Type, 2020 to 2035
- Table 5: U.S. Market Value (USD Bn) Forecast by Cell Type, 2020 to 2035
- Table 6: U.S. Market Volume (Units) Forecast by Cell Type, 2020 to 2035
- Table 7: U.S. Market Value (USD Bn) Forecast by Nominal Voltage, 2020 to 2035
- Table 8: U.S. Market Volume (Units) Forecast by Nominal Voltage, 2020 to 2035
- Table 9: U.S. Market Value (USD Bn) Forecast by Battery Capacity, 2020 to 2035
- Table 10: U.S. Market Volume (Units) Forecast by Battery Capacity, 2020 to 2035
- Table 11: U.S. Market Value (USD Bn) Forecast by End-Use, 2020 to 2035
- Table 12: U.S. Market Volume (Units) Forecast by End-Use, 2020 to 2035
- Table 13: West U.S. Market Value (USD Bn) Forecast by States, 2020 to 2035
- Table 14: West U.S. Market Volume (Units) Forecast by States, 2020 to 2035
- Table 15: West U.S. Market Value (USD Bn) Forecast by Product Type, 2020 to 2035
- Table 16: West U.S. Market Volume (Units) Forecast by Product Type, 2020 to 2035
- Table 17: West U.S. Market Value (USD Bn) Forecast by Cell Type, 2020 to 2035
- Table 18: West U.S. Market Volume (Units) Forecast by Cell Type, 2020 to 2035
- Table 19: West U.S. Market Value (USD Bn) Forecast by Nominal Voltage, 2020 to 2035
- Table 20: West U.S. Market Volume (Units) Forecast by Nominal Voltage, 2020 to 2035
- Table 21: West U.S. Market Value (USD Bn) Forecast by Battery Capacity, 2020 to 2035
- Table 22: West U.S. Market Volume (Units) Forecast by Battery Capacity, 2020 to 2035
- Table 23: West U.S. Market Value (USD Bn) Forecast by End-Use, 2020 to 2035
- Table 24: West U.S. Market Volume (Units) Forecast by End-Use, 2020 to 2035
- Table 25: Southwest U.S. Market Value (USD Bn) Forecast by States, 2020 to 2035
- Table 26: Southwest U.S. Market Volume (Units) Forecast by States, 2020 to 2035
- Table 27: Southwest U.S. Market Value (USD Bn) Forecast by Product Type, 2020 to 2035
- Table 28: Southwest U.S. Market Volume (Units) Forecast by Product Type, 2020 to 2035
- Table 29: Southwest U.S. Market Value (USD Bn) Forecast by Cell Type, 2020 to 2035
- Table 30: Southwest U.S. Market Volume (Units) Forecast by Cell Type, 2020 to 2035
- Table 31: Southwest U.S. Market Value (USD Bn) Forecast by Nominal Voltage, 2020 to 2035
- Table 32: Southwest U.S. Market Volume (Units) Forecast by Nominal Voltage, 2020 to 2035
- Table 33: Southwest U.S. Market Value (USD Bn) Forecast by Battery Capacity, 2020 to 2035
- Table 34: Southwest U.S. Market Volume (Units) Forecast by Battery Capacity, 2020 to 2035
- Table 35: Southwest U.S. Market Value (USD Bn) Forecast by End-Use, 2020 to 2035
- Table 36: Southwest U.S. Market Volume (Units) Forecast by End-Use, 2020 to 2035
- Table 37: Midwest U.S. Market Value (USD Bn) Forecast by States, 2020 to 2035
- Table 38: Midwest U.S. Market Volume (Units) Forecast by States, 2020 to 2035
- Table 39: Midwest U.S. Market Value (USD Bn) Forecast by Product Type, 2020 to 2035
- Table 40: Midwest U.S. Market Volume (Units) Forecast by Product Type, 2020 to 2035
- Table 41: Midwest U.S. Market Value (USD Bn) Forecast by Cell Type, 2020 to 2035
- Table 42: Midwest U.S. Market Volume (Units) Forecast by Cell Type, 2020 to 2035
- Table 43: Midwest U.S. Market Value (USD Bn) Forecast by Nominal Voltage, 2020 to 2035
- Table 44: Midwest U.S. Market Volume (Units) Forecast by Nominal Voltage, 2020 to 2035
- Table 45: Midwest U.S. Market Value (USD Bn) Forecast by Battery Capacity, 2020 to 2035
- Table 46: Midwest U.S. Market Volume (Units) Forecast by Battery Capacity, 2020 to 2035
- Table 47: Midwest U.S. Market Value (USD Bn) Forecast by End-Use, 2020 to 2035
- Table 48: Midwest U.S. Market Volume (Units) Forecast by End-Use, 2020 to 2035
- Table 49: Northeast U.S. Market Value (USD Bn) Forecast by States, 2020 to 2035
- Table 50: Northeast U.S. Market Volume (Units) Forecast by States, 2020 to 2035
- Table 51: Northeast U.S. Market Value (USD Bn) Forecast by Product Type, 2020 to 2035
- Table 52: Northeast U.S. Market Volume (Units) Forecast by Product Type, 2020 to 2035
- Table 53: Northeast U.S. Market Value (USD Bn) Forecast by Cell Type, 2020 to 2035
- Table 54: Northeast U.S. Market Volume (Units) Forecast by Cell Type, 2020 to 2035
- Table 55: Northeast U.S. Market Value (USD Bn) Forecast by Nominal Voltage, 2020 to 2035
- Table 56: Northeast U.S. Market Volume (Units) Forecast by Nominal Voltage, 2020 to 2035
- Table 57: Northeast U.S. Market Value (USD Bn) Forecast by Battery Capacity, 2020 to 2035
- Table 58: Northeast U.S. Market Volume (Units) Forecast by Battery Capacity, 2020 to 2035
- Table 59: Northeast U.S. Market Value (USD Bn) Forecast by End-Use, 2020 to 2035
- Table 60: Northeast U.S. Market Volume (Units) Forecast by End-Use, 2020 to 2035
- Table 61: Southeast U.S. Market Value (USD Bn) Forecast by States, 2020 to 2035
- Table 62: Southeast U.S. Market Volume (Units) Forecast by States, 2020 to 2035
- Table 63: Southeast U.S. Market Value (USD Bn) Forecast by Product Type, 2020 to 2035
- Table 64: Southeast U.S. Market Volume (Units) Forecast by Product Type, 2020 to 2035
- Table 65: Southeast U.S. Market Value (USD Bn) Forecast by Cell Type, 2020 to 2035
- Table 66: Southeast U.S. Market Volume (Units) Forecast by Cell Type, 2020 to 2035
- Table 67: Southeast U.S. Market Value (USD Bn) Forecast by Nominal Voltage, 2020 to 2035
- Table 68: Southeast U.S. Market Volume (Units) Forecast by Nominal Voltage, 2020 to 2035
- Table 69: Southeast U.S. Market Value (USD Bn) Forecast by Battery Capacity, 2020 to 2035
- Table 70: Southeast U.S. Market Volume (Units) Forecast by Battery Capacity, 2020 to 2035
- Table 71: Southeast U.S. Market Value (USD Bn) Forecast by End-Use, 2020 to 2035
- Table 72: Southeast U.S. Market Volume (Units) Forecast by End-Use, 2020 to 2035
List Of Figures
- Figure 1: U.S. Market Volume (Units) Forecast 2020 to 2035
- Figure 2: U.S. Market Pricing Analysis
- Figure 3: U.S. Market Value (USD Bn) Forecast 2020 to 2035
- Figure 4: U.S. Market Value Share and BPS Analysis by Product Type, 2025 and 2035
- Figure 5: U.S. Market Y-o-Y Growth Comparison by Product Type, 2025 to 2035
- Figure 6: U.S. Market Attractiveness Analysis by Product Type
- Figure 7: U.S. Market Value Share and BPS Analysis by Cell Type, 2025 and 2035
- Figure 8: U.S. Market Y-o-Y Growth Comparison by Cell Type, 2025 to 2035
- Figure 9: U.S. Market Attractiveness Analysis by Cell Type
- Figure 10: U.S. Market Value Share and BPS Analysis by Nominal Voltage, 2025 and 2035
- Figure 11: U.S. Market Y-o-Y Growth Comparison by Nominal Voltage, 2025 to 2035
- Figure 12: U.S. Market Attractiveness Analysis by Nominal Voltage
- Figure 13: U.S. Market Value Share and BPS Analysis by Battery Capacity, 2025 and 2035
- Figure 14: U.S. Market Y-o-Y Growth Comparison by Battery Capacity, 2025 to 2035
- Figure 15: U.S. Market Attractiveness Analysis by Battery Capacity
- Figure 16: U.S. Market Value Share and BPS Analysis by End-Use, 2025 and 2035
- Figure 17: U.S. Market Y-o-Y Growth Comparison by End-Use, 2025 to 2035
- Figure 18: U.S. Market Attractiveness Analysis by End-Use
- Figure 19: U.S. Market Value (USD Bn) Share and BPS Analysis by Region, 2025 and 2035
- Figure 20: U.S. Market Y-o-Y Growth Comparison by Region, 2025 to 2035
- Figure 21: U.S. Market Attractiveness Analysis by Region
- Figure 22: West U.S. Market Incremental $ Opportunity, 2025 to 2035
- Figure 23: Southwest U.S. Market Incremental $ Opportunity, 2025 to 2035
- Figure 24: Midwest U.S. Market Incremental $ Opportunity, 2025 to 2035
- Figure 25: Northeast U.S. Market Incremental $ Opportunity, 2025 to 2035
- Figure 26: Southeast U.S. Market Incremental $ Opportunity, 2025 to 2035
- Figure 27: West U.S. Market Value Share and BPS Analysis by States, 2025 and 2035
- Figure 28: West U.S. Market Value Share and BPS Analysis by Product Type, 2025 and 2035
- Figure 29: West U.S. Market Y-o-Y Growth Comparison by Product Type, 2025 to 2035
- Figure 30: West U.S. Market Attractiveness Analysis by Product Type
- Figure 31: West U.S. Market Value Share and BPS Analysis by Cell Type, 2025 and 2035
- Figure 32: West U.S. Market Y-o-Y Growth Comparison by Cell Type, 2025 to 2035
- Figure 33: West U.S. Market Attractiveness Analysis by Cell Type
- Figure 34: West U.S. Market Value Share and BPS Analysis by Nominal Voltage, 2025 and 2035
- Figure 35: West U.S. Market Y-o-Y Growth Comparison by Nominal Voltage, 2025 to 2035
- Figure 36: West U.S. Market Attractiveness Analysis by Nominal Voltage
- Figure 37: West U.S. Market Value Share and BPS Analysis by Battery Capacity, 2025 and 2035
- Figure 38: West U.S. Market Y-o-Y Growth Comparison by Battery Capacity, 2025 to 2035
- Figure 39: West U.S. Market Attractiveness Analysis by Battery Capacity
- Figure 40: West U.S. Market Value Share and BPS Analysis by End-Use, 2025 and 2035
- Figure 41: West U.S. Market Y-o-Y Growth Comparison by End-Use, 2025 to 2035
- Figure 42: West U.S. Market Attractiveness Analysis by End-Use
- Figure 43: Southwest U.S. Market Value Share and BPS Analysis by States, 2025 and 2035
- Figure 44: Southwest U.S. Market Value Share and BPS Analysis by Product Type, 2025 and 2035
- Figure 45: Southwest U.S. Market Y-o-Y Growth Comparison by Product Type, 2025 to 2035
- Figure 46: Southwest U.S. Market Attractiveness Analysis by Product Type
- Figure 47: Southwest U.S. Market Value Share and BPS Analysis by Cell Type, 2025 and 2035
- Figure 48: Southwest U.S. Market Y-o-Y Growth Comparison by Cell Type, 2025 to 2035
- Figure 49: Southwest U.S. Market Attractiveness Analysis by Cell Type
- Figure 50: Southwest U.S. Market Value Share and BPS Analysis by Nominal Voltage, 2025 and 2035
- Figure 51: Southwest U.S. Market Y-o-Y Growth Comparison by Nominal Voltage, 2025 to 2035
- Figure 52: Southwest U.S. Market Attractiveness Analysis by Nominal Voltage
- Figure 53: Southwest U.S. Market Value Share and BPS Analysis by Battery Capacity, 2025 and 2035
- Figure 54: Southwest U.S. Market Y-o-Y Growth Comparison by Battery Capacity, 2025 to 2035
- Figure 55: Southwest U.S. Market Attractiveness Analysis by Battery Capacity
- Figure 56: Southwest U.S. Market Value Share and BPS Analysis by End-Use, 2025 and 2035
- Figure 57: Southwest U.S. Market Y-o-Y Growth Comparison by End-Use, 2025 to 2035
- Figure 58: Southwest U.S. Market Attractiveness Analysis by End-Use
- Figure 59: Midwest U.S. Market Value Share and BPS Analysis by States, 2025 and 2035
- Figure 60: Midwest U.S. Market Value Share and BPS Analysis by Product Type, 2025 and 2035
- Figure 61: Midwest U.S. Market Y-o-Y Growth Comparison by Product Type, 2025 to 2035
- Figure 62: Midwest U.S. Market Attractiveness Analysis by Product Type
- Figure 63: Midwest U.S. Market Value Share and BPS Analysis by Cell Type, 2025 and 2035
- Figure 64: Midwest U.S. Market Y-o-Y Growth Comparison by Cell Type, 2025 to 2035
- Figure 65: Midwest U.S. Market Attractiveness Analysis by Cell Type
- Figure 66: Midwest U.S. Market Value Share and BPS Analysis by Nominal Voltage, 2025 and 2035
- Figure 67: Midwest U.S. Market Y-o-Y Growth Comparison by Nominal Voltage, 2025 to 2035
- Figure 68: Midwest U.S. Market Attractiveness Analysis by Nominal Voltage
- Figure 69: Midwest U.S. Market Value Share and BPS Analysis by Battery Capacity, 2025 and 2035
- Figure 70: Midwest U.S. Market Y-o-Y Growth Comparison by Battery Capacity, 2025 to 2035
- Figure 71: Midwest U.S. Market Attractiveness Analysis by Battery Capacity
- Figure 72: Midwest U.S. Market Value Share and BPS Analysis by End-Use, 2025 and 2035
- Figure 73: Midwest U.S. Market Y-o-Y Growth Comparison by End-Use, 2025 to 2035
- Figure 74: Midwest U.S. Market Attractiveness Analysis by End-Use
- Figure 75: Northeast U.S. Market Value Share and BPS Analysis by States, 2025 and 2035
- Figure 76: Northeast U.S. Market Value Share and BPS Analysis by Product Type, 2025 and 2035
- Figure 77: Northeast U.S. Market Y-o-Y Growth Comparison by Product Type, 2025 to 2035
- Figure 78: Northeast U.S. Market Attractiveness Analysis by Product Type
- Figure 79: Northeast U.S. Market Value Share and BPS Analysis by Cell Type, 2025 and 2035
- Figure 80: Northeast U.S. Market Y-o-Y Growth Comparison by Cell Type, 2025 to 2035
- Figure 81: Northeast U.S. Market Attractiveness Analysis by Cell Type
- Figure 82: Northeast U.S. Market Value Share and BPS Analysis by Nominal Voltage, 2025 and 2035
- Figure 83: Northeast U.S. Market Y-o-Y Growth Comparison by Nominal Voltage, 2025 to 2035
- Figure 84: Northeast U.S. Market Attractiveness Analysis by Nominal Voltage
- Figure 85: Northeast U.S. Market Value Share and BPS Analysis by Battery Capacity, 2025 and 2035
- Figure 86: Northeast U.S. Market Y-o-Y Growth Comparison by Battery Capacity, 2025 to 2035
- Figure 87: Northeast U.S. Market Attractiveness Analysis by Battery Capacity
- Figure 88: Northeast U.S. Market Value Share and BPS Analysis by End-Use, 2025 and 2035
- Figure 89: Northeast U.S. Market Y-o-Y Growth Comparison by End-Use, 2025 to 2035
- Figure 90: U.S. Market - Tier Structure Analysis
- Figure 91: U.S. Market - Company Share Analysis
- FAQs -
What was the U.S. Lithium-ion Battery Packs Market Size Reported by Fact.MR for 2025?
The U.S. Lithium-ion Battery Packs Market was valued at USD 44.8 Billion in 2025.
Who are the Major Players Operating in the U.S. Lithium-ion Battery Packs Market?
Prominent players in the market are Tesla, Inc., General Motors Company, Panasonic Energy Corporation, LG Energy Solution Michigan, Inc., among others.
What is the Estimated Valuation of the U.S. Lithium-ion Battery Packs Market in 2035?
The market is expected to reach a valuation of USD 144.2 Billion in 2035.
What Value CAGR did the U.S. Lithium-ion Battery Packs Market Exhibit Over the Last Five Years?
The historic growth rate of the U.S. Lithium-ion Battery Packs Market was 9.2% from 2020 to 2024.