- Market Value (2025): USD 1.8 Bn
- Estimated Value (2026): USD 2.2 Bn
- Forecast Value (2036): USD 12.8 Bn
- CAGR (2026-2036): 19.3%
What is the Virtual 3D Nanorobots Market forecast to be worth by 2036?
USD 2.2 Billion in 2026 and USD 12.8 Billion by 2036 at a 19.3% CAGR.
- The virtual 3D nanorobots market crossed a valuation of USD 1.8 Billion in 2025 as research teams tested simulation-led screening before laboratory work.
- Demand is projected to increase from USD 2.2 Billion in 2026 to USD 12.8 Billion by 2036.
- The market is forecast to record 19.3% CAGR from 2026 to 2036 owing to validation-led screening and secure workflow needs.
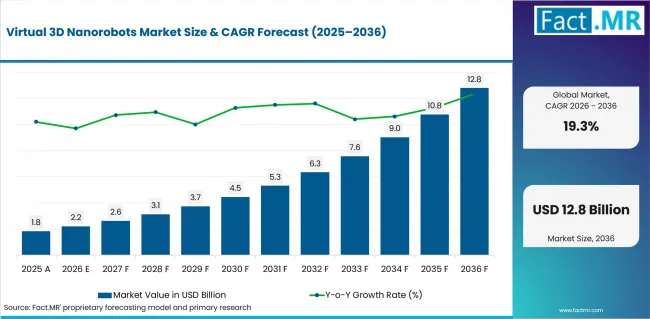
Virtual 3d Nanorobots Market Value Analysis | Source: Fact.MR
What are the defining numbers behind Virtual 3D Nanorobots Market growth?
USD 10.6 Billion absolute opportunity by 2036.
- Demand Drivers in the Market
- Research teams need virtual screening because nanoscale fabrication and in vivo testing consume specialist time before weak designs are rejected.
- Software demand is expected to rise when reusable solvers and visualization tools become part of repeat research workflows.
- Cloud deployment is projected to gain from uneven compute needs during parameter sweeps and high-quality rendering runs.
- Key Segments Analyzed
- By Component: Software is projected to hold 69.0% share in 2026 because research teams pay for repeatable simulation and visualization capability.
- By Deployment: Cloud-Based is estimated to account for 58.0% share in 2026 since teams need flexible compute without owning dedicated systems.
- By Application: Biomedical Research is anticipated to capture 32.0% share in 2026 due to early use in therapeutic and tissue-response review.
- By End User: Research Institutes are forecast to hold 38.0% share in 2026 as early concepts remain tied to public laboratories and universities.
- Analyst Opinion at Fact.MR
- Shambhu Nath Jha, Principal Consultant at Fact.MR, states, “Revenue capture is expected to depend on proof that virtual nanorobot simulation can guide a real research decision. Customers need clear model limits, secure deployment paths and records that explain why a virtual result should be trusted before laboratory work begins.”
- Strategic Implications
- Research teams should define validation gates before choosing software..
- Platform providers should make private cloud and on-premises choices easy to compare..
- Investors should separate visualization-only tools from platforms that support calibrated screening.
South Korea is expected to record a 20.9% CAGR from 2026 to 2036. The USA is projected to record a 20.4% CAGR. Canada is anticipated to post a 19.6% CAGR. Germany is estimated to reach 19.2% CAGR. The UK is forecast to record 18.9% CAGR. Australia is projected to reach 18.6% CAGR. Japan is expected to record 18.3% CAGR.
How does the Virtual 3D Nanorobots Market break down by segment?
Software is expected to lead Component at 69.0% share in 2026. Cloud-Based deployment is projected to lead Deployment at 58.0% share in 2026.
Which component dominates?
Software is projected to account for 69.0% share in 2026.
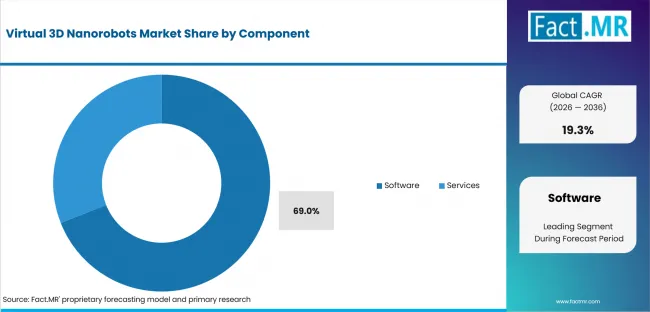
Virtual 3d Nanorobots Market Analysis By Component | Source: Fact.MR
Software leads because virtual nanorobot work depends on reusable solvers and control environments. Services remain useful for setup and training, yet recurring license value is concentrated in the software layer.
What leads the Deployment segment?
Cloud-Based is expected to hold 58.0% share in 2026.
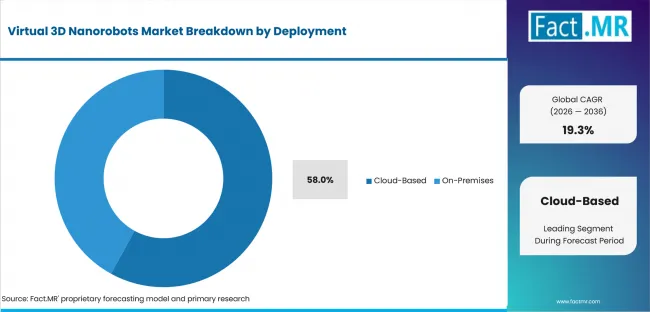
Virtual 3d Nanorobots Market Analysis By Deployment | Source: Fact.MR
Cloud deployment fits uneven simulation workloads because teams need flexible compute for sweeps and rendering work. Private deployment remains relevant when clinical or defense projects require tighter access control. Biomedical research gives virtual nanorobots a clear testing problem around transport and tissue response. The workflow helps teams reject weak designs before costly lab work begins.
What supports Research Institutes within End User?
Research Institutes are forecast to hold 38.0% share in 2026.
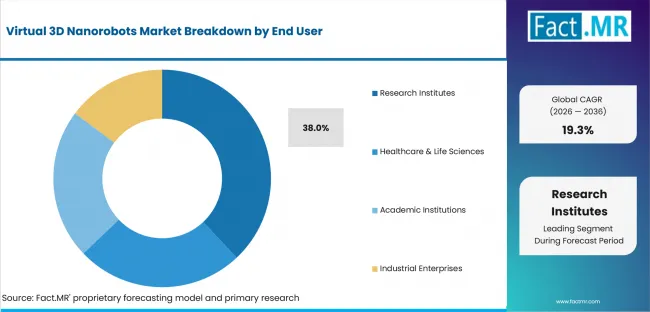
Virtual 3d Nanorobots Market Analysis By End User | Source: Fact.MR
Research institutes lead because virtual 3D nanorobot concepts remain close to public laboratories and university programs. These customers test early ideas before hospitals or manufacturers consider commercial use.
How does Technology shape demand?
Digital Twin Simulation is expected to remain the main technology layer.
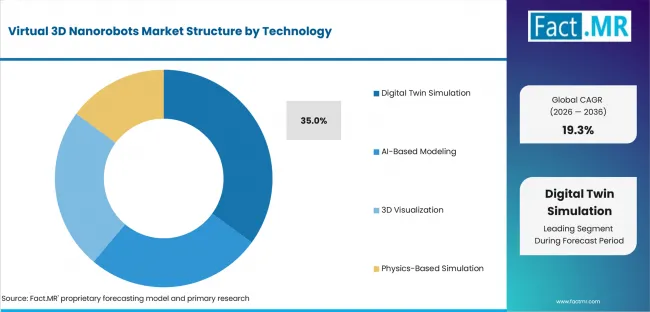
Virtual 3d Nanorobots Market Analysis By Technology | Source: Fact.MR
Digital twin simulation combines geometry, motion rules and review records for teams moving from concept screening to laboratory validation.
What is accelerating Virtual 3D Nanorobots Market adoption, and what is holding it back?
Demand is expected to rise as companies reduce physical testing and use virtual screening for validation. Growth may be limited by low model trust and secure deployment requirements.
Drivers Impact Analysis
| DRIVER | (~) % IMPACT ON CAGR | GEOGRAPHIC RELEVANCE | IMPACT TIMELINE |
|---|---|---|---|
| In-silico screening economics | +4.4% | USA, South Korea | Short term (<= 2 years) |
| Reusable simulation software | +3.6% | Global research centers | Short term (<= 2 years) |
| Cloud compute access | +2.7% | USA, Canada, UK | Medium term (2-4 years) |
| Biomedical modeling use | +2.4% | Japan, Germany, Australia | Medium term (2-4 years) |
| Experiment record integration | +1.8% | South Korea, Germany | Long term (>= 4 years) |
Source: Fact.MR analysis. Updated Aug 3, 2026
- In-silico screening economics: Virtual screening is expected to reduce weak designs before fabrication or biological testing begins.
- Reusable simulation software: Licensed solvers and visualization tools are expected to gain share when repeat projects need consistent review records.
- Cloud compute access: Cloud platforms are projected to widen access when research teams need temporary compute for heavy simulation runs.
Opportunity Impact Analysis
| OPPORTUNITY | (~) % IMPACT ON CAGR | GEOGRAPHIC RELEVANCE | IMPACT TIMELINE |
|---|---|---|---|
| Secure modular cloud platforms | +2.0% | USA and Canada | Medium term (2-4 years) |
| AI-assisted surrogate simulation | +1.6% | Japan and South Korea | Medium term (2-4 years) |
| Research-institute licensing | +1.1% | UK and Australia | Long term (>= 4 years) |
| Biomedical workflow templates | +0.9% | Germany and Japan | Long term (>= 4 years) |
Source: Fact.MR analysis. Updated Aug 3, 2026
- Secure modular cloud platforms: Customers are expected to favor environments that combine solvers and visualization without forcing one custom build.
- AI-assisted surrogate simulation: Faster approximation tools are expected to help teams test many design choices before detailed runs begin.
- Research-institute licensing: Shared licensing models are projected to help universities and public laboratories avoid duplicated system spending.
Restraints Impact Analysis
| RESTRAINT | (~) % IMPACT ON CAGR | GEOGRAPHIC RELEVANCE | IMPACT TIMELINE |
|---|---|---|---|
| Model applicability limits | -1.5% | Global | Short term (<= 2 years) |
| Interoperability with lab records | -1.1% | Research institutes | Short term (<= 2 years) |
| Security review burden | -0.9% | USA, Japan, Germany | Medium term (2-4 years) |
| Specialist training needs | -0.7% | University programs | Long term (>= 4 years) |
Source: Fact.MR analysis. Updated Aug 3, 2026
- Model applicability limits: A convincing 3D view is not enough when a result must influence a real experiment.
- Interoperability with lab records: Adoption is expected to slow when simulation output cannot be tied to measurement files and experiment history.
- Security review burden: Defense, clinical and industrial programs are expected to require private deployment paths before wider use.
Which countries are scaling Virtual 3D Nanorobots Market fastest?
- South Korea leads through nanofabrication access and strong semiconductor research. The USA follows as public laboratories and pharmaceutical companies create several buying routes.
- Canada benefits from shared research infrastructure, while Germany advances through materials testing and industrial qualification. The UK grows through university and life-sciences research.
- Australia gains from biomedical screening needs, while Japan develops through health and robotics programs. Market entry depends on validation proof, local service depth and clear communication of platform limits.
The full report provides country-level CAGR analysis across North America; Latin America; Europe; East Asia; South Asia; Oceania; and the Middle East and Africa.
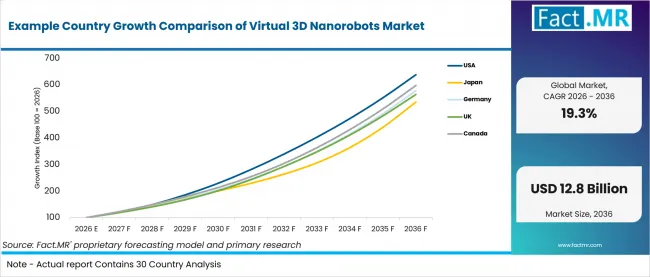
Example Country Growth Comparison Of Virtual 3d Nanorobots Market | Source: Fact.MR
| Country | CAGR (2026-2036) |
|---|---|
| USA | 20.4% |
| Japan | 18.3% |
| Germany | 19.2% |
| UK | 18.9% |
| Canada | 19.6% |
| Australia | 18.6% |
| South Korea | 20.9% |
Source: Fact.MR analysis. Updated Aug 3, 2026
What supports USA adoption?
20.4% CAGR, supported by public laboratories and enterprise software budgets.
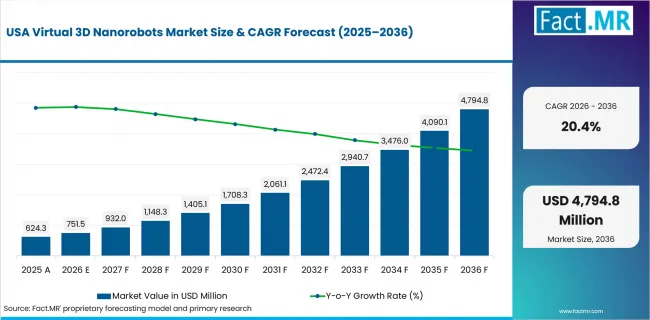
Virtual 3d Nanorobots Market Country Value Analysis | Source: Fact.MR
The USA’s growth reflects demand from public laboratories, pharmaceutical companies and engineering teams. Research institutions are expected to review model security and validation evidence before approving new platforms. Enterprise software agreements create another purchasing route. Providers that connect virtual results with controlled research workflows are likely to gain wider acceptance.
How is Japan scaling demand?
18.3% CAGR, driven by mission-led health and robotics programs.
Japan’s growth is linked to long-term programs that connect robotics, healthcare and advanced research. Universities are expected to play an important role in early platform testing. Domestic partnerships may help vendors prove technical value before wider procurement. Buyers are likely to favor systems with clear validation methods and dependable local support.
What is shaping Germany’s outlook?
19.2% CAGR, backed by materials record continuity and industrial qualification.
Germany’s growth is shaped by materials research and industrial engineering requirements. Research institutes place high value on traceable records during model review. Industrial customers are expected to compare virtual results with laboratory measurements before wider use. Platforms that provide clear documentation and repeatable outputs may move through qualification more quickly.
How is the UK developing demand?
18.9% CAGR, supported by university research and life-sciences test environments.
The UK’s growth reflects strong university research and shared scientific facilities. Grant-backed programs provide an early route for testing modeling platforms. Life-sciences organizations are expected to prefer secure systems that clearly explain model limits. Wider adoption will depend on validation evidence and smooth use across collaborative research environments.
What supports Canada’s growth?
19.6% CAGR, supported by shared research infrastructure and applied science programs.
Canada’s growth is supported by laboratories that use shared platforms to spread software and computing costs across research teams. Health science and materials programs create several application routes. Shared infrastructure may also reduce duplicated investment. Providers with strong technical support are better placed to serve public research networks and collaborative projects.
How does Australia perform?
18.6% CAGR, backed by biomedical research and collaborative research centers.
Australia’s growth is expected to come from biomedical teams that use virtual screening before costly laboratory studies. Collaborative research centers improve access to specialized software and technical expertise. This structure supports early testing across several institutions. Platforms that reduce experiment burden and explain validation limits clearly are likely to gain stronger research demand.
Why does South Korea lead the listed countries?
20.9% CAGR, driven by nanofabrication access and electronics research depth.
South Korea’s leadership reflects strong nanofabrication capacity and advanced electronics research. Close links between laboratories and semiconductor programs support faster platform testing. Local technical expertise may shorten validation and encourage repeat use. Vendors that demonstrate accurate modeling and secure deployment are likely to gain stronger access to research and industrial users.
Who leads the Virtual 3D Nanorobots Market?
NVIDIA and Siemens Digital Industries Software show the clearest direct relevance, while Dassault Systèmes strengthens the wider digital-twin and simulation landscape.
NVIDIA supports virtual nanorobot modeling through accelerated computing, Omniverse and digital-twin development tools. Siemens Digital Industries Software contributes simulation, engineering and digital-twin platforms for complex product research. Dassault Systèmes adds 3D modeling and life-sciences simulation capabilities. Schrödinger supports molecular modeling and computational drug research. Synopsys, including Ansys, and Cadence Design Systems extend the field through multiphysics, semiconductor and engineering simulation. COMSOL and MathWorks broaden coverage through nanoscale modeling, numerical analysis and control-system development
Which companies are the key providers?
Key companies include NVIDIA Corporation; Siemens Digital Industries Software; Dassault Systèmes; Schrödinger, Inc.; Synopsys, Inc., including Ansys; Cadence Design Systems, Inc.; COMSOL AB; and MathWorks, Inc.
- NVIDIA Corporation
- Siemens Digital Industries Software
- Dassault Systèmes
- Schrödinger, Inc.
- Synopsys, Inc., including Ansys
- Cadence Design Systems, Inc.
- COMSOL AB
- MathWorks, Inc.
Bibliography
- National Nanotechnology Coordination Office. (2026, April 9). NNI Supplement to the President’s 2026 Budget.
- NVIDIA Corporation. (2024, March 18). NVIDIA Announces Omniverse Cloud APIs to Power Wave of Industrial Digital Twin Software Tools.
- National Science Foundation. (2026, February 13). NSF launches $100M National Quantum and Nanotechnology Research Infrastructure program.
This Report Answers
- The report provides strategic intelligence on the Virtual 3D Nanorobots Market across Component and Deployment choices that shape virtual nanoscale research programs.
- Segment analysis covers Software and Cloud-Based deployment as share leaders within the 2026 market.
- Country outlook evaluates South Korea and the USA alongside Canada and Germany. The UK, Australia and Japan complete the growth comparison.
- Competitive analysis profiles NVIDIA and Siemens Digital Industries Software alongside Dassault Systèmes. Synopsys, Inc., including Ansys, Hexagon and COMSOL complete the first group. MathWorks completes the provider set.
- Technology assessment covers Digital Twin Simulation and Nanorobot Modeling. Real-Time Simulation and AI-Based Modeling complete the technology view.
What does the Virtual 3D Nanorobots Market cover?
Virtual 3D nanorobots are software-based representations of nanoscale robotic systems used for concept design, simulation and controlled review before lab work.
The Virtual 3D Nanorobots Market covers software and services used to model nanoscale movement and biological interaction.
What is included in the scope?
Virtual 3D nanorobot systems are used across research institutes and public laboratories. Private research centers and healthcare or life-sciences organizations are included when they use simulation to review nanoscale robotic concepts.
The scope includes Component and Deployment alongside Application, End User and Technology. Coverage spans Software, Simulation Software and Visualization Platforms.
What is excluded from the scope?
Physical nanorobots, downstream drugs and finished medical devices remain outside the scope of this market.
The scope excludes nanofabrication equipment and unrelated general software revenue. Standalone 3D rendering tools are excluded when they do not support nanoscale robotic simulation.
How Was the Analysis Built?
The analysis draws on 120+ reference materials, 35+ company portfolios and more than 20 industry interviews.
- Primary Research: Primary research includes discussions with manufacturers; service providers; developers; distributors; end users; procurement teams; and subject-matter experts. These conversations examine purchasing priorities, operating challenges and approval requirements.
- Desk Research: Desk research covers government statistics; regulatory publications; company filings; trade records; technical studies; associations; and standards. Every external reference used in the analysis is documented in the bibliography.
- Market Sizing and Forecasting: Market estimates combine historical performance; demand indicators; pricing trends; segment shares; company participation; country growth; adoption patterns; and barriers to expansion.
- Data Validation and Update Cycle: Findings are validated through interviews; public records; company activity; and regulatory changes. Regular updates review launches; capacity changes; approvals; and procurement trends.
Segmentation
What is the report’s scope and coverage?
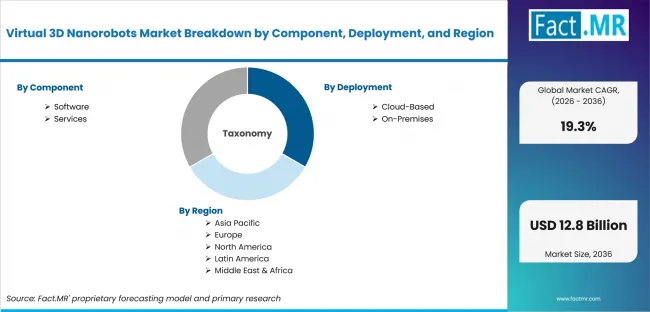
Virtual 3d Nanorobots Market Breakdown By Component, Deployment, And Region | Source: Fact.MR
| Attribute | Details |
|---|---|
| Quantitative Units | USD billion |
| Market Definition | Commercial software, cloud subscriptions, visualization platforms and services used to construct, simulate and review virtual 3D nanoscale robotic systems. |
| Component | Software; Simulation Software; Visualization Platforms; Services |
| Deployment | Cloud-Based; Public Cloud; Private Cloud; On-Premises |
| Application | Biomedical Research; Targeted Drug Delivery Modeling; Nanosurgery Simulation; Materials Science |
| End User | Research Institutes; Public Laboratories; Private Research Centers; Healthcare & Life Sciences |
| Technology | Digital Twin Simulation; Nanorobot Modeling; Real-Time Simulation; AI-Based Modeling |
| Regions Covered | North America; Latin America; Europe; East Asia; South Asia and Pacific; Middle East and Africa |
| Countries Covered | USA; Japan; Germany; UK; Canada; Australia; South Korea |
| Key Companies Profiled | NVIDIA Corporation; Siemens Digital Industries Software; Dassault Systèmes; Schrödinger, Inc.; Synopsys, Inc., including Ansys; Cadence Design Systems, Inc.; COMSOL AB; MathWorks, Inc. |
| Forecast Period | 2026 to 2036 |
| Approach | Hybrid top-down and bottom-up approach using software revenue boundaries, deployment mix, application intensity, technology adoption, country demand and company portfolio review. |
Source: Fact.MR analysis. Updated Aug 3, 2026
How is the market segmented?
-
By Component
- Software
- Simulation Software
- Visualization Platforms
- Services
- Consulting
- Integration & Support
- Software
-
By Deployment
- Cloud-Based
- Public Cloud
- Private Cloud
- On-Premises
- Research Infrastructure
- Enterprise Data Centers
- Cloud-Based
-
By Application
- Biomedical Research
- Targeted Drug Delivery Modeling
- Nanosurgery Simulation
- Materials Science
- Nanomaterial Design
- Surface Interaction Simulation
- Academic & Research
- University Research
- Educational Simulation
- Industrial Manufacturing
- Nanofabrication
- Process Optimization
- Others
- Defense Research
- Environmental Studies
- Biomedical Research
-
By End User
- Research Institutes
- Public Laboratories
- Private Research Centers
- Healthcare & Life Sciences
- Pharmaceutical Companies
- Medical Device Companies
- Academic Institutions
- Universities
- STEM Education
- Industrial Enterprises
- Manufacturing Companies
- Nanotechnology Firms
- Research Institutes
-
By Technology
- Digital Twin Simulation
- Nanorobot Modeling
- Real-Time Simulation
- AI-Based Modeling
- Predictive Analytics
- Optimization Algorithms
- 3D Visualization
- Interactive Rendering
- Virtual Prototyping
- Physics-Based Simulation
- Molecular Dynamics
- Multiphysics Simulation
- Digital Twin Simulation
-
By Region:
- North America
- Latin America
- Western Europe
- Eastern Europe
- East Asia
- South Asia and Pacific
- Middle East and Africa
Frequently Asked Questions
Which Component leads the market?
Which Deployment category leads the market?
Which Application leads the market?
Which End User leads the market?
Which country records the highest listed CAGR?
What is the primary driver in this market?
What is the main restraint?
Why does Software lead demand?
Who worked on this report


Preview the report firsthand - request a free sample
Free SampleGet the brochure for pricing and purchase details
Download PDF