- Market Value (2025): USD 9.7 Bn
- Estimated Value (2026): USD 10.9 Bn
- Forecast Value (2036): USD 34.5 Bn
- CAGR (2026-2036): 12.2%
What is the Virtual Security Appliance Market forecast to be worth by 2036?
USD 10.9 billion in 2026 to USD 34.5 billion by 2036 at 12.2% CAGR.
- The virtual security appliance market reached USD 9.7 billion in 2025.
- Demand is projected to rise from USD 10.9 billion in 2026 to USD 34.5 billion by 2036.
- The market is forecast to record 12.2% CAGR from 2026 to 2036 as hybrid infrastructure requires inspection closer to workloads.
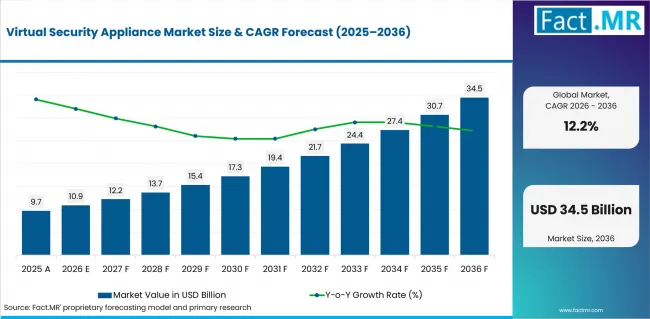
Virtual Security Appliance Market Value Analysis | Source: Fact.MR
What are the defining numbers behind Virtual Security Appliance Market growth?
USD 23.6 billion absolute opportunity by 2036.
- Demand Drivers in the Market
- Cloud migration creates demand for inspection points that follow applications across public and private infrastructure.
- Zero-trust programs are expected to lift demand for policy enforcement closer to users, devices, and workloads.
- Managed security teams need repeatable virtual deployments that reduce hardware refresh pressure at branch and cloud edges.
- Encrypted traffic review and segmentation needs are expected to make virtual firewall placement part of more cloud architecture plans.
- Key Segments Analyzed
- By Deployment: Public Cloud is projected to hold 43.0% share in 2026 because customers activate capacity close to workloads without a hardware buying cycle.
- By Appliance Type: Virtual Firewall is projected to hold 39.0% share in 2026 as it provides the first inline control for routing, segmentation, access policy, and threat inspection.
- By Enterprise Size: Large Enterprises is projected to hold 61.0% share in 2026 because these customers operate more clouds, regulated zones, and centralized policy estates.
- Analyst Opinion at Fact.MR
- Shambhu Nath Jha, Principal Consultant at Fact.MR, states, “Virtual security appliance adoption is expected to depend on repeatable security insertion rather than simple image availability. Customers want tested routing patterns, clear failover behavior, policy migration support, and predictable cloud operating cost before they expand production use.”
- Strategic Implications
- Cloud security teams should test policy portability before expanding appliance estates.
- Service providers can improve renewals by packaging virtual firewalls with monitoring, templates, and support.
- Investors should separate virtual-appliance revenue from SaaS tools outside the customer traffic path.
South Korea is projected to record a 13.2% CAGR from 2026 to 2036 as telecom and large enterprise cloud programs expand. The USA follows at 12.9% through cloud migration and federal modernization. Canada is anticipated to grow at 12.6%, with the UK at 12.3%, Germany at 12.0%, Australia at 11.7%, and Japan at 11.4%.
How does the Virtual Security Appliance Market break down by segment?
Public Cloud is expected to lead Deployment at 43.0% share in 2026. Virtual Firewall is projected to lead Appliance Type at 39.0% share in 2026.
Which deployment leads demand?
Public Cloud is projected to account for 43.0% share in 2026.
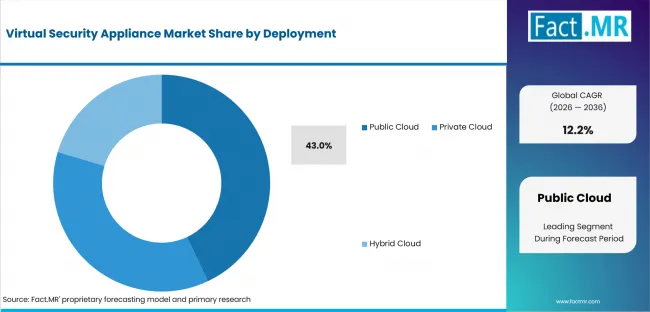
Virtual Security Appliance Market Analysis By Deployment | Source: Fact.MR
Public cloud deployment leads as virtual appliances can be placed close to workloads and traffic gateways. Flexible capacity also supports rapid expansion across changing cloud environments.
Which appliance type dominates?
Virtual Firewall holds 39.0% share in 2026.
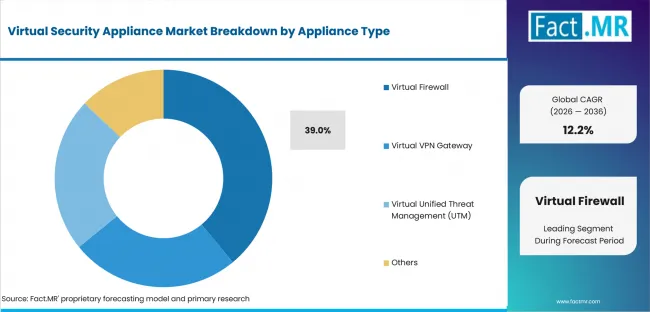
Virtual Security Appliance Market Analysis By Appliance Type | Source: Fact.MR
Virtual firewalls remain the first security layer added to many cloud and virtualized networks. Their role combines traffic inspection, access control, segmentation and threat prevention within one appliance.
Why do Large Enterprises lead?
Large Enterprises lead with 61.0% share in 2026.
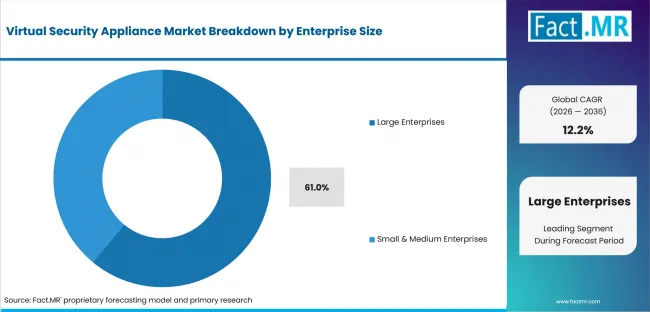
Virtual Security Appliance Market Analysis By Enterprise Size | Source: Fact.MR
Large organizations manage several cloud accounts, data centers and regulated environments. Consistent policies, centralized logging and reliable failover make virtual security appliances more valuable across these complex networks.
What is accelerating Virtual Security Appliance Market adoption, and what is holding it back?
Demand is expected to rise through cloud adoption and zero-trust security. Growth may be limited by performance testing, complex routing and cloud operating costs.
Drivers Impact Analysis
| DRIVER | (~) % IMPACT ON CAGR | GEOGRAPHIC RELEVANCE | IMPACT TIMELINE |
|---|---|---|---|
| Cloud and hybrid workload migration | +3.1% | USA, UK, Canada | Short term (<= 2 years) |
| Zero-trust enforcement planning | +2.4% | USA, Germany, Japan | Short term (<= 2 years) |
| Managed security delivery models | +1.8% | UK, Australia, Canada | Medium term (2-4 years) |
| Encrypted traffic inspection needs | +1.3% | Large enterprise markets | Medium term (2-4 years) |
| Virtual network function expansion | +0.9% | South Korea, Japan, USA | Long term (>= 4 years) |
Source: Fact.MR analysis. Updated Aug 3, 2026
- Cloud and hybrid workload migration: Workload movement is expected to increase the value of inspection points that can be placed near applications without waiting for hardware.
- Zero-trust enforcement planning: Security teams are expected to test virtual appliances where access decisions need policy checks across users, devices, and workloads.
- Managed security delivery models: MSP and MSSP channels are expected to favor appliances that support templates, central management, and repeatable customer onboarding.
Opportunity Impact Analysis
| OPPORTUNITY | (~) % IMPACT ON CAGR | GEOGRAPHIC RELEVANCE | IMPACT TIMELINE |
|---|---|---|---|
| Consumption-based virtual firewall offers | +1.4% | USA and UK | Short term (<= 2 years) |
| DPU and offload-enabled private cloud designs | +1.0% | USA, Japan, South Korea | Medium term (2-4 years) |
| Policy migration and automation services | +0.8% | Canada, Germany, Australia | Medium term (2-4 years) |
| Edge and distributed workload protection | +0.6% | Australia, South Korea | Long term (>= 4 years) |
Source: Fact.MR analysis. Updated Aug 3, 2026
- Consumption-based virtual firewall offers: Subscription and marketplace offers are expected to help customers align appliance spending with workload growth.
- DPU and offload-enabled private cloud designs: Hardware offload is expected to create opportunity where customers need higher throughput without shifting all inspection work to host CPUs.
- Policy migration and automation services: Providers that simplify rule migration and rollback are expected to reduce approval delays during cloud transition.
Restraints Impact Analysis
| RESTRAINT | (~) % IMPACT ON CAGR | GEOGRAPHIC RELEVANCE | IMPACT TIMELINE |
|---|---|---|---|
| Throughput and latency validation | -1.3% | Global | Short term (<= 2 years) |
| Routing and high-availability complexity | -1.0% | Large enterprise markets | Short term (<= 2 years) |
| Cloud cost visibility issues | -0.8% | USA, UK, Canada | Medium term (2-4 years) |
| Security skill and change-control gaps | -0.5% | Smaller enterprise accounts | Long term (>= 4 years) |
Source: Fact.MR analysis. Updated Aug 3, 2026
- Throughput and latency validation: Customers delay expansion when encrypted inspection changes response time, compute use, or traffic-path cost.
- Routing and high-availability complexity: A stateful inspection point changes failure domains, so teams must prove failover and asymmetric routing behavior before live use.
- Cloud cost visibility issues: Consumption charges can rise when traffic inspection runs continuously. This makes cost forecasting part of the approval process.
Which countries are scaling Virtual Security Appliance Market fastest?
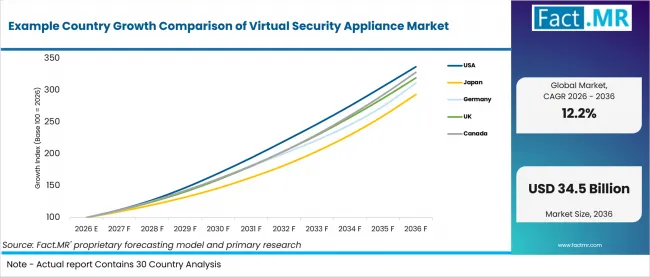
Example Country Growth Comparison Of Virtual Security Appliance Market | Source: Fact.MR
| Country | CAGR (2026-2036) |
|---|---|
| South Korea | 13.2% |
| USA | 12.9% |
| Canada | 12.6% |
| UK | 12.3% |
| Germany | 12.0% |
| Australia | 11.7% |
| Japan | 11.4% |
Source: Fact.MR analysis. Updated Aug 3, 2026
- South Korea leads through telecom cloud programs and enterprise security reviews. The USA follows as federal modernization and large cloud estates support production use.
- Canada benefits from regulated demand across cloud and data-center traffic, while the UK advances through assurance practices and managed services. Germany grows through compliance-led deployment.
- Australia gains from distributed users and branch networks. Japan develops more steadily through local support and data-handling clarity. Market entry depends on reference architectures, support depth and production proof.
What supports South Korea adoption?
13.2% CAGR, supported by telecom cloud programs and large enterprise security upgrades.
South Korea's growth reflects a market where network operators and large enterprises need virtual controls that can be inserted into cloud and data-center traffic paths. Providers must show predictable throughput and central policy control before wider expansion. Local support is expected to remain important as customers connect network security with cloud migration plans.
What supports USA adoption?
12.9% CAGR, backed by federal modernization and large hybrid cloud estates.
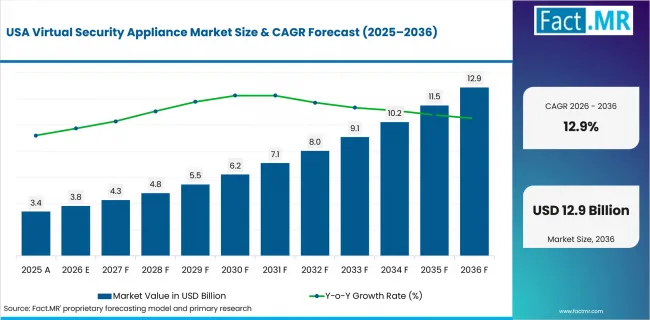
Virtual Security Appliance Market Country Value Analysis | Source: Fact.MR
The USA's growth reflects large customers that buy through enterprise agreements, cloud marketplaces, and repeatable reference architectures. Security teams need controls that follow workloads across public cloud, data centers, and remote access. Demand is expected to favor platforms with strong automation, logging, and policy migration support.
How is Canada scaling demand?
12.6% CAGR, driven by regulated cloud use and security governance.
Canada's growth is linked to banks, public agencies, and regulated enterprises that need clear oversight before sensitive workloads move into production environments. Virtual appliances are expected to help teams apply consistent inspection rules across hybrid infrastructure. Adoption depends on audit evidence, support availability, and predictable operating cost.
How does the UK perform?
12.3% CAGR, led by cloud assurance and managed-service use.
The UK's growth is shaped by customers that often use cloud-provider assurance, managed-service partners, and internal security review before workload migration. Virtual security appliance demand is expected to rise where organizations need central control without returning to hardware-heavy perimeter designs. Channel support is likely to guide smaller deployments.
What is shaping Germany's outlook through 2036?
12.0% CAGR, supported by compliance-led approval and cloud expansion.
Germany's growth reflects a cautious market where security architects, data-protection teams, and regulated business owners review appliance placement before cloud traffic is routed through it. Demand is expected to favor providers that explain logging, access control, and data-handling responsibilities clearly. Proof of stable operation matters as much as feature depth.
What supports Australia's growth?
11.7% CAGR, backed by hybrid work and distributed enterprise networks.
Australia's growth reflects demand from enterprises that need security controls across remote users, branch traffic, and cloud-hosted applications. Virtual appliances are expected to support policy consistency where geography makes centralized hardware less practical. Customers are likely to value managed support and simpler deployment packages.
How is Japan developing demand?
11.4% CAGR, driven by controlled cloud migration and local implementation support.
Japan's growth reflects customers that prefer detailed technical requirements, local service access, and clear data-residency responsibilities. Virtual security appliances are expected to gain acceptance when providers reduce configuration risk and prove stable traffic handling. Public-sector and large enterprise programs are likely to move through careful approval steps.
Who leads the Virtual Security Appliance Market?
Palo Alto Networks, Cisco Systems, Fortinet, Inc., and Check Point Software Technologies show direct relevance through cloud firewall platforms, policy control, and enterprise network security depth.
Broadcom Inc. (VMware vDefend), Hewlett Packard Enterprise Company (Juniper Networks), and Trend Micro extend competition through virtualization, network, and workload-security integration. Sophos Ltd., SonicWall, and Hillstone Networks address channel-led and midmarket deployments.
Which companies are the key providers?
Key companies include Palo Alto Networks; Cisco Systems; Fortinet, Inc.; Check Point Software Technologies; Broadcom Inc. (VMware vDefend); Hewlett Packard Enterprise Company (Juniper Networks); Sophos Ltd.; SonicWall; Trend Micro; Hillstone Networks.
- Palo Alto Networks
- Cisco Systems
- Fortinet, Inc.
- Check Point Software Technologies
- Broadcom Inc. (VMware vDefend)
- Hewlett Packard Enterprise Company (Juniper Networks)
- Sophos Ltd.
- SonicWall
- Trend Micro
- Hillstone Networks
Bibliography
- Hewlett Packard Enterprise. (2025, July 2). Hewlett Packard Enterprise closes acquisition of Hewlett Packard Enterprise Company (Juniper Networks) to offer cloud-native AI-driven portfolio.
- SonicWall. (2026, May 12). SonicWall expands Gen 8 platform to the cloud with new NSv XS virtual firewall.
- Department for Science, Innovation and Technology, & Home Office. (2025, April 10). Cyber security breaches survey 2025. GOV.UK.
- Cybersecurity and Infrastructure Security Agency. (2025, July 15). Securing core cloud identity infrastructure: Addressing advanced threats through public-private collaboration.
This Report Answers
- The report covers Deployment and Appliance Type choices that shape cloud security programs.
- Segment analysis covers Public Cloud and Virtual Firewall as the share leaders within the 2026 market.
- Country outlook evaluates South Korea and the USA alongside Canada and the UK. Germany, Australia, and Japan complete the growth comparison.
- Competitive analysis profiles Palo Alto Networks, Cisco Systems, Fortinet, Inc., Check Point Software Technologies, Broadcom Inc. (VMware vDefend), Hewlett Packard Enterprise Company (Juniper Networks), Sophos Ltd., SonicWall, Trend Micro, and Hillstone Networks.
- Security-function assessment covers Network Security, Traffic Inspection, Access Control, and Threat Prevention.
What does the Virtual Security Appliance Market cover?
Virtual security appliances are deployable software controls used to inspect traffic and apply network security policy inside cloud, private cloud, and virtualized infrastructure.
The Virtual Security Appliance Market covers appliance images and virtual functions used for firewalls, VPN gateways, traffic inspection, access control, and threat prevention. Coverage includes public and private cloud use where the customer places the appliance into a defined traffic path.
What is included in the scope?
Virtual firewall and virtual VPN gateway functions are included where they are bought, licensed, or consumed as deployable appliances.
The scope includes Deployment and Appliance Type alongside Enterprise Size, End User Industry, and Security Function. Coverage spans Public Cloud, AWS, Microsoft Azure, and Private Cloud. Network Security, Traffic Inspection, Access Control, and Threat Prevention are included when delivered through a virtual appliance.
What is excluded from the scope?
Physical hardware appliances and SaaS-only cloud security services remain outside the scope of this market.
The scope excludes managed-service revenue that cannot be separated from the appliance subscription. It also excludes downstream cloud workload revenue and professional services not tied to appliance licensing.
How Was the Analysis Built?
The analysis draws on 120+ sources, 35+ company portfolios, 25+ countries, and more than 20 interviews.
- Primary Research: Interviews with manufacturers, retailers, salon operators, and experts examine purchase priorities, adoption, approval requirements, and competitive positioning.
- Desk Research: Desk research covers government statistics, regulatory publications, company filings, trade data, technical studies, industry associations, standards, and public policy.
- Market Sizing and Forecasting: Estimates combine historical performance, demand indicators, pricing, segment shares, company participation, country growth, adoption patterns, and barriers to expansion.
- Data Validation and Update Cycle: Findings are validated against public data, company activity, regulatory changes, product launches, recalls, and adoption shifts.
Segmentation
What is the report's scope and coverage?
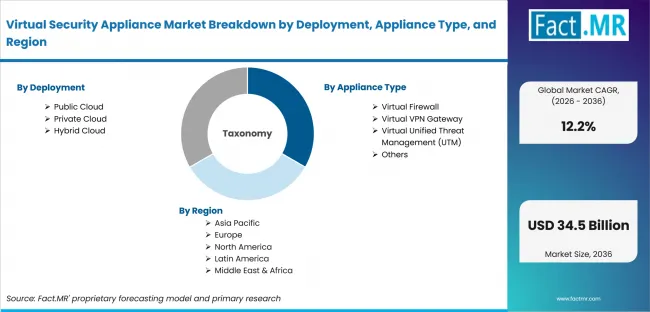
Virtual Security Appliance Market Breakdown By Deployment, Appliance Type, And Region | Source: Fact.MR
| Attribute | Details |
|---|---|
| Quantitative Units | USD billion in 2026 to USD billion by 2036 at CAGR |
| Market Definition | Deployable virtual security appliances used to inspect traffic, enforce access policy, and protect workloads across public cloud, private cloud, hybrid infrastructure, and virtualized network environments |
| Deployment | Public Cloud; AWS; Microsoft Azure; Private Cloud |
| Appliance Type | Virtual Firewall; Next-Generation Firewall; Stateful Firewall; Virtual VPN Gateway |
| Enterprise Size | Large Enterprises; Global Enterprises; Data Centers; Small and Medium Enterprises |
| End User Industry | IT and Telecommunications; Cloud Service Providers; Network Operators; BFSI |
| Security Function | Network Security; Traffic Inspection; Access Control; Threat Prevention |
| Regions Covered | North America; Latin America; Europe; East Asia; South Asia and Pacific; Middle East and Africa |
| Countries Covered | USA; Japan; Germany; UK; Canada; Australia; South Korea |
| Key Companies Profiled | Palo Alto Networks; Cisco Systems; Fortinet, Inc.; Check Point Software Technologies; Broadcom Inc. (VMware vDefend); Hewlett Packard Enterprise Company (Juniper Networks); Sophos Ltd.; SonicWall; Trend Micro; Hillstone Networks |
| Forecast Period | 2026 to 2036 |
Source: Fact.MR analysis. Updated Aug 3, 2026
How is the market segmented?
-
By Deployment
- Public Cloud
- AWS
- Microsoft Azure
- Private Cloud
- Enterprise Private Cloud
- Hosted Infrastructure
- Hybrid Cloud
- Multi-Cloud
- Edge Deployments
- Public Cloud
-
By Appliance Type
- Virtual Firewall
- Next-Generation Firewall
- Stateful Firewall
- Virtual VPN Gateway
- Remote Access VPN
- Site-to-Site VPN
- Virtual Unified Threat Management (UTM)
- Intrusion Prevention
- Web Filtering
- Others
- Web Application Firewall
- Virtual Secure Web Gateway
- Virtual Firewall
-
By Enterprise Size
- Large Enterprises
- Global Enterprises
- Data Centers
- Small & Medium Enterprises
- Small Businesses
- Mid-Sized Enterprises
- Large Enterprises
-
By End User Industry
- IT & Telecommunications
- Cloud Service Providers
- Network Operators
- BFSI
- Banks
- Insurance Companies
- Government & Defense
- Public Sector
- Defense Agencies
- Healthcare
- Hospitals
- Healthcare Networks
- Others
- Retail
- Manufacturing
- Energy & Utilities
- IT & Telecommunications
-
By Security Function
- Network Security
- Traffic Inspection
- Access Control
- Threat Prevention
- Intrusion Prevention
- Malware Protection
- Secure Remote Access
- Zero Trust Access
- VPN Services
- Monitoring & Compliance
- Log Management
- Compliance Reporting
- Network Security
-
By Region
- North America
- Latin America
- Europe
- East Asia
- South Asia and Pacific
- Middle East and Africa
Frequently Asked Questions
Which Deployment leads the market?
Which Appliance Type leads the market?
Which Enterprise Size leads the market?
What is the primary driver in this market?
Who worked on this report


Preview the report firsthand - request a free sample
Free SampleGet the brochure for pricing and purchase details
Download PDF