Whey Cheese Market
Whey Cheese Market Analysis, By Product Type (Ricotta, Brown Cheese, Whey Cream Cheese, Albumin Cheese, and Others), By Source, By Flavor Profile, By Distribution Channel, By End Use, and Region - Market Insights 2025 to 2035.
Ricotta is projected to grow at a CAGR of 7.6%, whereas another segment Brown Cheese is likely to grow at 7.4%. In terms of countries U.S. is projected to grow at 8.0%, followed by Germany at 7.8% and France to grow at 9.1%.
Whey Cheese Market Outlook (2025 to 2035)
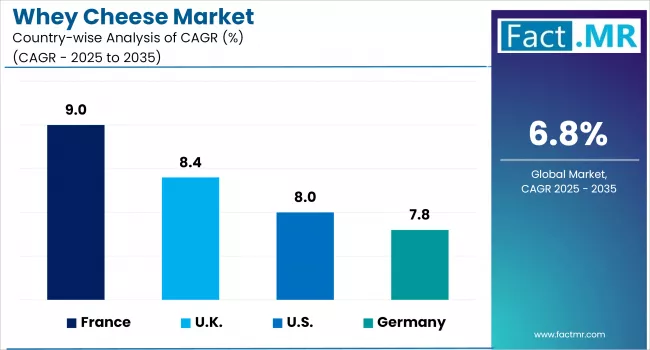
The global whey cheese market is expected to reach USD 21.6 billion by 2035, up from USD 10.5 billion in 2024. During the forecast period 2025 to 2035, the industry is projected to expand at a CAGR of 6.8%.
The increasing demand for high-protein and low-fat dairy alternatives among health-conscious consumers is driving growth in the whey cheese market. Advancement is increasing through the functional applications of food, as well as the diversification of their retail and gastronomic creativity. Its incorporation in spreads, dips and dishes that are HoReCa-compatible enhances its commercial rationale in developed and emerging nutrition-discerning economies.
Quick Stats for Whey Cheese Market
- Value (2025): USD 11.2 Billion
- Projected Value (2035): USD 21.6 Billion
- Forecast CAGR (2025 to 2035): 6.8%
- Leading Segment (2025): Ricotta (37% Market Share)
- Fastest Growing Country (2025): France (9.0% CAGR)
- Top Key Players: Agropur Cooperative, Hilmar Cheese Company, Davisco Foods International, Meggle Group, Glanbia Nutritionals, Lactalis Ingredients, FrieslandCampina.
What are the drivers of the whey cheese market?
The increasing consumer appeal toward functional dairy and clean-label nutrition is supporting the growing presence of whey cheese, both in mainstream and specialty formats.
Conscious consumers are switching from high-fat soft cheeses to ricotta, brown cheese, and albumin cheeses, based on their digestibility, high protein levels, and the wide-ranging culinary versatility of the latter. Urban diet changes and the increasing prevalence of snacking also enhance the relevance of products.
The range of commercial whey cheese production is expanding with advancements in technology, including ultrafiltration, enzymatic coagulation, and the use of fractionated whey. Creating higher-yield and flavor-dense formats has become a relatively easy target for processors; they can now achieve this with nutritional integrity intact.
Higher-end balls that incorporate goat and sheep whey are making their way into niche food markets, due to recent breakthroughs in high-end fermentation accuracy and biothermal safety.
The economic importance of whey cheese is attributed to increased institutional and B2B purchases in the food processing sector, particularly in the bakery, pasta, and ready meals segments.
Frozen and refrigerated entrees are being replaced with ricotta and whey cream cheese, rather than traditional cheese. The trend quickened, as manufacturers are looking at cheaper, protein-rich ingredients with longer shelf-life and controllable logistics.
What are the regional trends of the whey cheese market?
Wellness food trends and innovations on both sides of the private label, along with robust growth in plant-forward, yet protein-rich nutrition, will drive demand for whey cheese in the United States.
There is a dominance of Ricotta in refrigerated dairy spaces, particularly brown cheese, which has become a niche in the foodservice industry. Production is also being up-sized to cater to domestic brands and institutional buyers.
Germany remains the world leader in terms of whey consumption efficiency and heritage cheese production. German producers are developing low-lactose and goat whey cheese products, complemented by strong export ties within Central and Northern European markets. Government-backed R&D accelerators are further driving the development of digitized quality control and batch optimization systems in cheese plants.
France anchors its whey cheese development in culinary tradition while modernizing its applications. French brands are integrating brown and albumin whey cheese into artisan spreads and bakery fillings.
Specialty retail growth and expanded cooperative production capacity, especially in Normandy and Auvergne, are reinforcing France’s export readiness for gourmet dairy categories.
What are the challenges and restraining factors of the whey cheese market?
This high level of moisture in whey cheese poses logistical issues that further underscore the importance of cold chains, resulting in higher costs for exporters. Limited shelf lives, particularly of the non-pasteurized type, such as opening your golden ricotas, inhibit access to transnational markets and make large-scale food service distribution in climate-sensitive areas difficult.
The availability of whey fluctuates, which limits the scalability of production compared to casein cheese, which has a more streamlined production process. The fluctuation in the quality of raw milk across different seasons and the price war with other dairy products disrupts the use of long-term plans for inputs. These are making sourcing pressures worse on both integrated and standalone whey cheese plants.
The global regulation of labeling for whey-based cheeses remains disunified. In Europe, EU regulations on the protection of designations restrict brand extension beyond en-labeling, and even global firms are forced to wait for market entry due to the lack of harmonization of standards in Asia and Latin America. Regulatory requirements of reformulation based on fat and sodium components are also slowing the rate of innovation in many economies.
Country-Wise Insights
The United States Leads with Functional whey cheese Innovation
The U.S. has a central role in the global whey cheese market owing to its ability to integrate dairy mass with the healthy food revolution. There is a robust domestic demand for high-protein, low-fat dairy products, so manufacturers in the U.S. are leading the way in producing ricotta and whey cream cheese. Concentrated and strong dairy cooperatives, as well as investments involving massive retailers in their labels, help to strengthen the sector.
American processors invest substantially in membrane filtration, automation, and the preservation of bioactive ingredients, offering standardized, scalable variants of whey cheese. Whey cheese has gained momentum in sports nutrition and convenience food applications, primarily due to the growing importance of the American food consumer's focus on products with high functionality and label transparency, as well as on diet-friendly protein sources.
The U.S. exports are primarily directed at Canada, Mexico, and Asian countries, where ricotta-based products and protein-enriched cheeses are gaining increasing popularity. USDA-supported food export initiatives and national centers of innovation promise to make the country a leader in the new wave of hybrid dairy protein innovation, which will combine flavor, nutrition, and clean-label confidence in whey-based products.
Germany Champions Precision and Quality in Whey Cheese Processing
The whey cheese industry in Germany is based on milk ethics and quality control. It is a leader in processing efficiency in Europe, and several cooperatives and mid-sized processors have successfully adapted to processing goat and sheep whey. The German manufacturers focus on low-lactose innovation and traceability in fresh and matured whey cheese types.
A technological precision is a fundamental difference. To maintain the complexity of flavor and increase shelf life, German facilities utilize inline moisture sensors, computer-aided batch manufacturing, and cold-chain automation. Energy-efficient processing and sustainability indicators at the plant level, equivalent to those offered by the EU, also demonstrate the country's engineering prowess.
Germany exports high-quality whey cheese in large volumes to the EU and Southeast Asia, catering to both culinary and health applications. It has an operating policy of sourcing locally, partnering with food services, and holding PDO/PGI certifications that authenticate its traditional cheese. Its use of AI in optimizing its yields is also enlarging its production margins, with additional investments increasing over time.
France Blends Tradition and Gourmet Expansion in Whey Cheese
France holds a unique position in the whey cheese market, thanks to its distinctive culinary production style. Variations of Ricotta cheese and albumin are also very popular in regional French diets (Normandy and Rhone-Alpes). The artisanal models are being scaled up to premium, pre-packed products for export markets.
French processors integrate both traditional processes and contemporary food safety infrastructure, using both biothermal stabilisation and vacuum-pack aging in the development of an export-quality end product. Manufacturers are inventing savory flavorings in various forms, as well as customizing them according to different clients, such as high-end restaurants and deli portions, utilizing goat and sheep whey products.
The strategic focus of France is on value addition, provenance, and sustainability. Dairy modernization grants offered by the government help facilities meet global standards for quality and hygiene. France is expanding its presence in Asia, the Middle East, and North America by marketing its whey cheese as a gourmet specialty.
Category-Wise Analysis
Ricotta is the Market's Cornerstone Across Formats and Channels
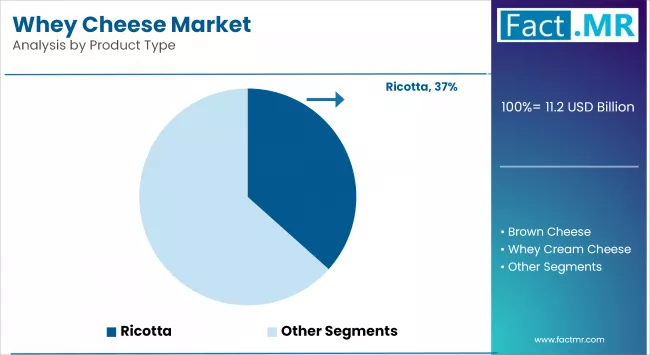
The world market accounts for the majority of whey cheese production, as Ricotta has multifunctional uses in retail, foodservice, and food processing. Ricotta, which is extracted from cow or sheep whey, provides a softer cheese with excellent moisture content that works well as both a savory and sweet food. Its affordability, nutritional value, and versatility as a cooking and baking ingredient have made it a staple in refrigerated dairy sections and frozen meal compositions, both locally and internationally.
Due to an increase in demand for clean-label and protein-enhanced ingredients, the use of ricotta cheese as a filling in pasta, dips, desserts, and bakery products is on the rise. Manufacturers are also producing low-fat and lactose-free products as a way to target diet-specific segments of consumers. The changes in filtering and packaging technology are increasing shelf life, and the resulting ricotta can be scaled to support a more international trade and larger institutional supply chain.
Brown Cheese Gains Ground Through Regional Authenticity and Novelty Appeal
Brown cheese is already a popular cheese type, especially in the Nordic countries. However, it receives more attention around the world due to its caramelized nature and its historically privileged status. Its main ingredient is goat or cow whey, and it is sold as a sweet, firm, and shelf-stable cheese that is perfect for giving as gifts, spreading, and gourmet presentations. The newness of Brown cheese is helping it to hit specialty shops and specially curated food sites.
It is most desirable in the high-quality channels where it is all about realness and authenticity. Norway is the world leader, and artisanal producers in France and Germany are making infused variants such as honey and sea salt. With consumers demanding flavorful experiences that offer special tastes and regional storytelling, brown cheese is emerging as a separate growth segment in the global whey cheese market.
Competitive Analysis
Key players in the whey cheese industry include Agropur Cooperative, Hilmar Cheese Company, Davisco Foods International, Meggle Group, Glanbia Nutritionals, Lactalis Ingredients, FrieslandCampina, Leprino Foods, and DMK Group.
The whey cheese sector is characterized by both heritage-oriented cooperatives and the presence of large dairies in the process of whey valorization. There is increasing competition based on protein concentration, shelf-life stability, and storytelling related to the origin of the products. The growth of private label, especially in ricotta and cream whey types, is observed.
Major players are pursuing differentiation through clean-label reformulation, eco-packaging, and own-brand fermentation technology. The supply-side response is being conditioned by the strategic purchasing of premium-quality whey inputs, as well as investment in B2B-ready foodservice fronts.
Recent Development
- In March 2025, Hilmar Cheese Company inaugurated its $600 billion state-of-the-art plant in Dodge City, Kansas. The facility began converting local milk into 40-lb blocks of American-style cheese and premium whey proteins, creating nearly 250 skilled jobs. With closed-loop water recycling and high-efficiency energy systems, the plant significantly enhanced Hilmar’s production capacity to meet rising global demand for functional dairy ingredients.
- In March 2025, Lactalis Ingredients announced a multi-billion-euro investment at its Mayenne, France, factory to reduce carbon emissions and modernize whey-powder processing. The upgrade included high-efficiency heat-recovery systems, smart water-reuse loops, and a next-generation drying tower, which enhanced throughput while reducing energy consumption. This project reinforced Lactalis’s position as the world’s largest whey supplier and supported its goal of halving greenhouse-gas intensity by 2030.
Fact.MR has provided detailed information about the price points of key manufacturers in the Whey Cheese Market, positioned across regions, including sales growth, production capacity, and speculative technological expansion, as recently published in the report.
Methodology and Industry Tracking Approach
The 2025 whey cheese market report by Fact.MR is based on insights collected from 1,100 stakeholders across 10 countries, with a minimum of 70 respondents per country.
Among the participants, 60% were end users, including dairy processors, foodservice procurement managers, institutional buyers, and nutrition-based CPG brands, while the remaining 40% comprised R&D leads, quality assurance specialists, and export consultants.
Data collection was conducted between June 2024 and May 2025, with a focus on critical parameters, including protein retention efficiency, input-to-yield ratios, shelf life, cross-border logistics readiness, and regulatory certification pathways. A regionally weighted sampling model ensured representation across core markets in North America, Europe, and the Asia Pacific.
The study is informed by over 90 validated sources, including government dairy boards, export databases, manufacturing audit reports, cheese formulation whitepapers, and company filings. Rigorous triangulation was applied to derive accurate forecasts and actionable insights for decision-makers across the whey cheese value chain.
Fact.MR applied rigorous analytical tools such as multivariable regression and scenario modeling to ensure data robustness. With continuous monitoring of the glass adhesives market since 2018, this report provides a comprehensive roadmap for firms seeking a competitive advantage, innovation, and sustainable growth within the sector.
Segmentation of Whey Cheese Market
-
By Source :
- Cow Milk
- Goat Milk
- Sheep Milk
-
By Flavor Profile :
- Sweetened Whey Cheeses
- Unsweetened Whey Cheeses
-
By Distribution Channel :
- Retail
- Supermarkets/Hypermarkets
- Specialty Cheese Stores
- Online Retail
- Food Service
- Retail
-
By End Use :
- Household
- Food Processing Industry
- HoReCa (Hotels, Restaurants, and Cafes)
-
By Region :
- North America
- Latin America
- Western Europe
- Eastern Europe
- East Asia
- South Asia & Pacific
- Middle East & Africa
Table of Content
- Executive Summary
- Global Market Outlook
- Demand-side Trends
- Supply-side Trends
- Technology Roadmap Analysis
- Analysis and Recommendations
- Market Overview
- Market Coverage / Taxonomy
- Market Definition / Scope / Limitations
- Market Background
- Market Dynamics
- Drivers
- Restraints
- Opportunity
- Trends
- Scenario Forecast
- Demand in Optimistic Scenario
- Demand in Likely Scenario
- Demand in Conservative Scenario
- Opportunity Map Analysis
- Product Life Cycle Analysis
- Supply Chain Analysis
- Supply Side Participants and their Roles
- Producers
- Mid-Level Participants (Traders/ Agents/ Brokers)
- Wholesalers and Distributors
- Value Added and Value Created at Node in the Supply Chain
- List of Raw Materials Suppliers
- List of Existing and Potential Buyers
- Supply Side Participants and their Roles
- Investment Feasibility Matrix
- Value Chain Analysis
- Profit Margin Analysis
- Wholesalers and Distributors
- Retailers
- PESTLE and Porter’s Analysis
- Regulatory Landscape
- By Key Regions
- By Key Countries
- Production and Consumption Statistics
- Import and Export Statistics
- Market Dynamics
- Global Market Analysis 2020-2024 and Forecast, 2025-2035
- Historical Market Size Value (USD Bn) & Volume (Tons) Analysis, 2020-2024
- Current and Future Market Size Value (USD Bn) & Volume (Tons) Projections, 2025-2035
- Y-o-Y Growth Trend Analysis
- Absolute $ Opportunity Analysis
- Global Market Pricing Analysis 2020-2024 and Forecast 2025-2035
- Global Market Analysis 2020-2024 and Forecast 2025-2035, By Product Type
- Introduction / Key Findings
- Historical Market Size Value (USD Bn) & Volume (Tons) Analysis By Product Type, 2020-2024
- Current and Future Market Size Value (USD Bn) & Volume (Tons) Analysis and Forecast By Product Type, 2025-2035
- Ricotta
- Brown Cheese
- Whey Cream Cheese
- Albumin Cheese
- Others
- Y-o-Y Growth Trend Analysis By Product Type, 2020-2024
- Absolute $ Opportunity Analysis By Product Type, 2025-2035
- Global Market Analysis 2020-2024 and Forecast 2025-2035, By Source
- Introduction / Key Findings
- Historical Market Size Value (USD Bn) & Volume (Tons) Analysis By Source, 2020-2024
- Current and Future Market Size Value (USD Bn) & Volume (Tons) Analysis and Forecast By Source, 2025-2035
- Cow Milk
- Goat Milk
- Sheep Milk
- Y-o-Y Growth Trend Analysis By Source, 2020-2024
- Absolute $ Opportunity Analysis By Source, 2025-2035
- Global Market Analysis 2020-2024 and Forecast 2025-2035, By Flavor Profile
- Introduction / Key Findings
- Historical Market Size Value (USD Bn) & Volume (Tons) Analysis By Flavor Profile, 2020-2024
- Current and Future Market Size Value (USD Bn) & Volume (Tons) Analysis and Forecast By Flavor Profile, 2025-2035
- Sweetened Whey Cheeses
- Unsweetened Whey Cheeses
- Y-o-Y Growth Trend Analysis By Flavor Profile, 2020-2024
- Absolute $ Opportunity Analysis By Flavor Profile, 2025-2035
- Global Market Analysis 2020-2024 and Forecast 2025-2035, By Distribution Channel
- Introduction / Key Findings
- Historical Market Size Value (USD Bn) & Volume (Tons) Analysis By Distribution Channel, 2020-2024
- Current and Future Market Size Value (USD Bn) & Volume (Tons) Analysis and Forecast By Distribution Channel, 2025-2035
- Retail
- Supermarkets/Hypermarkets
- Specialty Cheese Stores
- Online Retail
- Food Service
- Y-o-Y Growth Trend Analysis By Distribution Channel, 2020-2024
- Absolute $ Opportunity Analysis By Distribution Channel, 2025-2035
- Global Market Analysis 2020-2024 and Forecast 2025-2035, By End Use
- Introduction / Key Findings
- Historical Market Size Value (USD Bn) & Volume (Tons) Analysis By End Use, 2020-2024
- Current and Future Market Size Value (USD Bn) & Volume (Tons) Analysis and Forecast By End Use, 2025-2035
- Household
- Food Processing Industry
- HoReCa
- Y-o-Y Growth Trend Analysis By End Use, 2020-2024
- Absolute $ Opportunity Analysis By End Use, 2025-2035
- Global Market Analysis 2020-2024 and Forecast 2025-2035, By Region
- Introduction
- Historical Market Size Value (USD Bn) & Volume (Tons) Analysis By Region, 2020-2024
- Current Market Size Value (USD Bn) & Volume (Tons) Analysis and Forecast By Region, 2025-2035
- North America
- Latin America
- Western Europe
- East Asia
- South Asia Pacific
- Eastern Europe
- Middle East & Africa
- Market Attractiveness Analysis By Region
- North America Market Analysis 2020-2024 and Forecast 2025-2035, By Country
- Historical Market Size Value (USD Bn) & Volume (Tons) Trend Analysis By Market Taxonomy, 2020-2024
- Market Size Value (USD Bn) & Volume (Tons) Forecast By Market Taxonomy, 2025-2035
- By Country
- U.S.
- Canada
- Mexico
- By Product Type
- By Source
- By Flavor Profile
- By Distribution Channel
- By End Use
- By Country
- Market Attractiveness Analysis
- By Country
- By Product Type
- By Source
- By Flavor Profile
- By Distribution Channel
- By End Use
- Key Takeaways
- Latin America Market Analysis 2020-2024 and Forecast 2025-2035, By Country
- Historical Market Size Value (USD Bn) & Volume (Tons) Trend Analysis By Market Taxonomy, 2020-2024
- Market Size Value (USD Bn) & Volume (Tons) Forecast By Market Taxonomy, 2025-2035
- By Country
- Brazil
- Chile
- Rest of Latin America
- By Product Type
- By Source
- By Flavor Profile
- By Distribution Channel
- By End Use
- By Country
- Market Attractiveness Analysis
- By Country
- By Product Type
- By Source
- By Flavor Profile
- By Distribution Channel
- By End Use
- Key Takeaways
- Western Europe Market Analysis 2020-2024 and Forecast 2025-2035, By Country
- Historical Market Size Value (USD Bn) & Volume (Tons) Trend Analysis By Market Taxonomy, 2020-2024
- Market Size Value (USD Bn) & Volume (Tons) Forecast By Market Taxonomy, 2025-2035
- By Country
- Germany
- Italy
- France
- U.K.
- Spain
- Russia
- BENELUX
- Rest of Europe
- By Product Type
- By Source
- By Flavor Profile
- By Distribution Channel
- By End Use
- By Country
- Market Attractiveness Analysis
- By Country
- By Product Type
- By Source
- By Flavor Profile
- By Distribution Channel
- By End Use
- Key Takeaways
- East Asia Market Analysis 2020-2024 and Forecast 2025-2035, By Country
- Historical Market Size Value (USD Bn) & Volume (Tons) Trend Analysis By Market Taxonomy, 2020-2024
- Market Size Value (USD Bn) & Volume (Tons) Forecast By Market Taxonomy, 2025-2035
- By Country
- China
- Japan
- South Korea
- By Product Type
- By Source
- By Flavor Profile
- By Distribution Channel
- By End Use
- By Country
- Market Attractiveness Analysis
- By Country
- By Product Type
- By Source
- By Flavor Profile
- By Distribution Channel
- By End Use
- Key Takeaways
- South Asia Pacific Market Analysis 2020-2024 and Forecast 2025-2035, By Country
- Historical Market Size Value (USD Bn) & Volume (Tons) Trend Analysis By Market Taxonomy, 2020-2024
- Market Size Value (USD Bn) & Volume (Tons) Forecast By Market Taxonomy, 2025-2035
- By Country
- India
- ASEAN Countries
- Australia & New Zealand
- Rest of South Asia Pacific
- By Product Type
- By Source
- By Flavor Profile
- By Distribution Channel
- By End Use
- By Country
- Market Attractiveness Analysis
- By Country
- By Product Type
- By Source
- By Flavor Profile
- By Distribution Channel
- By End Use
- Key Takeaways
- Eastern Europe Market Analysis 2020-2024 and Forecast 2025-2035, By Country
- Historical Market Size Value (USD Bn) & Volume (Tons) Trend Analysis By Market Taxonomy, 2020-2024
- Market Size Value (USD Bn) & Volume (Tons) Forecast By Market Taxonomy, 2025-2035
- By Country
- Russia
- Poland
- Hungary
- Balkan & Baltics
- Rest of Eastern Europe
- By Product Type
- By Source
- By Flavor Profile
- By Distribution Channel
- By End Use
- By Country
- Market Attractiveness Analysis
- By Country
- By Product Type
- By Source
- By Flavor Profile
- By Distribution Channel
- By End Use
- Key Takeaways
- Middle East & Africa Market Analysis 2020-2024 and Forecast 2025-2035, By Country
- Historical Market Size Value (USD Bn) & Volume (Tons) Trend Analysis By Market Taxonomy, 2020-2024
- Market Size Value (USD Bn) & Volume (Tons) Forecast By Market Taxonomy, 2025-2035
- By Country
- KSA
- Other GCC Countries
- Turkiye
- South Africa
- Rest of MEA
- By Product Type
- By Source
- By Flavor Profile
- By Distribution Channel
- By End Use
- By Country
- Market Attractiveness Analysis
- By Country
- By Product Type
- By Source
- By Flavor Profile
- By Distribution Channel
- By End Use
- Key Takeaways
- Key Countries Market Analysis
- Value (USD Bn) & Volume (Tons)ed States
- Pricing Analysis
- Market Share Analysis, 2024
- By Product Type
- By Source
- By Flavor Profile
- By Distribution Channel
- By End Use
- Germany
- Pricing Analysis
- Market Share Analysis, 2024
- By Product Type
- By Source
- By Flavor Profile
- By Distribution Channel
- By End Use
- France
- Pricing Analysis
- Market Share Analysis, 2024
- By Product Type
- By Source
- By Flavor Profile
- By Distribution Channel
- By End Use
- Italy
- Pricing Analysis
- Market Share Analysis, 2024
- By Product Type
- By Source
- By Flavor Profile
- By Distribution Channel
- By End Use
- Value (USD Bn) & Volume (Tons)ed Kingdoms
- Pricing Analysis
- Market Share Analysis, 2024
- By Product Type
- By Source
- By Flavor Profile
- By Distribution Channel
- By End Use
- Value (USD Bn) & Volume (Tons)ed States
- Market Structure Analysis
- Competition Dashboard
- Competition Benchmarking
- Market Share Analysis of Top Players
- By Regional
- By Product Type
- By Source
- By Flavor Profile
- By Distribution Channel
- By End Use
- Competition Analysis
- Competition Deep Dive
- Agropur Cooperative
- Overview
- Product Portfolio
- Profitability by Market Segments (Product/Age /Sales Channel/Region)
- Sales Footprint
- Strategy Overview
- Marketing Strategy
- Product Strategy
- Channel Strategy
- Hilmar Cheese Company
- Overview
- Product Portfolio
- Profitability by Market Segments (Product/Age /Sales Channel/Region)
- Sales Footprint
- Strategy Overview
- Marketing Strategy
- Product Strategy
- Channel Strategy
- Davisco Foods International
- Overview
- Product Portfolio
- Profitability by Market Segments (Product/Age /Sales Channel/Region)
- Sales Footprint
- Strategy Overview
- Marketing Strategy
- Product Strategy
- Channel Strategy
- Meggle Group
- Overview
- Product Portfolio
- Profitability by Market Segments (Product/Age /Sales Channel/Region)
- Sales Footprint
- Strategy Overview
- Marketing Strategy
- Product Strategy
- Channel Strategy
- Glanbia Nutritionals
- Overview
- Product Portfolio
- Profitability by Market Segments (Product/Age /Sales Channel/Region)
- Sales Footprint
- Strategy Overview
- Marketing Strategy
- Product Strategy
- Channel Strategy
- Lactalis Ingredients
- Overview
- Product Portfolio
- Profitability by Market Segments (Product/Age /Sales Channel/Region)
- Sales Footprint
- Strategy Overview
- Marketing Strategy
- Product Strategy
- Channel Strategy
- FrieslandCampina
- Overview
- Product Portfolio
- Profitability by Market Segments (Product/Age /Sales Channel/Region)
- Sales Footprint
- Strategy Overview
- Marketing Strategy
- Product Strategy
- Channel Strategy
- Leprino Foods
- Overview
- Product Portfolio
- Profitability by Market Segments (Product/Age /Sales Channel/Region)
- Sales Footprint
- Strategy Overview
- Marketing Strategy
- Product Strategy
- Channel Strategy
- DMK Group
- Overview
- Product Portfolio
- Profitability by Market Segments (Product/Age /Sales Channel/Region)
- Sales Footprint
- Strategy Overview
- Marketing Strategy
- Product Strategy
- Channel Strategy
- Saputo Inc.
- Overview
- Product Portfolio
- Profitability by Market Segments (Product/Age /Sales Channel/Region)
- Sales Footprint
- Strategy Overview
- Marketing Strategy
- Product Strategy
- Channel Strategy
- Agropur Cooperative
- Competition Deep Dive
- Assumptions & Acronyms Used
- Research Methodology
List Of Table
- Table 1: Global Market Value (USD Bn) Forecast by Region, 2020 to 2035
- Table 2: Global Market Volume (Tons) Forecast by Region, 2020 to 2035
- Table 3: Global Market Value (USD Bn) Forecast by Product Type, 2020 to 2035
- Table 4: Global Market Volume (Tons) Forecast by Product Type, 2020 to 2035
- Table 5: Global Market Value (USD Bn) Forecast by Source, 2020 to 2035
- Table 6: Global Market Volume (Tons) Forecast by Source, 2020 to 2035
- Table 7: Global Market Value (USD Bn) Forecast by Flavor Profile, 2020 to 2035
- Table 8: Global Market Volume (Tons) Forecast by Flavor Profile, 2020 to 2035
- Table 9: Global Market Value (USD Bn) Forecast by Distribution Channel, 2020 to 2035
- Table 10: Global Market Volume (Tons) Forecast by Distribution Channel, 2020 to 2035
- Table 11: Global Market Value (USD Bn) Forecast by End Use, 2020 to 2035
- Table 12: Global Market Volume (Tons) Forecast by End Use, 2020 to 2035
- Table 13: North America Market Value (USD Bn) Forecast by Country, 2020 to 2035
- Table 14: North America Market Volume (Tons) Forecast by Country, 2020 to 2035
- Table 15: North America Market Value (USD Bn) Forecast by Product Type, 2020 to 2035
- Table 16: North America Market Volume (Tons) Forecast by Product Type, 2020 to 2035
- Table 17: North America Market Value (USD Bn) Forecast by Source, 2020 to 2035
- Table 18: North America Market Volume (Tons) Forecast by Source, 2020 to 2035
- Table 19: North America Market Value (USD Bn) Forecast by Flavor Profile, 2020 to 2035
- Table 20: North America Market Volume (Tons) Forecast by Flavor Profile, 2020 to 2035
- Table 21: North America Market Value (USD Bn) Forecast by Distribution Channel, 2020 to 2035
- Table 22: North America Market Volume (Tons) Forecast by Distribution Channel, 2020 to 2035
- Table 23: North America Market Value (USD Bn) Forecast by End Use, 2020 to 2035
- Table 24: North America Market Volume (Tons) Forecast by End Use, 2020 to 2035
- Table 25: Latin America Market Value (USD Bn) Forecast by Country, 2020 to 2035
- Table 26: Latin America Market Volume (Tons) Forecast by Country, 2020 to 2035
- Table 27: Latin America Market Value (USD Bn) Forecast by Product Type, 2020 to 2035
- Table 28: Latin America Market Volume (Tons) Forecast by Product Type, 2020 to 2035
- Table 29: Latin America Market Value (USD Bn) Forecast by Source, 2020 to 2035
- Table 30: Latin America Market Volume (Tons) Forecast by Source, 2020 to 2035
- Table 31: Latin America Market Value (USD Bn) Forecast by Flavor Profile, 2020 to 2035
- Table 32: Latin America Market Volume (Tons) Forecast by Flavor Profile, 2020 to 2035
- Table 33: Latin America Market Value (USD Bn) Forecast by Distribution Channel, 2020 to 2035
- Table 34: Latin America Market Volume (Tons) Forecast by Distribution Channel, 2020 to 2035
- Table 35: Latin America Market Value (USD Bn) Forecast by End Use, 2020 to 2035
- Table 36: Latin America Market Volume (Tons) Forecast by End Use, 2020 to 2035
- Table 37: Western Europe Market Value (USD Bn) Forecast by Country, 2020 to 2035
- Table 38: Western Europe Market Volume (Tons) Forecast by Country, 2020 to 2035
- Table 39: Western Europe Market Value (USD Bn) Forecast by Product Type, 2020 to 2035
- Table 40: Western Europe Market Volume (Tons) Forecast by Product Type, 2020 to 2035
- Table 41: Western Europe Market Value (USD Bn) Forecast by Source, 2020 to 2035
- Table 42: Western Europe Market Volume (Tons) Forecast by Source, 2020 to 2035
- Table 43: Western Europe Market Value (USD Bn) Forecast by Flavor Profile, 2020 to 2035
- Table 44: Western Europe Market Volume (Tons) Forecast by Flavor Profile, 2020 to 2035
- Table 45: Western Europe Market Value (USD Bn) Forecast by Distribution Channel, 2020 to 2035
- Table 46: Western Europe Market Volume (Tons) Forecast by Distribution Channel, 2020 to 2035
- Table 47: Western Europe Market Value (USD Bn) Forecast by End Use, 2020 to 2035
- Table 48: Western Europe Market Volume (Tons) Forecast by End Use, 2020 to 2035
- Table 49: East Asia Market Value (USD Bn) Forecast by Country, 2020 to 2035
- Table 50: East Asia Market Volume (Tons) Forecast by Country, 2020 to 2035
- Table 51: East Asia Market Value (USD Bn) Forecast by Product Type, 2020 to 2035
- Table 52: East Asia Market Volume (Tons) Forecast by Product Type, 2020 to 2035
- Table 53: East Asia Market Value (USD Bn) Forecast by Source, 2020 to 2035
- Table 54: East Asia Market Volume (Tons) Forecast by Source, 2020 to 2035
- Table 55: East Asia Market Value (USD Bn) Forecast by Flavor Profile, 2020 to 2035
- Table 56: East Asia Market Volume (Tons) Forecast by Flavor Profile, 2020 to 2035
- Table 57: East Asia Market Value (USD Bn) Forecast by Distribution Channel, 2020 to 2035
- Table 58: East Asia Market Volume (Tons) Forecast by Distribution Channel, 2020 to 2035
- Table 59: East Asia Market Value (USD Bn) Forecast by End Use, 2020 to 2035
- Table 60: East Asia Market Volume (Tons) Forecast by End Use, 2020 to 2035
- Table 61: South Asia Pacific Market Value (USD Bn) Forecast by Country, 2020 to 2035
- Table 62: South Asia Pacific Market Volume (Tons) Forecast by Country, 2020 to 2035
- Table 63: South Asia Pacific Market Value (USD Bn) Forecast by Product Type, 2020 to 2035
- Table 64: South Asia Pacific Market Volume (Tons) Forecast by Product Type, 2020 to 2035
- Table 65: South Asia Pacific Market Value (USD Bn) Forecast by Source, 2020 to 2035
- Table 66: South Asia Pacific Market Volume (Tons) Forecast by Source, 2020 to 2035
- Table 67: South Asia Pacific Market Value (USD Bn) Forecast by Flavor Profile, 2020 to 2035
- Table 68: South Asia Pacific Market Volume (Tons) Forecast by Flavor Profile, 2020 to 2035
- Table 69: South Asia Pacific Market Value (USD Bn) Forecast by Distribution Channel, 2020 to 2035
- Table 70: South Asia Pacific Market Volume (Tons) Forecast by Distribution Channel, 2020 to 2035
- Table 71: South Asia Pacific Market Value (USD Bn) Forecast by End Use, 2020 to 2035
- Table 72: South Asia Pacific Market Volume (Tons) Forecast by End Use, 2020 to 2035
- Table 73: Eastern Europe Market Value (USD Bn) Forecast by Country, 2020 to 2035
- Table 74: Eastern Europe Market Volume (Tons) Forecast by Country, 2020 to 2035
- Table 75: Eastern Europe Market Value (USD Bn) Forecast by Product Type, 2020 to 2035
- Table 76: Eastern Europe Market Volume (Tons) Forecast by Product Type, 2020 to 2035
- Table 77: Eastern Europe Market Value (USD Bn) Forecast by Source, 2020 to 2035
- Table 78: Eastern Europe Market Volume (Tons) Forecast by Source, 2020 to 2035
- Table 79: Eastern Europe Market Value (USD Bn) Forecast by Flavor Profile, 2020 to 2035
- Table 80: Eastern Europe Market Volume (Tons) Forecast by Flavor Profile, 2020 to 2035
- Table 81: Eastern Europe Market Value (USD Bn) Forecast by Distribution Channel, 2020 to 2035
- Table 82: Eastern Europe Market Volume (Tons) Forecast by Distribution Channel, 2020 to 2035
- Table 83: Eastern Europe Market Value (USD Bn) Forecast by End Use, 2020 to 2035
- Table 84: Eastern Europe Market Volume (Tons) Forecast by End Use, 2020 to 2035
- Table 85: Middle East & Africa Market Value (USD Bn) Forecast by Country, 2020 to 2035
- Table 86: Middle East & Africa Market Volume (Tons) Forecast by Country, 2020 to 2035
- Table 87: Middle East & Africa Market Value (USD Bn) Forecast by Product Type, 2020 to 2035
- Table 88: Middle East & Africa Market Volume (Tons) Forecast by Product Type, 2020 to 2035
- Table 89: Middle East & Africa Market Value (USD Bn) Forecast by Source, 2020 to 2035
- Table 90: Middle East & Africa Market Volume (Tons) Forecast by Source, 2020 to 2035
- Table 91: Middle East & Africa Market Value (USD Bn) Forecast by Flavor Profile, 2020 to 2035
- Table 92: Middle East & Africa Market Volume (Tons) Forecast by Flavor Profile, 2020 to 2035
- Table 93: Middle East & Africa Market Value (USD Bn) Forecast by Distribution Channel, 2020 to 2035
- Table 94: Middle East & Africa Market Volume (Tons) Forecast by Distribution Channel, 2020 to 2035
- Table 95: Middle East & Africa Market Value (USD Bn) Forecast by End Use, 2020 to 2035
- Table 96: Middle East & Africa Market Volume (Tons) Forecast by End Use, 2020 to 2035
List Of Figures
- Figure 1: Global Market Volume (Tons) Forecast 2020 to 2035
- Figure 2: Global Market Pricing Analysis
- Figure 3: Global Market Value (USD Bn) Forecast 2020 to 2035
- Figure 4: Global Market Value Share and BPS Analysis by Product Type, 2025 to 2035
- Figure 5: Global Market Y-o-Y Growth Comparison by Product Type, 2025 to 2035
- Figure 6: Global Market Attractiveness Analysis by Product Type
- Figure 7: Global Market Value Share and BPS Analysis by Source, 2025 to 2035
- Figure 8: Global Market Y-o-Y Growth Comparison by Source, 2025 to 2035
- Figure 9: Global Market Attractiveness Analysis by Source
- Figure 10: Global Market Value Share and BPS Analysis by Flavor Profile, 2025 to 2035
- Figure 11: Global Market Y-o-Y Growth Comparison by Flavor Profile, 2025 to 2035
- Figure 12: Global Market Attractiveness Analysis by Flavor Profile
- Figure 13: Global Market Value Share and BPS Analysis by Distribution Channel, 2025 to 2035
- Figure 14: Global Market Y-o-Y Growth Comparison by Distribution Channel, 2025 to 2035
- Figure 15: Global Market Attractiveness Analysis by Distribution Channel
- Figure 16: Global Market Value Share and BPS Analysis by End Use, 2025 to 2035
- Figure 17: Global Market Y-o-Y Growth Comparison by End Use, 2025 to 2035
- Figure 18: Global Market Attractiveness Analysis by End Use
- Figure 19: Global Market Value (USD Bn) Share and BPS Analysis by Region, 2025 to 2035
- Figure 20: Global Market Y-o-Y Growth Comparison by Region, 2025 to 2035
- Figure 21: Global Market Attractiveness Analysis by Region
- Figure 22: North America Market Incremental $ Opportunity, 2025 to 2035
- Figure 23: Latin America Market Incremental $ Opportunity, 2025 to 2035
- Figure 24: Western Europe Market Incremental $ Opportunity, 2025 to 2035
- Figure 25: East Asia Market Incremental $ Opportunity, 2025 to 2035
- Figure 26: South Asia Pacific Market Incremental $ Opportunity, 2025 to 2035
- Figure 27: Eastern Europe Market Incremental $ Opportunity, 2025 to 2035
- Figure 28: Middle East & Africa Market Incremental $ Opportunity, 2025 to 2035
- Figure 29: North America Market Value Share and BPS Analysis by Country, 2025 to 2035
- Figure 30: North America Market Value Share and BPS Analysis by Product Type, 2025 to 2035
- Figure 31: North America Market Y-o-Y Growth Comparison by Product Type, 2025 to 2035
- Figure 32: North America Market Attractiveness Analysis by Product Type
- Figure 33: North America Market Value Share and BPS Analysis by Source, 2025 to 2035
- Figure 34: North America Market Y-o-Y Growth Comparison by Source, 2025 to 2035
- Figure 35: North America Market Attractiveness Analysis by Source
- Figure 36: North America Market Value Share and BPS Analysis by Flavor Profile, 2025 to 2035
- Figure 37: North America Market Y-o-Y Growth Comparison by Flavor Profile, 2025 to 2035
- Figure 38: North America Market Attractiveness Analysis by Flavor Profile
- Figure 39: North America Market Value Share and BPS Analysis by Distribution Channel, 2025 to 2035
- Figure 40: North America Market Y-o-Y Growth Comparison by Distribution Channel, 2025 to 2035
- Figure 41: North America Market Attractiveness Analysis by Distribution Channel
- Figure 42: North America Market Value Share and BPS Analysis by End Use, 2025 to 2035
- Figure 43: North America Market Y-o-Y Growth Comparison by End Use, 2025 to 2035
- Figure 44: North America Market Attractiveness Analysis by End Use
- Figure 45: Latin America Market Value Share and BPS Analysis by Country, 2025 to 2035
- Figure 46: Latin America Market Value Share and BPS Analysis by Product Type, 2025 to 2035
- Figure 47: Latin America Market Y-o-Y Growth Comparison by Product Type, 2025 to 2035
- Figure 48: Latin America Market Attractiveness Analysis by Product Type
- Figure 49: Latin America Market Value Share and BPS Analysis by Source, 2025 to 2035
- Figure 50: Latin America Market Y-o-Y Growth Comparison by Source, 2025 to 2035
- Figure 51: Latin America Market Attractiveness Analysis by Source
- Figure 52: Latin America Market Value Share and BPS Analysis by Flavor Profile, 2025 to 2035
- Figure 53: Latin America Market Y-o-Y Growth Comparison by Flavor Profile, 2025 to 2035
- Figure 54: Latin America Market Attractiveness Analysis by Flavor Profile
- Figure 55: Latin America Market Value Share and BPS Analysis by Distribution Channel, 2025 to 2035
- Figure 56: Latin America Market Y-o-Y Growth Comparison by Distribution Channel, 2025 to 2035
- Figure 57: Latin America Market Attractiveness Analysis by Distribution Channel
- Figure 58: Latin America Market Value Share and BPS Analysis by End Use, 2025 to 2035
- Figure 59: Latin America Market Y-o-Y Growth Comparison by End Use, 2025 to 2035
- Figure 60: Latin America Market Attractiveness Analysis by End Use
- Figure 61: Western Europe Market Value Share and BPS Analysis by Country, 2025 to 2035
- Figure 62: Western Europe Market Value Share and BPS Analysis by Product Type, 2025 to 2035
- Figure 63: Western Europe Market Y-o-Y Growth Comparison by Product Type, 2025 to 2035
- Figure 64: Western Europe Market Attractiveness Analysis by Product Type
- Figure 65: Western Europe Market Value Share and BPS Analysis by Source, 2025 to 2035
- Figure 66: Western Europe Market Y-o-Y Growth Comparison by Source, 2025 to 2035
- Figure 67: Western Europe Market Attractiveness Analysis by Source
- Figure 68: Western Europe Market Value Share and BPS Analysis by Flavor Profile, 2025 to 2035
- Figure 69: Western Europe Market Y-o-Y Growth Comparison by Flavor Profile, 2025 to 2035
- Figure 70: Western Europe Market Attractiveness Analysis by Flavor Profile
- Figure 71: Western Europe Market Value Share and BPS Analysis by Distribution Channel, 2025 to 2035
- Figure 72: Western Europe Market Y-o-Y Growth Comparison by Distribution Channel, 2025 to 2035
- Figure 73: Western Europe Market Attractiveness Analysis by Distribution Channel
- Figure 74: Western Europe Market Value Share and BPS Analysis by End Use, 2025 to 2035
- Figure 75: Western Europe Market Y-o-Y Growth Comparison by End Use, 2025 to 2035
- Figure 76: Western Europe Market Attractiveness Analysis by End Use
- Figure 77: East Asia Market Value Share and BPS Analysis by Country, 2025 to 2035
- Figure 78: East Asia Market Value Share and BPS Analysis by Product Type, 2025 to 2035
- Figure 79: East Asia Market Y-o-Y Growth Comparison by Product Type, 2025 to 2035
- Figure 80: East Asia Market Attractiveness Analysis by Product Type
- Figure 81: East Asia Market Value Share and BPS Analysis by Source, 2025 to 2035
- Figure 82: East Asia Market Y-o-Y Growth Comparison by Source, 2025 to 2035
- Figure 83: East Asia Market Attractiveness Analysis by Source
- Figure 84: East Asia Market Value Share and BPS Analysis by Flavor Profile, 2025 to 2035
- Figure 85: East Asia Market Y-o-Y Growth Comparison by Flavor Profile, 2025 to 2035
- Figure 86: East Asia Market Attractiveness Analysis by Flavor Profile
- Figure 87: East Asia Market Value Share and BPS Analysis by Distribution Channel, 2025 to 2035
- Figure 88: East Asia Market Y-o-Y Growth Comparison by Distribution Channel, 2025 to 2035
- Figure 89: East Asia Market Attractiveness Analysis by Distribution Channel
- Figure 90: East Asia Market Value Share and BPS Analysis by End Use, 2025 to 2035
- Figure 91: East Asia Market Y-o-Y Growth Comparison by End Use, 2025 to 2035
- Figure 92: East Asia Market Attractiveness Analysis by End Use
- Figure 93: South Asia Pacific Market Value Share and BPS Analysis by Country, 2025 to 2035
- Figure 94: South Asia Pacific Market Value Share and BPS Analysis by Product Type, 2025 to 2035
- Figure 95: South Asia Pacific Market Y-o-Y Growth Comparison by Product Type, 2025 to 2035
- Figure 96: South Asia Pacific Market Attractiveness Analysis by Product Type
- Figure 97: South Asia Pacific Market Value Share and BPS Analysis by Source, 2025 to 2035
- Figure 98: South Asia Pacific Market Y-o-Y Growth Comparison by Source, 2025 to 2035
- Figure 99: South Asia Pacific Market Attractiveness Analysis by Source
- Figure 100: South Asia Pacific Market Value Share and BPS Analysis by Flavor Profile, 2025 to 2035
- Figure 101: South Asia Pacific Market Y-o-Y Growth Comparison by Flavor Profile, 2025 to 2035
- Figure 102: South Asia Pacific Market Attractiveness Analysis by Flavor Profile
- Figure 103: South Asia Pacific Market Value Share and BPS Analysis by Distribution Channel, 2025 to 2035
- Figure 104: South Asia Pacific Market Y-o-Y Growth Comparison by Distribution Channel, 2025 to 2035
- Figure 105: South Asia Pacific Market Attractiveness Analysis by Distribution Channel
- Figure 106: South Asia Pacific Market Value Share and BPS Analysis by End Use, 2025 to 2035
- Figure 107: South Asia Pacific Market Y-o-Y Growth Comparison by End Use, 2025 to 2035
- Figure 108: South Asia Pacific Market Attractiveness Analysis by End Use
- Figure 109: Eastern Europe Market Value Share and BPS Analysis by Country, 2025 to 2035
- Figure 110: Eastern Europe Market Value Share and BPS Analysis by Product Type, 2025 to 2035
- Figure 111: Eastern Europe Market Y-o-Y Growth Comparison by Product Type, 2025 to 2035
- Figure 112: Eastern Europe Market Attractiveness Analysis by Product Type
- Figure 113: Eastern Europe Market Value Share and BPS Analysis by Source, 2025 to 2035
- Figure 114: Eastern Europe Market Y-o-Y Growth Comparison by Source, 2025 to 2035
- Figure 115: Eastern Europe Market Attractiveness Analysis by Source
- Figure 116: Eastern Europe Market Value Share and BPS Analysis by Flavor Profile, 2025 to 2035
- Figure 117: Eastern Europe Market Y-o-Y Growth Comparison by Flavor Profile, 2025 to 2035
- Figure 118: Eastern Europe Market Attractiveness Analysis by Flavor Profile
- Figure 119: Eastern Europe Market Value Share and BPS Analysis by Distribution Channel, 2025 to 2035
- Figure 120: Eastern Europe Market Y-o-Y Growth Comparison by Distribution Channel, 2025 to 2035
- Figure 121: Eastern Europe Market Attractiveness Analysis by Distribution Channel
- Figure 122: Eastern Europe Market Value Share and BPS Analysis by End Use, 2025 to 2035
- Figure 123: Eastern Europe Market Y-o-Y Growth Comparison by End Use, 2025 to 2035
- Figure 124: Eastern Europe Market Attractiveness Analysis by End Use
- Figure 125: Middle East & Africa Market Value Share and BPS Analysis by Country, 2025 to 2035
- Figure 126: Middle East & Africa Market Value Share and BPS Analysis by Product Type, 2025 to 2035
- Figure 127: Middle East & Africa Market Y-o-Y Growth Comparison by Product Type, 2025 to 2035
- Figure 128: Middle East & Africa Market Attractiveness Analysis by Product Type
- Figure 129: Middle East & Africa Market Value Share and BPS Analysis by Source, 2025 to 2035
- Figure 130: Middle East & Africa Market Y-o-Y Growth Comparison by Source, 2025 to 2035
- Figure 131: Middle East & Africa Market Attractiveness Analysis by Source
- Figure 132: Middle East & Africa Market Value Share and BPS Analysis by Flavor Profile, 2025 to 2035
- Figure 133: Middle East & Africa Market Y-o-Y Growth Comparison by Flavor Profile, 2025 to 2035
- Figure 134: Middle East & Africa Market Attractiveness Analysis by Flavor Profile
- Figure 135: Middle East & Africa Market Value Share and BPS Analysis by Distribution Channel, 2025 to 2035
- Figure 136: Middle East & Africa Market Y-o-Y Growth Comparison by Distribution Channel, 2025 to 2035
- Figure 137: Middle East & Africa Market Attractiveness Analysis by Distribution Channel
- Figure 138: Middle East & Africa Market Value Share and BPS Analysis by End Use, 2025 to 2035
- Figure 139: Middle East & Africa Market Y-o-Y Growth Comparison by End Use, 2025 to 2035
- Figure 140: Middle East & Africa Market Attractiveness Analysis by End Use
- Figure 141: Global Market -Tier Structure Analysis
- Figure 142: Global Market - Company Share Analysis
- FAQs -
What was the Global Whey Cheese Market Size Reported by Fact.MR for 2025?
The global whey cheese market was valued at USD 11.2 billion in 2025.
Who are the Major Players Operating in the Whey Cheese Market?
Prominent players in the market are Agropur Cooperative, Hilmar Cheese Company, Davisco Foods International, among others.
What is the Estimated Valuation of the Whey Cheese Market in 2035?
The market is expected to reach a valuation of USD 21.6 billion in 2035.
What Value CAGR did the Whey Cheese Market Exhibit Over the Last Five Years?
The historic growth rate of the whey cheese market was 5.4% from 2020-2024.