


- Base Value(2024): 390.9 Mn
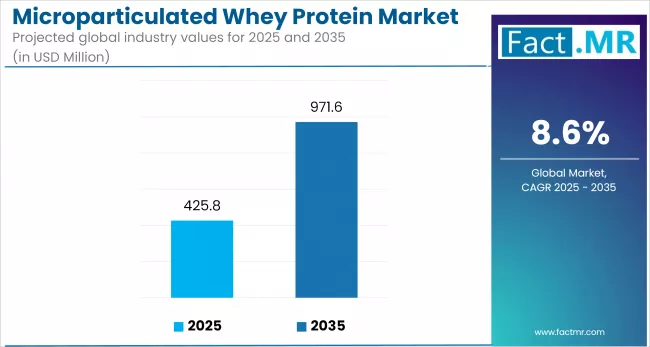
- Forecast Value (2035): 971.6 Mn
- CAGR (2035): 9.0%
Microparticulated Whey Protein Market Outlook (2025 to 2035)
The global microparticulated whey protein market is expected to reach USD 971.6 million by 2035, up from USD 390.9 million in 2024. During the forecast period (2025 to 2035), the industry is projected to grow at a CAGR of 8.6%, due to rising demand for low-fat, high-protein solutions in functional dairy and nutrition-focused beverages.
Its ability to replicate fat texture while supporting clean-label formulations makes it a preferred choice for manufacturers. This trend aligns with growing consumer interest in health-conscious, protein-rich diets, reinforcing the market’s growth trajectory.
What drives demand growth in the Microparticulated Whey Protein market across functional food applications?
A key driver of the microparticulated whey protein market is escalating consumer preference for healthier, high-protein, low-fat foods. The property of the ingredient to substitute for the creamy feel of fats, while providing clean nutrition, makes it very desirable. Manufacturers are employing warheads to reengineer conventional products without concern for sensory attraction loss.
Its use is also facilitated by increased interest in sports nutrition, functional dairy drinks and weight management. The growing popularity of clean-label ingredients and increasing awareness of the properties of whey protein encourage both international and regional producers to strengthen their production capacities and diversify the fields of application, especially in the upper-end food segments.
What drives demand for microparticulated whey protein in functional foods and dairy applications?
Key industry trends include a shift toward clean-label formulations, increased use of fat replacers in dairy and rapid advancements in protein-fortified food and beverage products. The hybrid form also utilizes microparticulated whey protein, which is blended with other plant-based proteins to meet diverse consumer demands.
Personalized nutrition and functional foods have led to the expansion of new textures and delivery mechanisms, prompting manufacturers to experiment. Sustainability campaigns are compelling manufacturers to adopt environmentally friendly processing technologies.
At the same time, there is an increased rate of cross-sectoral cooperation between dairy manufacturers and health foods brands, where micropatriculated whey is becoming a strategic pillar in high-end nutrition portfolios.
What factors are limiting the growth of the microparticulated whey protein market globally today?
The microparticulated whey protein market faces challenges, including high processing costs and formulation-related technical complexities. Medium and small-scale production houses also typically lack access to high-end infrastructural arrangements for production, which affects the scalability of their products.
A competitive threat is also the shift in preference towards plant-based sources of protein, particularly in areas with an increasing number of vegans. The consciousness of the market remains relatively low in developing economies beyond the mature ones, which affects the growth of demand.
Regulatory aspects of dairy allergens and labelling could also be a deterrent to growth. These are problems that require strategic investments in education, R&D, and process optimization to access larger market potential.
What are the key regional growth trends in the Microparticulated Whey Protein market?
North America continues to hold a dominant share in the industry, largely due to the region's well-developed health and wellness sector. The demand is being driven by high intake of protein-fortified dairy, functional foods, sports nutrition, drinking aids, and ready-to-drink beverages. The U.S. is the most advanced in adoption, largely due to its advanced food processing infrastructure and high concentration of multinational suppliers of dairy ingredients.
East Asia is also an increasingly dynamic region, driven by rapid urbanization and rising demand for functional foods. The growing knowledge about the high-protein diets, particularly in China, Japan and South Korea, is increasing the demand for whey-based ingredients. Local producers are increasing their volumes to suit the new demands of low-fat, high-nutrition compositions in the market.
There is consistent market penetration in Western Europe, which is supported by favorable regulatory frameworks that promote clean-label products and sustainability requirements. Germany, France, and the Netherlands are among the top users, and manufacturers are placing greater emphasis on fat reduction and protein enrichment in dairy substitutes and other hospital nutrition products. The creation of food textures and health positioning makes the region more competitive in the food market.
Country-Wise Outlook
Health-Conscious Consumers and Functional Ingredients Boost U.S. Microparticulated Whey Protein Market
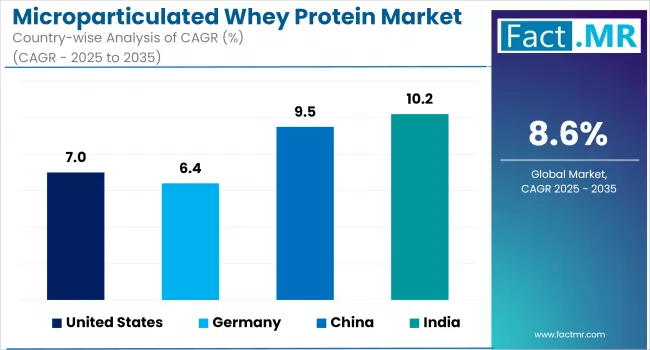
Microparticulated whey protein market in the U.S. has registered a steady growth, with an upsurge in content preference of nutrient-added baked goods by consumers. There has been a growing concern with wellness and clean labelled ingredients, and a large concentration on natural preservatives, with major bakers purchasing natural preservatives such as microparticulated whey protein.
The shift toward this direction reflects the changes in eating habits, which value healthiness, transparency, and usefulness. Microparticulated whey protein has also found use in artisanal and organic breads, as consumers become increasingly interested in high-quality products with no additives.
Frozen food, such as frozen dough products, a potential application area for microparticulated whey protein, offers retailers the convenience of no refrigeration needed and a long shelf life. This has been in the market, reaping the benefits of whey protein to prolong shelf life without sacrificing taste or flavor.
Clean-Label Compliance and Dairy Innovation Propel Germany’s Microparticulated Whey Protein Market
The microparticulated whey protein market in Germany has grown due to strict regulatory standards and increasing consumer demand for clean-label products. The use of natural preservatives increased among the food manufacturers because it meets the strict European rules about food safety as well as satisfies the demand of people to consume food that is free of any additives and organic.
Microparticulated whey protein has been useful in the dairy and bakery industries, as it is able to prevent spoilage without altering the taste or texture. Microparticulated whey protein food manufacturers have concentrated on making it part of their products to ensure that the products are not compromised in terms of quality and reliability, and to be able to offer their consumers natural and sustainable food preservative options where clean-label guidelines are becoming increasingly common.
Urbanization and Nutritional Awareness Drive China’s Microparticulated Whey Protein Market
The market for microparticulated whey protein in China has been experiencing accelerated growth due to the country's urbanization rate and the increasing attention of consumers to nutrition. The shift in dietary patterns towards those of Westerners, combined with the general increase in demand for protein-rich foods, has led to the use of microparticulated whey protein in the food industry.
This substance has found its way into dairy products, baked goods, and ready-to-eat meals manufactured by producers seeking to fulfill nutritional needs and serve consumers who prioritize proper dietary concerns. The texture and mouthfeel enhancement capabilities of microparticulated whey protein have made it an important ingredient in the developing Chinese food industry, which has centered on health and wellness.
Category-Wise Market Outlook
Microparticulated Whey Protein Concentrate (MWPC) Leads Growth with Cost Efficiency and Functional Superiority
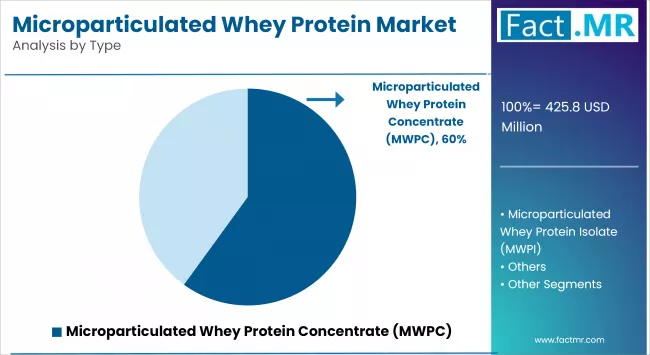
Microparticulated Whey Protein Concentrate (MWPC) is rapidly gaining traction as a cost-efficient ingredient that delivers a smooth texture along with enhanced protein content. It has been widely applied in fat-reduction efforts without compromising flexibility, particularly in dairy and meal-replacement-based products. Its flexibility has ensured that it has been an attractive alternative to manufacturers serving the health-conscious, cost-conscious consumers, especially in North America and sections of Asia.
Powdered Format Gains Ground Driven by Shelf Stability and Formulation Flexibility
The dominant growth has been in powdered microparticulated whey protein, spurred by its high shelf life, lightweight nature, and easy incorporation into various food applications. Its dry form means formulation flexibility, as it can be used in sports drinks and high-protein snacks, and enables manufacturers to cut the cost of transportation, something that has drawn big manufacturers. The trend has led to more demand for home-based consumption and protein fortification after the pandemic.
Spray Drying Rises as the Preferred Processing Method for Superior Quality and Efficiency
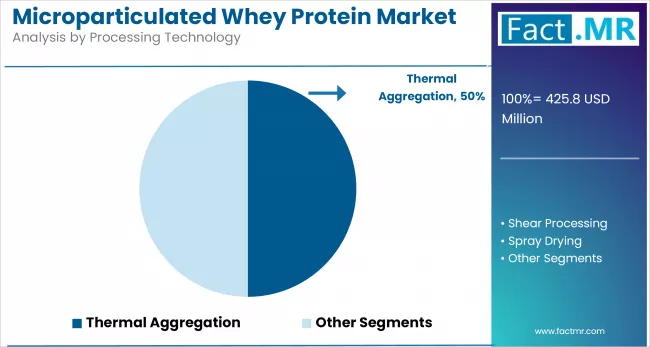
Spray drying has emerged as a preferred advanced processing technology due to its precision, ability to produce uniform particles, and enhancement of mouthfeel and solubility. This is used where large quantities of consistent products are required, since it fits the high-quality and large-scale protein manufacturing category. It has especially resonated in Western manufacturing centers, where the scalability of production and the consistency of products are the utmost requirements.
Competitive Analysis
Competitive Outlook: Microparticulated Whey Protein Market
The microparticulated whey protein market is experiencing strong growth, driven by advancements in processing technologies and increasing consumer demand for high-quality protein ingredients. Major manufacturers have taken advantage of new methods to provide functional properties of whey proteins, to suit various applications in the food and beverage industry.
There has been a trend in the market shifting to products that would give a better textural effect, stability and nutraceutical value, which is similar to the health conscious consumer trend in the market.
Players such as Fonterra Co-operative Group Limited, Glanbia plc, and Arla Foods Ingredients Group P/S have dominated the market by coming up with specialized products of whey protein. Arla Foods has introduced Nutrilac ProteinBoost, a series of microparticulated whey proteins to response the increasing consumer attention to the quality of proteins. Such advancements have made these firms lead in the market, and this has shown standards of quality and innovation.
Key players in the microparticulated whey protein industry include Fonterra Co-operative Group Limited, Glanbia plc, Arla Foods Ingredients Group P/S, Hilmar Cheese Company, CP Kelco, Kerry Group, Davisco Foods International, Inc., Agropur Cooperative, Lactalis Ingredients, and Tatua Co-operative Dairy Company.
Recent Development
- In September 2024, Arla Foods Ingredients launched the 'Go High in Protein' campaign, introducing its Nutrilac® ProteinBoost range of patented microparticulated whey proteins. The campaign aims to inspire dairy manufacturers to create innovative high-protein products, showcasing concepts like ambient spoonable yoghurt and high-protein ice cream.
- In 2024, SPX FLOW unveiled its LeanCreme™ system, a technology that produces microparticulated whey protein concentrate. This innovation enhances the texture and nutritional value of various products, including cheese, dairy desserts, and protein drinks, by replacing fat and improving the mouthfeel.
Fact.MR has provided detailed information about the price points of key manufacturers in the microparticulated whey protein market, positioned across regions, including sales growth, production capacity, and speculative technological expansion, in the recently published report.
Methodology and Industry Tracking Approach
The 2025 global microparticulated whey protein market report by Fact.MR redefines strategic intelligence benchmarks in the protein ingredients landscape, offering a precision-engineered, data-rich perspective on microparticulated whey protein’s expanding role in foodservice innovation, premium dairy formulation, and sustainable nutrition ecosystems.
Drawing from insights contributed by over 7,750 stakeholders across 40 countries, each providing more than 350 rigorously qualified responses, the report delivers unparalleled analytical rigor, geographic breadth, and market relevance.
The respondent framework was designed for comprehensive 360° visibility, with two-thirds comprising end users and decision-makers, such as category leads, procurement executives, R&D heads, and sustainability strategists, from key sectors including dairy, food and beverage, health nutrition, and specialty retail. The remaining one-third included domain specialists, such as food technologists, dairy scientists, cold-chain analysts, and export advisors, who were actively engaged in segments like low-fat cheese, functional beverages, and clean-label protein formulations.
Conducted over an extensive research cycle from June 2024 to May 2025, the study tracks pivotal shifts across the Microparticulated Whey Protein Market, including source optimization (single-origin vs. blended milk proteins), processing advancements (microfiltration, low-energy shearing, and spray-drying systems), application diversification (hybrid dairy-plant formats, satiety-focused formulations, and ready-to-consume dairy snacks), and regulatory transitions around clean labeling, export classification, and compositional standardization. A robust stratified modeling approach ensures dynamic insight weighting across regions, respondent roles, and value chain tiers.
Backed by over 280 verified sources, ranging from international trade statistics and dairy R&D patents to food safety databases, regulatory whitepapers, and in-market audits, the report leverages advanced analytics, including segmentation clustering, longitudinal trend tracking, and predictive regression modeling, to deliver actionable, forward-looking intelligence.
Ongoing market surveillance since 2018 positions this 2025 edition as an essential resource for dairy processors, ingredient manufacturers, product developers, procurement teams, foodservice innovators, and institutional investors aiming to lead in the high-growth microparticulated whey protein economy.
Segmentation of Microparticulated Whey Protein Market Research
-
By Type :
- Microparticulated Whey Protein Concentrate (MWPC)
- Microparticulated Whey Protein Isolate (MWPI)
- Others
-
By Form :
- Powder
- Liquid
-
By Processing Technology :
- Thermal Aggregation
- Shear Processing
- Spray Drying
-
By Application :
- Fat Replacement
- Texture Enhancement
- Mouthfeel Enhancement
- Protein Fortification
- Dairy Product Formulation (e.g., yogurt, cheese)
- Beverage Enrichment
-
By End Use :
- Food & Beverage Industry
- Nutraceutical Industry
- Sports Nutrition
- Pharmaceutical Industry
- Cosmetics and Personal Care Industry
- Animal Nutrition
-
By Distribution Channel :
- Direct Sales
- Specialty Stores
- Online Retailers
- Supermarkets/Hypermarkets
-
By Region :
- North America
- Latin America
- Western Europe
- Eastern Europe
- East Asia
- South Asia & Pacific
- Middle East & Africa
- Frequently Asked Questions -
What was the Global Microparticulated Whey Protein Market Size Reported by Fact.MR for 2024?
The global Microparticulated Whey Protein Market was valued at USD 390.9 Million in 2024.
Who are the Major Players Operating in the Microparticulated Whey Protein Market?
Prominent players in the market are Fonterra Co-operative Group Limited, Glanbia plc, Arla Foods Ingredients Group P/S, Hilmar Cheese Company, CP Kelco, Kerry Group, Davisco Foods International, Inc., Agropur Cooperative, Lactalis Ingredients, Tatua Co-operative Dairy Company.
What is the Estimated Valuation of the Microparticulated Whey Protein Market in 2035?
The market is expected to reach a valuation of USD 971.6 Million in 2035.
What Value CAGR did the Microparticulated Whey Protein Market Exhibit Over the Last Five Years?
The historic growth rate of the Microparticulated Whey Protein Market was 8.2% from 2020 to 2024.