


- Base Value(2024): 37 Bn
- Forecast Value (2035): 87 Bn
- CAGR (2035): 8.2%
Sports Drink Market Outlook (2025 to 2035)
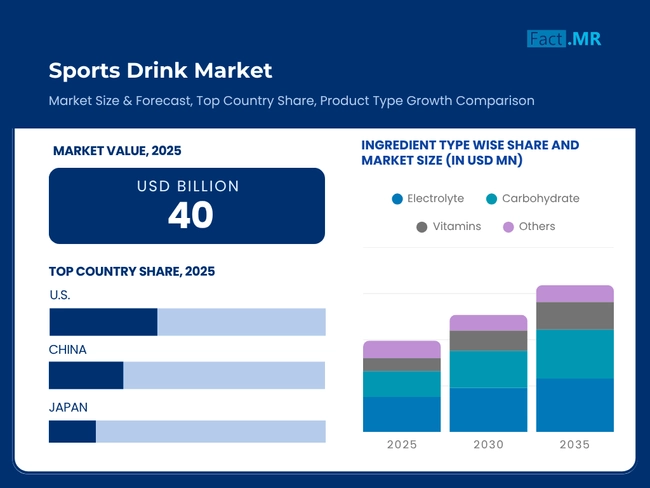
The global sports drink market is expected to reach USD 87 billion by 2035, up from USD 37 billion in 2024. During the forecast period 2025 to 2035, the industry is projected to expand at a CAGR of 8.2%. The market is experiencing an upward trajectory due to increased health awareness, heightened involvement in fitness and endurance activities, and growing consumer demand for functional hydration.
Low-sugar, clean-label formulations and drinks with electrolytes are innovating to increase product interest with ordinary customers rather than just athletes. Such dynamics are altering the category and are driving competitive activity between traditional brands and new entrants focused on offering products with a wellness angle.
What key factors are driving consumer demand growth in the global sports drink market today?
Some of the major determinants of the sports drink market are the growing awareness of health, sporting and fitness activity, and the regime transition towards the preventive healthcare. Due to increased awareness of consumers about electrolyte balance and hydration, there is increased demand of functional beverages. Industrialization and busy schedules add to the charm of convenient and accessible-to-drink hydration products.
The focus of the marketing campaign among millennials and Gen Z, such as celebrity promotion and integration of the products into the fitness apps, are also increasing the visibility of the products. Sports drinks are also consumed more due to increased occasions as more people participate in fitness centers and home exercises. Generally, the market is driven by the demand level of performance enhancement and wellness supporting beverages among consumers.
What emerging trends are shaping consumer preferences in the global sports drink market today?
Key movements in the transition of the sports drink market are clean-label product innovations, plant-based compositions, and natural sweeteners. Consumers are becoming interested in products with a reduced number of artificial additives. Functional ingredients such as coconut water, adaptogens, and vitamins are being introduced into brands to increase their functional properties. The individualized and personal hydration products and online interaction via fitness technology platforms are becoming more popular.
In addition, the concept of packaging as a sustainability innovation (recyclable bottles and biodegradable materials) is also emerging as a competitive differentiator. More and more gamification and augmented reality experiences regarding the product use are stepping out to the stage to enable brands to create stronger relations with tech-savvy and fitness-oriented consumers.
What key factors are restraining growth in the global sports drink market across regions?
Although the sports drink market has been growing in a sustained manner, a number of challenges exist in the industry. Popular health-related issues, such as the sugar levels and the use of artificial additives may push customers away, particularly in areas where eating habits are highly regulated. The sufficiency of market in the developed countries has complicated competition since brand diversity is hard to achieve.
Legal issues with health claims and labeling transparency may become obstacles to product releases and reformulation. The threat of environmental criticism on plastic packaging is also a danger that beckons the manufacturers to use alternative sustainable packaging methods, which are expensive to adopt. Emerging markets become sensitive to price, which may restrain the use of premium products.
What factors influence regional consumption patterns in the global sports drink market across key geographies?
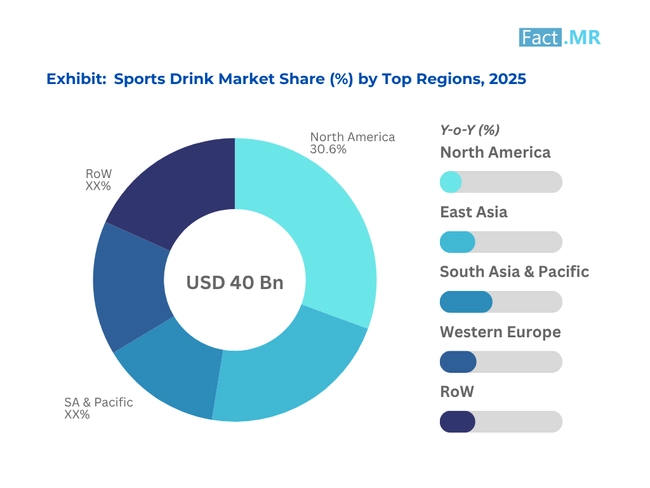
In the sports drink market, North America hold dominant market share globally due to the output of successful fitness culture, the number of people involved in organized sports activities and control exerted by major brands such as Gatorade and Powerade. Customers are preoccupied with health and performance, driving the demand of low-sugar, healthy beverages. Product innovation and clear marking are encouraged by regulatory standards that stabilize the market.
In East Asia, fast market expansion is a reality driven by the fact that urbanization is rising fast, disposable income is increasing, and there is an awareness that promotes fitness and hydration. The countries such as China, Japan, and South Korea are embracing sports drinks as part of the lifestyle. Manufacturers are localizing tastes and formulas in order to attract people with different tastes and gain market share in each region.
There is consistent demand of sports drinks in Western Europe where the customers will be interested in the aspect of health, natural ingredients, and clean labeling. Sports and recreation sports are also common between fans and physical fitness especially in Germany and UK. Regulations have led to lowering of sugar, thereby leading to innovations. Environmentally aware consumers are interested more in sustainability in packaging and sourcing.
Country-Wise Outlook
Health-Conscious Consumers and Functional Ingredients Boost USA Sports Drink Market
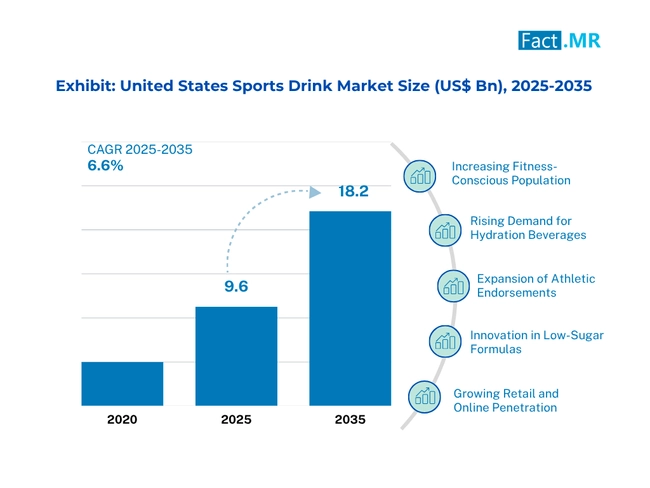
The sports drink industry in the United States is witnessing a healthy growth because of rising consciousness about the health concerns and skewed trend towards consumption of functional drinks. Youth demographic, specifically Gen Z and Millennials are opting to find natural ingredients, low-sugar levels, and functional added advantages in their hydration products.
Among the innovations that have emerged in this trend include hydration products sourced and made with plants and electrolyte-based powders. Leading giants e reacting to this by producing products, which are convenient and customizable and respond to the needs of hydration.
Urbanization and Health Awareness Drive China's Sports Drink Market
The demand of sports drinks has been growing tremendously in China, a factor that can be attributed to the fact that the country is really undergoing rapid urbanization accompanied with heightened health conscious among consumers. There are increased demands of low-sugar, low-fat, and low-sodium drinks, as per the trends of universal health.
Producers are trying to keep up with these preferences using natural sweeteners such as stevia to maintain the same taste. The increasing demand of fitness activities and functional food continues to promote the market as the consumers are in demand of beverages that promise hydration and nutritional value.
Functional Beverages and Clean Labels Propel Japan’s Sports Drink Market
The sports drinks market in Japan is soaring at a high rate due to the rise of the culture of health and well-being. It is apparent that consumers are more interested in functional beverages with hydration and energy boosting properties and they are also shifting towards natural ingredients and clean labeled products. Market is moving with innovations such as low-calorie drinks with sweeteners such as stevia and vitamin and mineral-enriched products. Health stores and fitness centers ties are also helping in reaching out to health conscious consumers.
Category-Wise Market Outlook
Isotonic Sports Drinks Propel Sports Hydration Growth Amid Demand for Balanced Electrolytes and Low-Calorie Performance Solutions
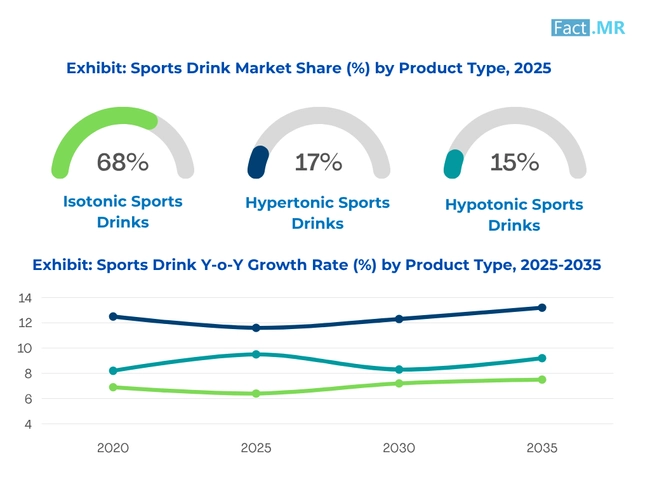
The dominantly growing segment among product type would be Isotonic Sports Drinks. They are also popular because they contain the paramount proportion of electrolytes and carbohydrates, which is nearly equivalent to the fluid levels of the body. This is why they are the best option when it comes to hydrating and refueling to both endurance sportspeople and health-conscious consumers. The fact that they are very low on sugar or calories makes them an ideal pick in work and play.
Electrolytes Propel Sports Drink Growth Amid Rising Demand for Hydration Science and Post-Exercise Recovery Solutions
The most prominent growth in the ingredient type segment is the electrolytes (Sodium, Potassium, and Magnesium). The knowledge of the science of hydration continues to rise, and patients and customers are constantly looking forward to sports drinks capable of maintaining muscle activity, avoiding muscle cramps, and re-establishing electrolyte balance. The emphasis on functional ingredients in post exercise recovery and performance enhancement has led electrolytes to become a center of attraction in the product designs.
Citrus Flavors Dominate Sports Drink Market Amid Clean Label Preference and Functional Health Appeal
The dominant flavor segment is Citrus Flavors (Lemon, Lime, and Orange) because of the huge acceptance rate of this flavor category, refreshing flavor profile, as well as the notion that they are natural and energizing. The flavors also are associated with the clean label and natural taste that the contemporary health conscious consumers are compliant with. They are also linked with vitamin C and immunity supplements further improving their pull to the functional beverage market.
Powder Mix Formats Propel Sports Drink Market Amid Convenience Demand and Sustainable Packaging Trends
Single-serve sachets or tubs in the form of Powder Mixes are the swiftly growing. They are convenient as well as having a long shelf life and variable concentration, which makes them appealing to active users, travelers and sportsmen. Planet-friendly customers are pleased with the fact that the product is packaged with less waste and less storage space as opposed to bottled methods.
Online Retail Leads Sports Drink Market Growth Amid E-Commerce Boom and Consumer Demand for Personalized Wellness Solutions
The firmly growing channel of sports drink is Online Retail. It continues to grow as more people prefer direct-to-consumer wellness products, subscription-based business model and the overall transition towards e-commerce. Customers appreciate the opportunity to experiment with a variety of choices, the possibility to use individual or special formulas, delivery convenience, bundling discounts.
Competitive Analysis
Competitive Outlook: Sports Drink Market
The international Sports Drink market is very competitive and at the same time monopolized by international giants like PepsiCo, Inc. and The Coca-Cola Company occupying the sector with the help of wide distribution channels and their large brand names like Gatorade and Powerade respectively.
The Suntory Holdings and Otsuka Holdings (Pocari Sweat) are still powerful in APAC markets, focusing on the hydration science and functional health. Red Bull GmbH and Monster Beverage Corporation have performance-enhancing versions with the crossover effect in the energy drink category that increases their popularity among active drinkers. Strategic trends in the market include the low-sugar, clean-label and functional formulation experiences.
New entrants such as BioSteel Sports Nutrition Inc. specialize in plant-based, zero-sugary hydration, as one another way of targeting health-conscious consumers. Abbott Laboratories are active in medical grade hydration (e.g., Pedialyte Sport) whereas The Kraft Heinz Company uses their food and beverage platform to enter the performance drink. Latin American markets are taken by AJE Group (Sporade). The competitive landscape is still driven by innovation, athlete endorsements and regional customization.
Key Market Players of Sports Drink Market are PepsiCo, Inc., The Coca-Cola Company, Suntory Holdings Limited, Otsuka Holdings Co., Ltd., Red Bull GmbH, Monster Beverage Corporation, Abbott Laboratories, The Kraft Heinz Company, BioSteel Sports Nutrition Inc., and AJE Group.
Recent Development
- In March 2025, Stephen Curry and Michelle Obama launched PLEZi Hydration, a no-added-sugar sports drink. This beverage offers natural ingredients, 100% of the recommended daily value of vitamin C, and comes in flavors like Tropical Punch and Orange Mango Twist. It's available on Amazon and select Walmart locations in California.
- In March 2025, Gatorade introduced Flavor Mashups, blending popular flavors into new combinations. The new drinks combine Cool Blue with Fruit Punch and Lemon Lime with Orange, aiming to provide a fresh experience while honoring Gatorade's tradition of hydration and electrolyte replenishment.
Fact.MR has provided detailed information about the price points of key manufacturers of Sports Drink Market positioned across regions, sales growth, production capacity, and speculative technological expansion, in the recently published report.
Methodology and Industry Tracking Approach
The 2025 Global Sports Drink Market Report by Fact.MR redefines strategic market intelligence by delivering a data-driven, precision-oriented perspective on the evolving dynamics of performance hydration and functional beverage innovation. Based on insights from over 8,200 stakeholders across 35 countries-each contributing a minimum of 250 qualified responses-the report offers unmatched analytical rigor, regional intelligence, and stakeholder diversity.
The respondent ecosystem was thoughtfully curated, with nearly two-thirds comprising end users and strategic decision-makers, including R&D heads, category managers, procurement leaders, and brand strategists from leading beverage and wellness companies. The remaining one-third included specialists such as sports nutritionists, formulation scientists, regulatory advisors, supply chain experts, and fitness industry consultants spanning FMCG, foodservice, and retail distribution segments.
Spanning the period from June 2024 to May 2025, the study rigorously tracked market transitions across hydration science, zero-sugar formulation trends, clean-label compliance, functional ingredient integration, athlete-centric innovations, and regulatory developments shaping global isotonic, hypertonic, and hypotonic beverage categories. Stratified statistical modeling ensured accurate representation across regions, functions, and consumer profiles.
Leveraging more than 300 verified sources-including scientific publications, patents, ingredient data sheets, regulatory policies, and commercial insights-the report employs advanced techniques such as cluster mapping, multivariate regression, and time-series forecasting to deliver high-confidence, actionable intelligence.
With continuous monitoring of the sports drink landscape since 2018, Fact.MR offers exceptional domain authority. The 2025 edition serves as an essential guide for sports nutrition brands, beverage innovators, CPG strategists, private-label manufacturers, regulatory stakeholders, and investors seeking to lead in the high-performance, health-aligned hydration market of tomorrow.
Segmentation of Sports Drink Market Research
-
By Product Type :
- Isotonic Sports Drinks
- Hypertonic Sports Drinks
- Hypotonic Sports Drinks
-
By Ingredient Type :
- Electrolytes (Sodium, Potassium, Magnesium)
- Carbohydrates (Glucose, Sucrose, Fructose)
- Vitamins (B6, B12, C, D)
- Flavors and Natural Additives
- Preservatives and Colorants
-
By Flavor :
- Citrus (Lemon, Lime, Orange)
- Mixed Berries
- Tropical Fruits
- Watermelon
- Others (Herbal, Mint-infused, Custom blends)
-
By Packaging Format :
- Bottles (PET, Glass)
- Cans
- Tetra Packs/Cartons
- Pouches
- Powder Mix (single-serve sachets or tubs)
-
By Distribution Channel :
- Online Retail
- Supermarkets/Hypermarkets
- Convenience Stores
- Pharmacies & Health Stores
- Fitness Centers & Gyms
- Specialty Beverage Stores
-
By End User :
- Athletes & Sports Professionals
- Recreational Users
- Lifestyle & Fitness Enthusiasts
- Military Personnel
- Children & Teenagers
-
By Region :
- North America
- Latin America
- Western Europe
- Eastern Europe
- East Asia
- South Asia & Pacific
- Middle East & Africa
- Frequently Asked Questions -
What was the Global Sports Drink Market Size Reported by Fact.MR for 2024?
The global Sports Drink Market was valued at USD 37 Billion in 2024.
Who are the Major Players Operating in the Sports Drink Market?
Prominent players in the market are PepsiCo, Inc., The Coca-Cola Company, Suntory Holdings Limited, Otsuka Holdings Co., Ltd., Red Bull GmbH, Monster Beverage Corporation, Abbott Laboratories, The Kraft Heinz Company, BioSteel Sports Nutrition Inc., AJE Group.
What is the Estimated Valuation of the Sports Drink Market in 2035?
The market is expected to reach a valuation of USD 87 Billion in 2035.
What Value CAGR did the Sports Drink Market Exhibit Over the Last Five Years?
The historic growth rate of the Sports Drink Market was 7.7% from 2020 to 2024.