- Market Value (2025): USD 32.50 Bn
- Estimated Value (2026): USD 35.3 Bn
- Forecast Value (2036): USD 80.4 Bn
- CAGR (2026-2036): 8.6%
What is the 3D Transistor Market forecast to be worth by 2036?
USD 35.3 billion in 2026 to USD 80.4 billion by 2036 at an 8.6% CAGR.
- Fact.MR calculates that the 3D transistor market reached USD 32.5 billion in 2025, with 5nm and 3nm wafers for phones and AI servers forming most of that base.
- Revenue is set to climb from USD 35.3 billion in 2026 to USD 80.4 billion by 2036 as gate-all-around nodes join FinFET in volume output.
- Growth will compound at 8.6% CAGR from 2026 to 2036, since every new phone, PC and accelerator generation moves to a denser node.
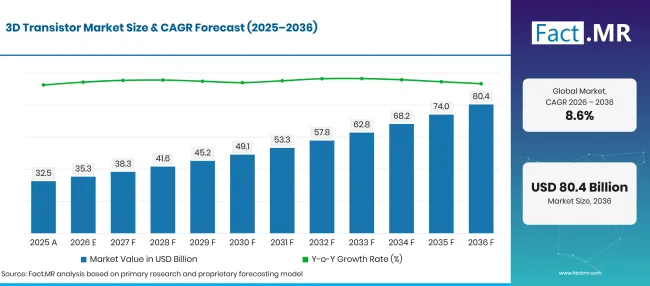
Factmr 3D Transistor Market Forecast Global | Source: Fact.MR
| Year | Basis | Market Value (USD billion) |
|---|---|---|
| 2025 | Actual | 32.50 |
| 2026 | Estimate | 35.3 |
| 2036 | Forecast | 80.4 |
| CAGR 2026 to 2036 | Forecast period | 8.6% |
Source: Fact.MR analysis. Updated Oct 21, 2026
What are the defining numbers behind 3D Transistor Market growth?
The 2026 to 2036 period adds USD 45.1 billion in new value, most of it from FinFET and gate-all-around nodes below 7nm.
- Demand Drivers in the Market
- AI training and inference push chip designers toward denser transistors that switch with less energy. The International Energy Agency projected that data-centre electricity demand will reach around 945 TWh by 2030, more than double current levels [1]. Each watt saved at the transistor lowers cooling and power bills for server operators.
- Vehicle electrification raises the logic content of every car. Global electric car sales passed 17 million in 2024, more than 20% of all cars sold, according to the IEA [2]. Driver-assistance and zonal controllers built on FinFET nodes now replace older planar microcontrollers in new platforms.
- Connected devices keep consumer demand broad. ITU estimated that about 6 billion people used the Internet in 2025, up from 5.8 billion a year earlier [3]. Phones, laptops and wearables bought by these users carry application processors made on 5nm and 3nm FinFET lines.
- Public funding is adding new fabs in the United States, Japan and Europe. Most of the new capacity targets FinFET and gate-all-around logic and memory, which spreads 3D transistor output beyond Taiwan and South Korea.
- The move to gate-all-around opens a new pricing tier. Nanosheet channels surrounded by the gate on all four sides cut leakage further than fins, so early wafers carry a premium over mature FinFET nodes.
- Key Segments Analyzed
- By Product Type: FinFET will command 59.9% share in 2026, since its tool sets, design libraries and yields are proven across 16nm to 3nm.
- By Application: Consumer Electronics will take 33.5% share in 2026 on the strength of annual phone, laptop and wearable processor refreshes.
- By Technology Node: 5nm will capture 47.5% share in 2026, given that it pairs mature yields with the density that mobile and AI chips need.
- By End-User: Foundries will hold 52.6% share in 2026 through contracted wafer output for fabless chip designers.
- Analyst Opinion at Fact.MR
- Shambhu Nath Jha, Principal Consultant at Fact.MR, states, “Chip designers now pick a process by its leakage and drive current before its node label, which keeps FinFET in front while gate-all-around ramps. Foundries that publish clear yield data on 2nm nanosheet lines will win the next round of fabless orders. The new growth will come from automotive logic and from fabs being built in the United States and Japan.”
- Strategic Implications
- Foundries should commit capital to gate-all-around process development now, as fin scaling gains shrink below 3nm.
- Fabless designers should qualify a second process source early in each design cycle, given that leading-edge wafer slots are allocated months ahead.
- Equipment suppliers should widen their deposition and etch offers for nanosheet and forksheet structures, which need new selective processes.
- Automotive and industrial buyers should lock in multi-year supply terms, since phone and data-center customers absorb most new leading-edge output.
At 9.9% CAGR, Germany will lead the group, where vehicle makers are shifting fast to electric platforms that need more logic per car. Brazil follows at 9.0% as a new semiconductor program draws chip design and assembly projects. The United States will expand at 8.2% with memory and logic fabs funded under federal chip incentives. A 7.3% pace in the United Kingdom reflects a design-led chip sector with public start-up support. Japan rounds off the list at 6.5%, as a state-backed 2nm pilot line in Hokkaido moves toward mass production.
How does the 3D Transistor Market break down by segment?
FinFET will lead Product Type at 45.2%; Consumer Electronics will top Application at 33.5%; 5nm will head Technology Node at 47.5%; Foundries will hold first place in End-User at 52.6%.
Which Product Type dominates?
FinFET takes 45.2% of 2026 sales.
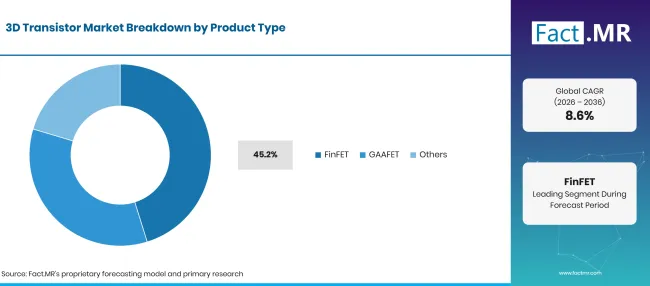
Factmr 3D Transistor Market Breakdown Product Type | Source: Fact.MR
| Product Type | Share (2026) |
|---|---|
| FinFET (Leading segment) | 59.9% |
| Other segments combined | 40.1%* |
| Total | 100.0% |
Source: Fact.MR analysis. Updated Oct 21, 2026
Design teams have used fin-based libraries for more than a decade, so tape-out risk and mask cost stay predictable. The raised fin lets the gate wrap three sides of the channel and keeps leakage under control at 16nm to 3nm. Most of the leading-edge silicon wafers that foundries start each month still run fin processes. TSMC’s third-quarter 2026 results show the balance: 3nm and 5nm wafers together made up 61% of its wafer revenue, while 2nm nanosheet output reached 8% [4]. GAAFET wraps the gate fully around stacked nanosheets and will gain share as 2nm lines at TSMC, Samsung, Intel and Rapidus fill.
What leads the Application segment?
Consumer Electronics accounts for 33.5% of 2026 sales.
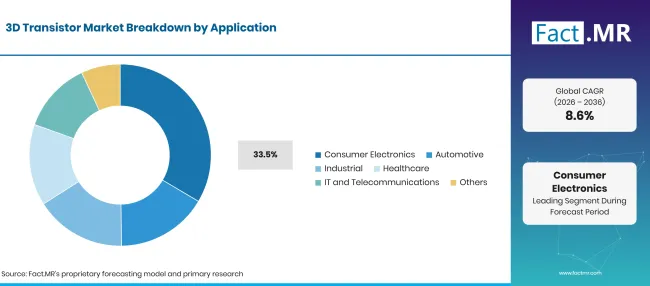
Factmr 3D Transistor Market Breakdown Application | Source: Fact.MR
| Application | Share (2026) |
|---|---|
| Consumer Electronics (Leading segment) | 33.5% |
| Other segments combined | 66.5%* |
| Total | 100.0% |
Source: Fact.MR analysis. Updated Oct 21, 2026
Phone and laptop brands launch new processors every year and compete on battery life, which keeps them first in line for each new node. Wearables and game consoles add volume on slightly older FinFET nodes. IT and telecommunications buyers use 3D transistors in servers, network switches and data center accelerators. Automotive demand rises with each new vehicle platform, as automotive semiconductors move from planar microcontrollers to FinFET system-on-chips. Industrial and healthcare uses take smaller volumes for control and imaging electronics.
How does Technology Node shape demand?
5nm makes up 26.4% of 2026 revenue.
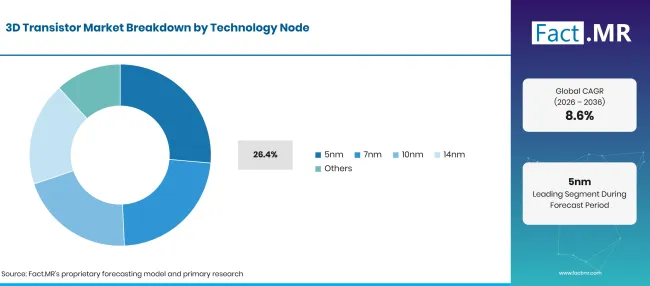
Factmr 3D Transistor Market Breakdown Technology Node | Source: Fact.MR
| Technology Node | Share (2026) |
|---|---|
| 5nm (Leading segment) | 47.5% |
| Other segments combined | 52.5%* |
| Total | 100.0% |
Source: Fact.MR analysis. Updated Oct 21, 2026
Yields on 5nm-class lines are mature after several years of high-volume output, so wafer cost per good die is lower than on newer nodes. Phone processors, GPUs and data center CPUs still ship in large numbers on 5nm and its 4nm derivatives. TSMC reported that 5nm alone generated 28% of its wafer revenue in the third quarter of 2026, with 7nm adding another 10% [4]. The 10nm and 14nm nodes serve cost-sensitive designs such as display drivers, networking chips and vehicle controllers.
What supports Foundries within End-User?
Foundries represent 52.6% of 2026 sales.
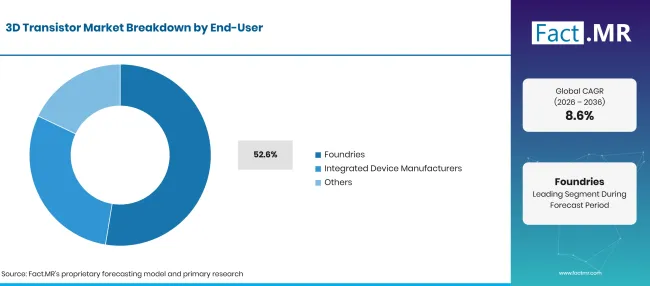
Factmr 3D Transistor Market Breakdown End User | Source: Fact.MR
| End-User | Share (2026) |
|---|---|
| Foundries (Leading segment) | 52.6% |
| Other segments combined | 47.4%* |
| Total | 100.0% |
Source: Fact.MR analysis. Updated Oct 21, 2026
Most chip companies do not own fabs and buy wafer capacity under contract, so foundry lines carry the bulk of 3D transistor output. Customers place orders up to a year ahead and often reserve capacity on the next node before it opens. Integrated device manufacturers build 3D transistors for their own processors and memory, and some now sell spare capacity to outside customers. Their output links closely to downstream steps such as 3D TSV packages that stack logic and memory dies.
What is accelerating 3D Transistor Market adoption, and what is holding it back?
Each new generation of phones, accelerators and vehicle controllers needs more performance per watt than planar transistors can give, and new fabs in several regions are adding 3D capacity. Leading-edge fabs cost tens of billions of dollars, though, and limited supply of advanced lithography tools will slow how fast capacity can follow design demand.
Drivers Impact Analysis
| DRIVER | (~) % IMPACT ON CAGR | GEOGRAPHIC RELEVANCE | IMPACT TIMELINE |
|---|---|---|---|
| Move from FinFET to gate-all-around architecture in leading-edge logic | +2.0% | Global | Short term (<= 2 years) |
| AI accelerator and high-performance computing chip demand | +1.6% | North America, East Asia | Short term (<= 2 years) |
| Automotive electrification and driver-assistance chip content | +1.3% | Western Europe, East Asia, North America | Medium term (2-4 years) |
| New fab construction backed by national chip incentives | +1.0% | North America, Western Europe, East Asia | Medium term (2-4 years) |
| Data center push for lower-leakage, energy-efficient processors | +0.7% | Global | Long term (>= 4 years) |
Source: Fact.MR analysis. Updated Oct 21, 2026
Opportunity Impact Analysis
| OPPORTUNITY | (~) % IMPACT ON CAGR | GEOGRAPHIC RELEVANCE | IMPACT TIMELINE |
|---|---|---|---|
| Commercial scale-up of nanosheet and forksheet transistor designs | +0.8% | East Asia, North America | Long term (>= 4 years) |
| Foundry capacity build-out in emerging manufacturing regions | +0.5% | Latin America, South Asia & Pacific | Medium term (2-4 years) |
| Advanced packaging bundled with next-generation transistor logic | +0.4% | North America, East Asia | Medium term (2-4 years) |
Source: Fact.MR analysis. Updated Oct 21, 2026
Restraints Impact Analysis
| RESTRAINT | (~) % IMPACT ON CAGR | GEOGRAPHIC RELEVANCE | IMPACT TIMELINE |
|---|---|---|---|
| Heavy capital outlay required for leading-edge fab construction | -0.6% | Global | Short term (<= 2 years) |
| Constrained access to advanced lithography systems | -0.4% | Global | Medium term (2-4 years) |
| Trade curbs on advanced chipmaking technology exports | -0.3% | East Asia, North America | Long term (>= 4 years) |
Source: Fact.MR analysis. Updated Oct 21, 2026
Which countries are scaling the 3D Transistor Market through 2036?
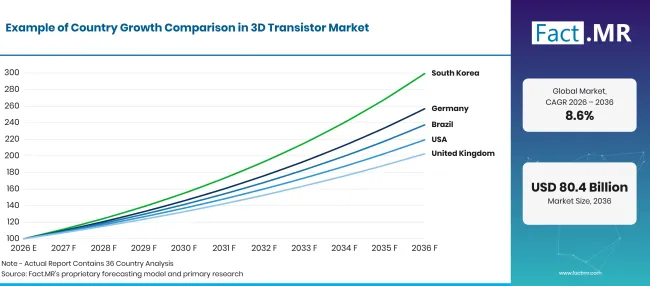
Factmr 3D Transistor Market Growth Index | Source: Fact.MR
| Country | CAGR (2026 to 2036) |
|---|---|
| Germany | 9.9% |
| Brazil | 9.0% |
| United States | 8.2% |
| United Kingdom | 7.3% |
| Japan | 6.5% |
Source: Fact.MR analysis. Updated Oct 21, 2026
What supports Germany’s adoption?
9.9% CAGR, driven by electric vehicle platforms that need more advanced logic per car.
Germany’s car industry is the main buyer of advanced chips in the country. The Federal Motor Transport Authority (KBA) counted 545,142 new battery-electric cars in 2025, a 19.1% share of new registrations and 43.2% more than in 2024 [5]. Each electric platform uses domain and zonal controllers, many on FinFET nodes, so rising volumes pull demand for 3D transistor logic through Tier 1 suppliers.
How is Brazil scaling demand?
9.0% CAGR, backed by a new national semiconductor program and growing electronics assembly.
Brazil signed Decree 13,065 on 15 July 2026 to put the Brasil Semicondutores program into operation under its PADIS incentive regime [6]. The decree lets BNDES and Finep structure financing for chip projects and keeps the incentive articles in force until 31 December 2029 [6]. Local plants mainly assemble and test imported FinFET chips for phones and computers, and the program targets more domestic design work.
How is the United States scaling demand?
8.2% CAGR, helped by federally supported memory and logic fab projects.
The Department of Commerce announced in June 2025 that Micron will invest USD 200 billion in U.S. memory manufacturing and R&D, backed by up to USD 275 million in added CHIPS funding [7]. The projects in Idaho, New York and Virginia will create about 90,000 jobs [7]. U.S. cloud providers and AI chip designers also buy a big part of global leading-edge foundry wafers.
What supports the United Kingdom’s growth?
7.3% CAGR, reflecting a design-led chip sector that the government is funding to scale.
The UK has few leading-edge fabs, so its demand comes from chip designers and system makers that buy foundry wafers. The Department for Science, Innovation and Technology valued the UK semiconductor sector at £10 billion in March 2025 and said it could reach £17 billion by 2030 [8]. In September 2025, a further £10 million fund opened to support up to 40 UK semiconductor businesses [9].
How does Japan perform?
6.5% CAGR, as state support moves a domestic 2nm line toward mass production.
Japan is rebuilding leading-edge logic output at home. METI planned to invest ¥100 billion from its fiscal 2025 budget in Rapidus through the Information-technology Promotion Agency [10]. Rapidus started its pilot line in Chitose, Hokkaido in April 2025, confirmed 2nm gate-all-around transistor operation on 300mm wafers, and aims for mass production in 2027 [11].
Who leads the 3D Transistor Market?
Three groups shape supply. TSMC, Samsung Electronics and Intel Corporation compete for the leading edge, where the contest has moved from fins to gate-all-around. At TSMC, the 2nm nanosheet process already brought in 8% of wafer revenue in the third quarter of 2026 [4].
Samsung builds its Exynos 2600 phone processor on what it calls the industry’s first 2nm GAA process [12]. Intel unveiled Panther Lake in October 2025 as the first platform on Intel 18A, which uses its new RibbonFET transistor architecture [13]. GlobalFoundries and United Microelectronics Corporation form a second group, selling 12nm and 14nm FinFET processes for networking, display and vehicle chips at lower wafer cost. Rapidus is the newcomer, with a 2nm pilot line in Hokkaido [11]. Yield on first-generation nanosheet lines and the ability to reserve capacity for large customers will separate the winners.
Which companies are the key providers?
Key companies include Taiwan Semiconductor Manufacturing Company (TSMC); Samsung Electronics Co., Ltd.; Intel Corporation; GlobalFoundries Inc.; United Microelectronics Corporation (UMC); and Rapidus Corporation.
- Taiwan Semiconductor Manufacturing Company (TSMC)
- Samsung Electronics Co., Ltd.
- Intel Corporation
- GlobalFoundries Inc.
- United Microelectronics Corporation (UMC)
- Rapidus Corporation
Bibliography
- [1] International Energy Agency. (2025, April 10). AI is set to drive surging electricity demand from data centres while offering the potential to transform how the energy sector works.
- [2] International Energy Agency. (2025). Global EV Outlook 2025: Executive summary.
- [3] International Telecommunication Union. (2025, November 17). Global number of Internet users increases, but disparities deepen key digital divides.
- [4] Taiwan Semiconductor Manufacturing Company. (2026, October 15). TSMC Reports Third Quarter EPS of NT$29.43.
- [5] Kraftfahrt-Bundesamt. (2026, January 6). Fahrzeugzulassungen im Dezember 2025: Jahresbilanz [Vehicle registrations in December 2025: Annual review].
- [6] Presidência da República, Brazil. (2026, July 15). Decreto nº 13.065, de 15 de julho de 2026 [Decree No. 13,065 of 15 July 2026 on the Brasil Semicondutores program].
- [7] U.S. Department of Commerce. (2025, June 12). President Trump Secures $200B Investment from Micron Technology for Memory Chip Manufacturing in the United States.
- [8] Department for Science, Innovation and Technology, UK. (2025, March 28). Government backs next wave of semiconductor start-ups to scale up growth.
- [9] Department for Science, Innovation and Technology, UK. (2025, September 24). New £10 million fund to support UK businesses to deliver next generation of semiconductors.
- [10] Ministry of Economy, Trade and Industry, Japan. (2025, November 21). Press Conference by Minister Akazawa (Excerpt).
- [11] Rapidus Corporation. (2026, April 11). NEDO Approves Rapidus’ FY2026 Plan and Budget for 2nm Semiconductor Projects.
- [12] Samsung Electronics. (2026, June 12). Exynos 2600: Mobile Processor.
- [13] Intel Corporation. (2025, October 9). Intel Unveils Panther Lake Architecture: First AI PC Platform Built on 18A.
This Report Answers
- Sizing for 2026 and 2036 is split by product type, application, technology node and end-user.
- Readers can see which sub-segment heads each segment in 2026 and the buyer needs behind that position.
- Car electrification, chip funding programs and fab projects frame the comparison of the five listed countries.
- Profiles group the leading-edge foundries, mature FinFET suppliers and new entrants by process capability.
- How fast the shift from fins to nanosheets will move, and what limits it, is traced node by node.
What does the 3D Transistor Market cover?
This market captures transistors whose gate controls the channel from three or four sides, a design that limits leakage far better than flat planar devices. Coverage spans logic and memory chips for consumer, automotive, industrial, healthcare and telecommunications uses.
Revenue is counted at first sale, whether by a foundry selling wafers or an integrated device manufacturer shipping finished chips built on 3D transistors. Technology node figures reflect output at each process geometry tracked in this study.
What is included in the scope?
FinFET and gate-all-around transistors are in scope, including nanosheet and forksheet variants once they reach commercial output. Both foundry wafers and in-house chips from integrated device manufacturers count, across nodes from 14nm to the most advanced in production.
Chips made for driving assist systems, phones, servers, factory controls and medical devices all fall within the tracked applications.
What is excluded from the scope?
Planar transistor designs, still common in mature low-cost chips, are left out of this study. Discrete power transistors sold as standalone parts are also excluded.
Designs still at the research stage, quantum devices and non-silicon logic are not counted. Packaging and test services enter the figures only when sold together with a chip that contains 3D transistors.
How Was the Analysis Built?
The analysis draws on 120+ sources, 35+ company portfolios, 25+ countries, and more than 20 industry interviews.
- Primary Research: Primary research includes discussions with manufacturers, service providers, technology developers, distributors, end users, and subject-matter experts. These conversations examine purchasing priorities, product adoption, operational challenges, approval requirements, competitive positioning, and the factors that influence wider market acceptance.
- Desk Research: Desk research covers government statistics, regulatory publications, company filings, trade data, technical studies, industry associations, standards, public policy, and other authoritative sources. Every source used in the analysis is documented in the bibliography.
- Market Sizing and Forecasting: Market estimates combine historical performance, demand indicators, pricing and volume trends, segment shares, company participation, country-level growth, adoption patterns, investment activity, and barriers to market expansion.
- Data Validation and Update Cycle: Findings are validated by comparing primary interviews with public data, company activity, regulatory changes, trade patterns, and industry developments. Regular updates review new product launches, capacity changes, partnerships, approvals, and shifts in commercial adoption.
Segmentation
What is the report’s scope and coverage?
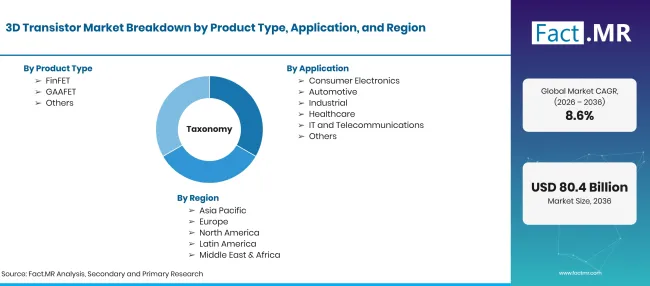
Factmr 3D Transistor Market Taxonomy | Source: Fact.MR
| Attribute | Details |
|---|---|
| Quantitative Units | USD billion in 2026 to USD billion by 2036 at CAGR |
| Market Definition | Transistors with a three-dimensional gate structure, including FinFET and gate-all-around designs, sold as fabricated wafers or finished chips for logic and memory devices. Demand covers consumer, automotive, industrial, healthcare and telecommunications uses. |
| Product Type | FinFET; GAAFET; Others |
| Application | Consumer Electronics; Automotive; Industrial; Healthcare; IT and Telecommunications; Others |
| Technology Node | 5nm; 7nm; 10nm; 14nm; Others |
| End-User | Foundries; Integrated Device Manufacturers; Others |
| Regions Covered | North America; Latin America; Western Europe; Eastern Europe; East Asia; South Asia & Pacific; Middle East & Africa |
| Countries Covered | Germany; Brazil; United States; United Kingdom; Japan |
| Companies Profiled | Taiwan Semiconductor Manufacturing Company (TSMC); Samsung Electronics Co., Ltd.; Intel Corporation; GlobalFoundries Inc.; United Microelectronics Corporation (UMC); Rapidus Corporation |
| Forecast Period | 2026 to 2036 |
| Approach | Hybrid top-down and bottom-up approach using fab capacity by node; wafer starts and pricing by architecture; node migration rates; end-use chip demand; and company process roadmaps. |
Source: Fact.MR analysis. Updated Oct 21, 2026
How is the market segmented?
-
By Product Type
- FinFET
- GAAFET
- Others
-
By Application
- Consumer Electronics
- Automotive
- Industrial
- Healthcare
- IT and Telecommunications
- Others
-
By Technology Node
- 5nm
- 7nm
- 10nm
- 14nm
- Others
-
By End-User
- Foundries
- Integrated Device Manufacturers
- Others
-
By Region
- North America
- Latin America
- Western Europe
- Eastern Europe
- East Asia
- South Asia & Pacific
- Middle East & Africa
Frequently Asked Questions
How big is the 3D transistor market in 2026?
What is the CAGR of the 3D transistor market from 2026 to 2036?
Which product type leads the 3D transistor market?
Which application leads the 3D transistor market?
Which technology node leads the 3D transistor market?
Which end-user leads the 3D transistor market?
Which country will grow the most in the 3D transistor market?
Who are the main companies in the 3D transistor market?
Who worked on this report


Preview the report firsthand - request a free sample
Free SampleGet the brochure for pricing and purchase details
Download PDF