- Market Value (2025): USD 223.1 Mn
- Estimated Value (2026): USD 250.0 Mn
- Forecast Value (2036): USD 780.0 Mn
- CAGR (2026-2036): 12.1%
What is the 3D Virtual Booths Market forecast to be worth by 2036?
USD 250.0 million in 2026 to USD 780.0 million by 2036 at 12.1% CAGR.
- The 3D virtual booths market was valued at USD 223.1 million in 2025 as spending moved toward hybrid event continuity and persistent digital showrooms.
- Demand is projected to increase from USD 250.0 million in 2026 to USD 780.0 million by 2036.
- The market is forecast to record 12.1% CAGR from 2026 to 2036 as organizers seek booth formats that connect navigation with measurable follow-up actions.
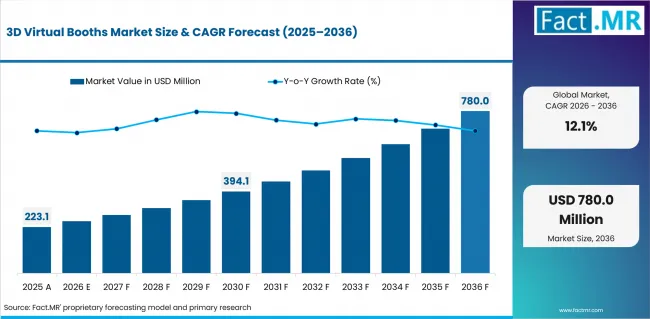
3d Virtual Booths Market Value Analysis | Source: Fact.MR
What are the defining numbers behind 3D Virtual Booths Market growth?
USD 530.0 million absolute opportunity by 2036, led by Template 3D booths and Live chat alongside Fully virtual expo and Per booth license models.
- Demand Drivers in the Market
- Hybrid event continuity makes 3D booths useful after a live event ends. Organizers can keep product media and meeting routes active across repeat programs.
- Persistent digital showrooms give exhibitors a reusable branded space. The format is expected to support repeat engagement when content updates remain easy.
- Global audience access is expected to widen the value of virtual booth investments. Remote visitors can review products without depending on a physical trade-fair visit.
- Measurable content interaction helps procurement compare booth performance after deployment. Click paths and meeting requests make the purchase easier to judge.
- Key Segments Analyzed
- By Booth Environment: Template 3D booths are projected to hold 34.0% share in 2026. Standard layouts reduce setup time for recurring event programs.
- By Interaction Feature: Live chat is expected to account for 26.0% share in 2026. Exhibitors need immediate contact inside the booth experience.
- By Event Model: Fully virtual expo is anticipated to capture 30.0% share in 2026. It gives organizers the clearest use case for a complete online booth environment.
- By Buyer: Event platforms are forecast to represent 28.0% share in 2026. Platform operators can package booths with registration and exhibitor management.
- By Pricing Model: Per booth license is estimated to command 32.0% share in 2026. Customers prefer a direct price tied to exhibitor count and booth delivery.
- Analyst Opinion at Fact.MR
- Shambhu Nath Jha, Senior Analyst at Fact.MR states “3D virtual booth providers must prove that visitors can move from product discovery to a useful action without confusion. Stronger offers are expected to combine clear booth navigation and documented follow-up paths. A longer feature menu does not solve the visitor route by itself.”
- Strategic Implications
- Event organizers can structure booth routes around a focused product set and clear meeting actions. This approach keeps the booth aligned with the commercial role already supported by digital signage systems in physical venues.
- Platform providers benefit from separating 3D booth development from chat and analytics support. Clear service boundaries allow customers to compare the booth layer more easily with web conferencing and registration tools.
- Enterprise video and live product demo software add value when the visitor journey remains simple. Before expanding the program, agencies need to test that journey across several event scenarios.
UAE is expected to record a 12.8% CAGR as hybrid participation remains important to international events. USA is forecast to post a 12.1% CAGR through measurement-led exhibitor procurement. Japan is anticipated to reach 12.0% CAGR through compact and reliable booth operation. United Kingdom is projected to record 11.8% CAGR through recurring exhibitions and managed-service demand. Germany is estimated to register 11.5% CAGR through technically detailed trade-fair programs.
How does the 3D Virtual Booths Market break down by segment?
Template 3D booths are expected to lead Booth Environment at 34.0% share. Live chat is projected to lead Interaction Feature at 26.0% share in 2026.
Which booth environment dominates?
Template 3D booths are projected to account for 34.0% share in 2026.
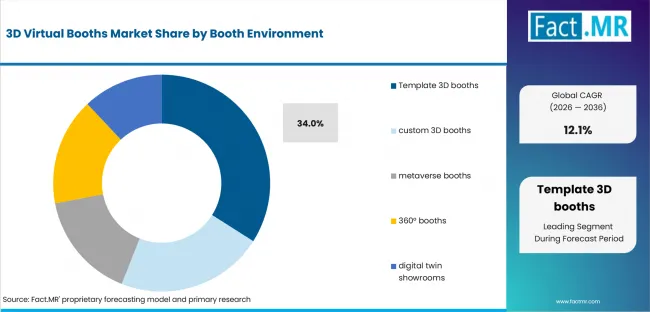
3d Virtual Booths Market Analysis By Booth Environment | Source: Fact.MR
Template 3D booths offer a practical balance between visual appeal and deployment speed. Organizers can adapt colors, logos and product areas without commissioning a fully custom environment. Custom booths remain suited to flagship events, while metaverse formats target more immersive programs. Digital twin showrooms gain attention when accurate product representation carries greater value than decorative design.
Why does Live chat lead Interaction Feature?
Live chat is expected to hold 26.0% share in 2026.
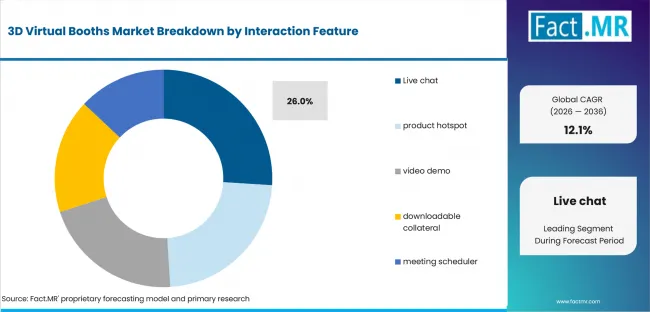
3d Virtual Booths Market Analysis By Interaction Feature | Source: Fact.MR
Visitors often require clarification before booking a meeting or requesting product information. Live chat creates that immediate connection without interrupting the booth journey. Video demonstrations and product hotspots provide self-guided engagement, whereas meeting schedulers support later conversations. Its leading position reflects the importance of real-time human assistance during virtual events.
What supports Fully virtual expo within Event Model?
Fully virtual expo is anticipated to capture 30.0% share in 2026.
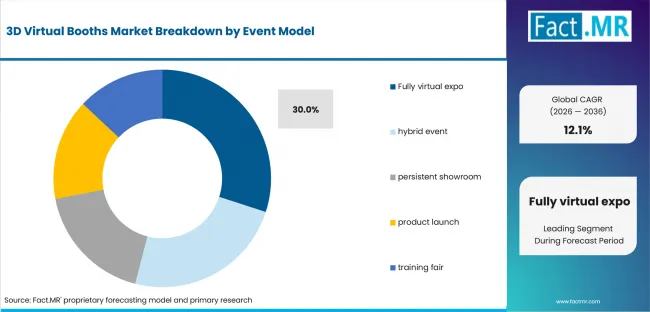
3d Virtual Booths Market Analysis By Event Model | Source: Fact.MR
A fully virtual expo brings exhibitors, sessions, networking and visitor activity into one digital setting. This model works well for geographically dispersed audiences and programs without a physical venue. Hybrid events use virtual booths as an extension of an onsite show. Persistent showrooms operate for longer periods, while training fairs usually focus on smaller and more specialized audiences.
How do Event platforms shape Buyer demand?
Event platforms are forecast to represent 28.0% share in 2026.
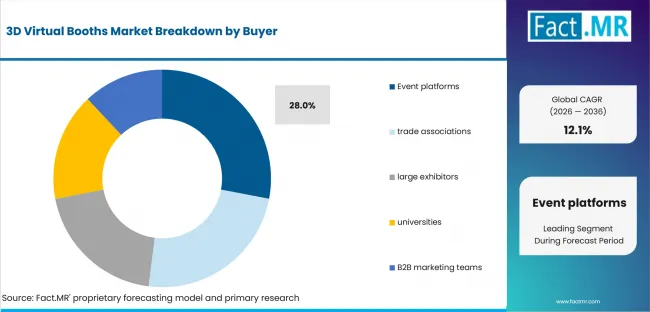
3d Virtual Booths Market Analysis By Buyer | Source: Fact.MR
Event platforms purchase 3D booth capabilities to strengthen a broader event technology package. Integration with registration, analytics and exhibitor management makes the booth easier to sell and operate. Large exhibitors may buy directly for recurring campaigns, while trade associations use the format for member events. Universities and marketing departments create additional demand for recruitment, education and product-launch programs.
Why does Per booth license lead Pricing Model?
Per booth license is estimated to command 32.0% share in 2026.
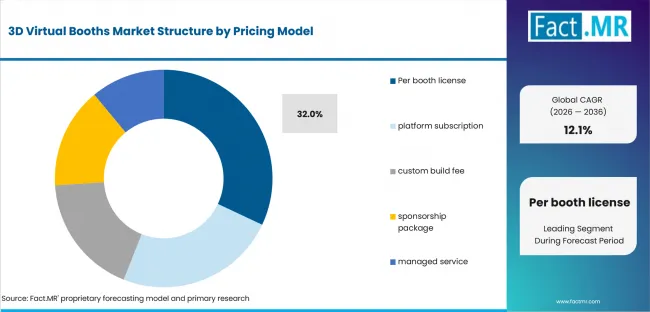
3d Virtual Booths Market Analysis By Pricing Model | Source: Fact.MR
Per booth licensing aligns closely with the way organizers package and resell exhibitor participation. Costs can be assigned to each booth, making budgeting and sponsor pricing easier to manage. Subscription plans are more attractive for companies running several events during the year. Managed services suit customers that prefer external support for design, setup and event-day delivery.
What is accelerating 3D Virtual Booths Market adoption, and what is holding it back?
Demand is growing as hybrid events and virtual showrooms remain active for longer periods. High content costs and limited conversion into actual sales may slow adoption.
Drivers Impact Analysis
| DRIVER | (~) % IMPACT ON CAGR | GEOGRAPHIC RELEVANCE | IMPACT TIMELINE |
|---|---|---|---|
| Hybrid event continuity | +3.3% | China and UAE | Short term (<=2 years) |
| Persistent digital showrooms | +2.5% | Mature exhibition markets | Short term (<=2 years) |
| Global audience access | +1.9% | Global | Medium term (2-4 years) |
| Measurable content interaction | +1.3% | North America and Europe | Medium term (2-4 years) |
Source: Fact.MR analysis. Updated Jul 28, 2026
- Hybrid event continuity: Hybrid programs are expected to create demand where event owners want booth assets to remain useful after live sessions end. Reusable booth paths reduce repeat setup work and make visitor follow-up easier to audit.
- Persistent digital showrooms: Persistent showrooms are projected to support demand when exhibitors need always-available product spaces. Their value improves when updates and meeting requests remain inside one booth workflow.
- Global audience access: Remote participation is anticipated to widen booth use where travel budgets reduce physical attendance. A simple 3D environment helps global visitors review products on common devices.
- Measurable content interaction: Interaction analytics are expected to strengthen the purchase case when exhibitors can track visits and meeting requests. This evidence separates useful booth engagement from general web traffic.
Opportunity Impact Analysis
| OPPORTUNITY | (~) % IMPACT ON CAGR | GEOGRAPHIC RELEVANCE | IMPACT TIMELINE |
|---|---|---|---|
| Digital-twin product demos | +2.2% | USA and UK | Short term (<=2 years) |
| Template libraries by industry | +1.6% | Germany and Japan | Medium term (2-4 years) |
| Interoperable avatar and meeting systems | +1.1% | China and UAE | Medium term (2-4 years) |
Source: Fact.MR analysis. Updated Jul 28, 2026
- Digital-twin product demos: Digital-twin demos are expected to create opportunity when exhibitors need product depth without shipping equipment to every event.
- Template libraries by industry: Template libraries are projected to lower setup time for organizers that repeat booth categories across events. The opportunity improves when libraries reflect real exhibitor use cases and do not borrow generic themes from alternative retailing technologies.
- Interoperable avatar and meeting systems: Interoperability is anticipated to improve upgrade potential when avatars and meeting tools move across event environments. The advantage remains limited if added features slow navigation or weaken visitor follow-up.
Restraints Impact Analysis
| RESTRAINT | (~) % IMPACT ON CAGR | GEOGRAPHIC RELEVANCE | IMPACT TIMELINE |
|---|---|---|---|
| High custom-content cost | -2.3% | Cost-sensitive regional markets | Short term (<=2 years) |
| Visitor device limitations | -1.7% | Highly regulated venues | Medium term (2-4 years) |
| Weak conversion from exploration to sales action | -1.2% | Global | Short term (<=2 years) |
Source: Fact.MR analysis. Updated Jul 28, 2026
- High custom-content cost: Custom 3D content is expected to slow adoption when the event owner cannot reuse assets across several programs. Cost pressure rises when support work is not fixed before procurement.
- Visitor device limitations: Device limits are anticipated to restrain use where visitors rely on older browsers or low bandwidth. Providers must keep loading paths simple and define fallback options before launch.
- Weak conversion from exploration to sales action: Weak conversion is expected to reduce confidence when booth visits do not lead to chat or meetings. Event owners need clear calls to action so exploration becomes a commercial step.
Which countries are scaling 3D Virtual Booths Market fastest?
The country comparison is defined by how each market uses virtual booths. China and UAE form the upper pair as repeat events favor reusable booth formats. USA and Japan remain close to the global rate through measurement-led procurement and reliable compact systems. United Kingdom and Germany record steadier growth as customers test managed-service models and technical execution standards.
- UAE remains close to China as international events require booth experiences for local and remote visitors. Providers are expected to compete on deployment speed and live assistance.
- USA tracks at the global CAGR level where exhibitors ask for proof that digital booths create measurable follow-up. Analytics and meeting requests are expected to guide procurement.
- Japan follows a reliability-led route where compact booth layouts and consistent loading matter during product-focused events. Customers are expected to prefer controlled experiences that reduce staff support.
- UK demand is expected to develop through recurring exhibitions and managed-service event programs. The market favors providers that refresh content between shows.
- Germany records a measured position as technical trade fairs require clear product navigation. Booth providers must convert 3D scenes into practical inspection points for exhibitors.
Comparable CAGRs can therefore create different market-entry conditions across these countries. Deployment timing depends on event frequency and whether the booth creates a clear path from exploration to follow-up.
The full report provides country-level CAGR analysis across North America and Latin America. It covers Europe and East Asia as separate regional blocks. South Asia & Oceania and the Middle East & Africa complete the regional view.
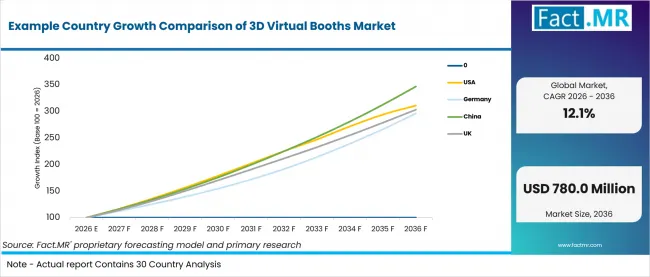
Example Country Growth Comparison Of 3d Virtual Booths Market | Source: Fact.MR
| Country | CAGR (2026-2036) |
|---|---|
| UAE | 12.8% |
| USA | 12.1% |
| Japan | 12.0% |
| UK | 11.8% |
| Germany | 11.5% |
Source: Fact.MR analysis. Updated Jul 28, 2026
What gives China the strongest growth outlook?
16.3% CAGR, supported by recurring exhibitions and reusable booth programs.
China benefits from a large schedule of repeat exhibitions where organizers can reuse the same booth framework across several events. This creates demand for template libraries, faster content updates and standard meeting paths. Providers that reduce rebuilding work are likely to gain an advantage, while highly customized environments may face slower approval because of longer production cycles.
Why is the UAE expanding rapidly?
12.8% CAGR, driven by international exhibitors and hybrid participation.
The UAE market is shaped by events that attract visitors and exhibitors from several countries at once. Virtual booths help extend participation beyond the physical venue and support audiences that cannot travel. Multilingual interaction, quick deployment and reliable browser performance are therefore central purchasing factors. Heavy visual designs may lose appeal when they increase loading time across different devices.
What defines adoption in the USA?
12.1% CAGR, supported by measurable exhibitor returns and follow-up activity.
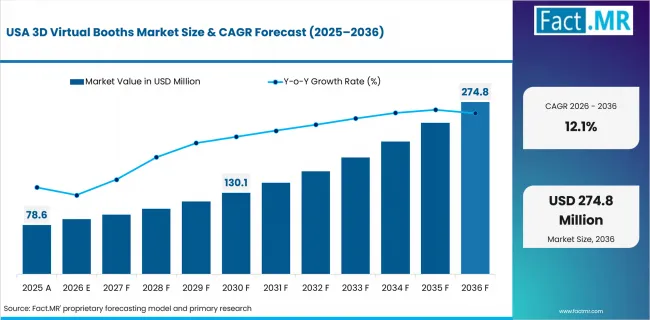
3d Virtual Booths Market Country Value Analysis | Source: Fact.MR
USA buyers are less likely to judge a booth only by its visual quality. Procurement decisions increasingly depend on whether visitors start chats, book meetings or enter a documented sales process. This gives analytics and CRM connections a stronger role in vendor selection. Providers must show that booth engagement can produce useful commercial actions after the event ends.
How is Japan building its market position?
12.0% CAGR, led by compact booth design and dependable performance.
Japan favors controlled digital experiences that present product information without adding unnecessary navigation steps. Compact layouts, fast loading and predictable operation fit events where visitors expect a clear route through technical content. Vendors with stable booth templates and simple meeting options may perform better than those relying on large immersive environments that require additional user support.
What is sustaining demand in the UK?
11.8% CAGR, supported by recurring exhibitions and managed-service use.
Many UK organizers operate repeated event programs but do not maintain large in-house 3D production teams. Managed-service providers can fill this gap by updating booth content, handling setup and supporting exhibitors between shows. Growth depends on making each digital space reusable. Confidence may weaken when visitor exploration produces limited qualified leads or few scheduled conversations.
Why does Germany follow a more technical path?
11.5% CAGR, driven by product-heavy trade fairs and detailed visitor guidance.
Germany’s opportunity comes from exhibitions where complex machinery, engineering systems and industrial products require structured explanation. Virtual booths can support this process through technical hotspots, product views and guided inspection points. Buyers are likely to demand precise content and dependable navigation before approval. Customization costs remain a concern when technical scenes require several rounds of revision.
Who leads the 3D Virtual Booths Market?
vFairs and 6Connex are the most relevant providers, while Matterport adds 3D digital-twin expertise.
vFairs offers virtual event platforms with exhibitor booths, registration and engagement tools. 6Connex provides virtual venues and online event spaces. Matterport supports detailed 3D showrooms through digital-twin technology. MootUp offers immersive event experiences, while ExpoPlatform provides exhibition and exhibitor-management solutions.
Competition through 2036 will depend on simple booth navigation, stable live interaction and clear visitor follow-up. Buyers will also compare loading speed, device support, content-update costs and platform integration. Providers with reusable booth designs and easy setup are likely to gain stronger demand.
Which companies are the key providers?
Key companies include vFairs; 6Connex; Matterport; MootUp; ExpoPlatform.
- vFairs
- 6Connex
- Matterport
- MootUp
- ExpoPlatform
What is the report’s scope and coverage?
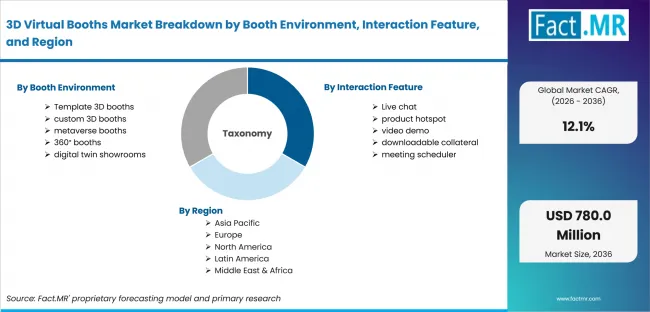
3d Virtual Booths Market Breakdown By Booth Environment, Interaction Feature, And Region | Source: Fact.MR
| Attribute | Details |
|---|---|
| Quantitative Units | USD million in 2026 to USD million by 2036 at CAGR |
| Market Definition | Digital three-dimensional exhibitor environments used in virtual, hybrid or persistent product-showcase programs when provided as a commercial event solution |
| Booth Environment | Template 3D booths; custom 3D booths; metaverse booths; 360° booths; digital twin showrooms |
| Interaction Feature | Live chat; product hotspot; video demo; downloadable collateral; meeting scheduler |
| Event Model | Fully virtual expo; hybrid event; persistent showroom; product launch; training fair |
| Buyer | Event platforms; trade associations; large exhibitors; universities; B2B marketing teams |
| Pricing Model | Per booth license; platform subscription; custom build fee; sponsorship package; managed service |
| Regions Covered | North America; Latin America; Europe; East Asia; South Asia & Oceania; Middle East & Africa |
| Countries Covered | USA; Canada; Brazil; Mexico; Germany; UK; France; Italy; Spain; South Korea; Japan;Australia & New Zealand; GCC Countries; South Africa; UAE |
| Key Companies Profiled | vFairs; 6Connex; Matterport; MootUp; ExpoPlatform |
| Forecast Period | 2026 to 2036 |
| Approach | Hybrid top-down and bottom-up approach using event-program demand; booth environment choices; interaction features; event models; buyer groups; pricing models; country growth; provider participation; and adoption barriers |
Source: Fact.MR analysis. Updated Jul 28, 2026
How is the market segmented?
-
By Booth Environment:
- Template 3D booths
- custom 3D booths
- metaverse booths
- 360° booths
- digital twin showrooms
-
By Interaction Feature:
- Live chat
- product hotspot
- video demo
- downloadable collateral
- meeting scheduler
-
By Event Model:
- Fully virtual expo
- hybrid event
- persistent showroom
- product launch
- training fair
-
By Buyer:
- Event platforms
- trade associations
- large exhibitors
- universities
- B2B marketing teams
-
By Pricing Model:
- Per booth license
- platform subscription
- custom build fee
- sponsorship package
- managed service
-
By Region:
- North America
- USA
- Canada
- Latin America
- Brazil
- Mexico
- Rest of Latin America
- Europe
- Germany
- UK
- France
- Italy
- Spain
- Rest of Europe
- East Asia
- South Korea
- Japan
- China
- South Asia & Oceania
- India
- Australia & New Zealand
- Rest of South Asia & Oceania
- Middle East & Africa
- GCC Countries
- South Africa
- UAE
- Rest of Middle East & Africa
- North America
Bibliography
- Brandlive. (2025, January 23). Brandlive acquires 6Connex, expanding virtual events capability. Brandlive.
- vFairs. (2025, December 12). vFairs wins multiple awards at the 13th annual BizBash Event Experience Awards. vFairs.
- CoStar Group, Inc. (2025, February 28). CoStar Group completes acquisition of Matterport, ushering in a new era of 3D digital twins and AI-powered real estate innovation. CoStar Group, Inc.
- European Commission. (2025, March 31). Commission launches “Virtual Worlds Toolbox” to help citizens explore new digital spaces. Shaping Europe’s Digital Future.
This Report Answers
- The report provides strategic intelligence on the 3D Virtual Booths Market across Booth Environment and Interaction Feature choices that shape virtual exhibition programs.
- Segment analysis covers Template 3D booths and Live chat as the 2026 share leaders. The section explains how Fully virtual expo and Per booth license models shape adoption.
- Country outlook evaluates UAE alongside USA and Japan. UK and Germany complete the growth comparison across the profiled markets.
- Competitive analysis profiles vFairs and 6Connex alongside Matterport. MootUp and ExpoPlatform complete the active provider set.
- Use-case assessment covers live interaction and persistent showroom deployment. The review considers adjacent tools such as digital ticketing where event technology choices overlap.
What does the 3D Virtual Booths Market cover?
Digital three-dimensional exhibitor environments are used in virtual, hybrid or persistent product-showcase programs where booth navigation and interaction create commercial value.
The 3D Virtual Booths Market covers configured booth environments and interactive hotspots packaged for exhibition workflows. Coverage includes solutions that support product discovery and representative contact. The market includes 3D booth assets when they are sold as part of a usable event solution.
The market differs from general corporate websites and basic video meetings. The booth must organize product content inside an exhibitor environment. General websites and streaming media services remain outside the valuation unless they directly support the defined 3D booth workflow.
What is included in the scope?
3D virtual booth solutions are used by event platforms and trade associations. Large exhibitors, universities and B2B marketing teams are included.
The scope includes Booth Environment and Interaction Feature alongside Event Model and Buyer. Pricing Model completes the segmentation structure. Coverage spans Template 3D booths and custom 3D booths. Live chat, product hotspots and meeting schedulers are included.
Components remain in scope when they are delivered as part of the complete 3D virtual booth solution. Broader digital marketing software is included only when it directly supports booth interaction or post-event follow-up.
What is excluded from the scope?
General corporate websites and video-conference subscriptions remain outside the scope. Consumer metaverse games and physical booth construction are excluded as well.
The scope excludes unrelated venue construction and floor-space rental. The value of the event or exhibitor business in which the booth is used is not counted. Company revenue without a clear connection to virtual booth delivery is excluded.
How Was the Analysis Built?
The analysis draws on 120+ sources, 35+ company portfolios, 25+ countries, and more than 20 industry interviews.
- Primary Research: Primary research includes discussions with manufacturers, service providers, technology developers, distributors, end users, procurement teams, and subject-matter experts. These conversations examine purchasing priorities, product adoption, operational challenges, approval requirements, competitive positioning, and the factors that influence wider market acceptance.
- Desk Research: Desk research covers government statistics, regulatory publications, company filings, trade data, technical studies, industry associations, standards, public policy, and other authoritative sources. Every source used in the analysis is documented in the bibliography.
- Market Sizing and Forecasting: Market estimates combine historical performance, demand indicators, pricing and volume trends, segment shares, company participation, country-level growth, adoption patterns, investment activity, and barriers to market expansion.
- Data Validation and Update Cycle: Findings are validated by comparing primary interviews with public data, company activity, regulatory changes, trade patterns, and industry developments. Regular updates review new product launches, capacity changes, partnerships, approvals, procurement trends, and shifts in commercial adoption.
Frequently Asked Questions
Which Booth Environment leads the market?
Which Interaction Feature leads the market?
Which Event Model leads the market?
Which Buyer leads the market?
Which Pricing Model leads the market?
Which country records the highest listed CAGR?
What is the primary driver in this market?
What is the main restraint?
Why do Template 3D booths lead demand?
Who worked on this report


Preview the report firsthand - request a free sample
Free SampleGet the brochure for pricing and purchase details
Download PDF