- Market Value (2025): USD 769.2 Mn
- Estimated Value (2026): USD 980 Mn
- Forecast Value (2036):USD 11039 Mn
- CAGR (2026-2036): 27.4%
What is the AI Agent Evaluation & Simulation Platforms Market forecast to be worth by 2036?
USD 980 million in 2026 to USD 11,039 million by 2036 at 27.4% CAGR.
- The AI agent evaluation & simulation platforms market crossed a valuation of USD 769.2 million in 2025.
- Demand is projected to increase from USD 980 million in 2026 to USD 11039 million by 2036.
- The market is forecast to record 27.4% CAGR from 2026 to 2036 as software teams and regulated enterprises need repeatable release evidence.
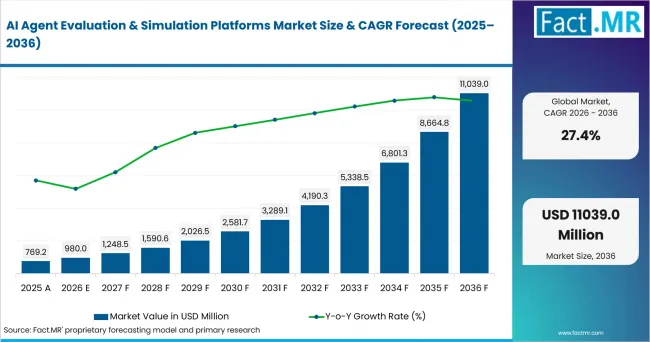
Ai Agent Evaluation & Simulation Platforms Market Value Analysis | Source: Fact.MR
What are the defining numbers behind AI Agent Evaluation & Simulation Platforms Market growth?
USD 10,059 million absolute opportunity by 2036, led by Evaluation & benchmarking and Cloud/SaaS alongside Software & internet users.
- Demand Drivers in the Market
- AI engineering teams need evaluation suites that compare agent answers with business goals before production release.
- Product teams need simulation environments that expose failed tool calls and incomplete task sequences before users encounter them.
- Security teams need red-teaming workflows for tool-using agents. NIST reported in March 2026 that a red-teaming competition generated more than 250,000 attack attempts from over 400 participants.
- Compliance teams need trace records and scoring histories so reviewers can explain why an agent passed or failed a release gate.
- Key Segments Analyzed
- By Capability: Evaluation & benchmarking is expected to hold 31.0% share in 2026 owing to its role in release decisions.
- By Deployment: Cloud/SaaS is projected to account for 72.0% share in 2026 because teams need quick setup and shared dashboards.
- By End-Use: Software & internet is anticipated to capture 34.0% share in 2026 as agent-based applications enter product workflows first.
- By Organization Size: Large enterprises are estimated to represent 58.0% share in 2026 due to policy review and audit needs.
- Analyst Opinion at Fact.MR
- Shambhu Nath Jha, Principal Consultant at Fact.MR states, “Agent evaluation is becoming a release discipline. Enterprise teams are expected to judge agents on task completion and safe tool use before rollout. Providers that combine simulation and observability are likely to earn more platform commitments.”
- Strategic Implications
- Enterprise AI leads should define pass/fail rules for tool calls, task completion and escalation before buying evaluation platforms.
- Risk teams should connect evaluation records with AI governance reviews. The European Commission stated in February 2025 that the first AI Act rules had started to apply, including prohibited practices and AI literacy provisions.
- Platform providers should connect synthetic simulations with production traces because buyers need evidence across test and live settings.
- Investors should separate workflow-level evaluation exposure from generic chatbot testing and model-monitoring tools.
Singapore is estimated to record 29.5% CAGR through 2036, led by national AI programs and assurance work. Canada is projected to post 28.8% CAGR as business AI use rises across services. The United States is anticipated to advance at 28.0% CAGR due to software-sector scale. The United Kingdom is forecast to hold 27.5% CAGR as large businesses formalize AI review. Germany is expected to reach 27.4% CAGR as industrial enterprises add AI controls. France is estimated to post 27.1% CAGR through information and communication use.
How does the AI Agent Evaluation & Simulation Platforms Market break down by segment?
Evaluation & benchmarking leads at 31.0%; Cloud/SaaS leads at 72.0%.
Which capability dominates?
Evaluation & benchmarking is projected to account for 31.0% share in 2026.
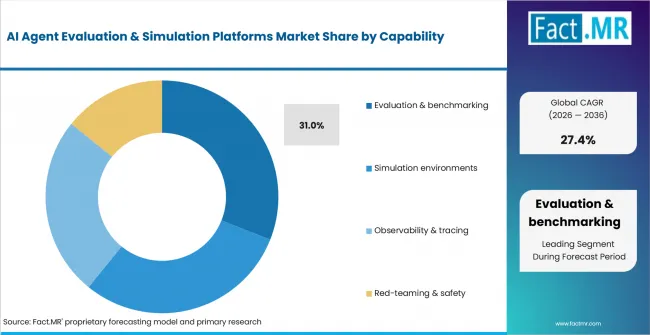
Ai Agent Evaluation & Simulation Platforms Market Analysis By Capability | Source: Fact.MR
Evaluation & benchmarking leads the Capability segment because enterprises need a formal release gate before agents operate inside live applications. Structured scoring helps teams compare agent behavior, identify weaknesses and document readiness before deployment. NIST’s March 2026 agent-security findings provide external context for the importance of robust and continuously evolving security evaluations.
What leads the Deployment segment?
Cloud/SaaS is expected to hold 72.0% share in 2026.
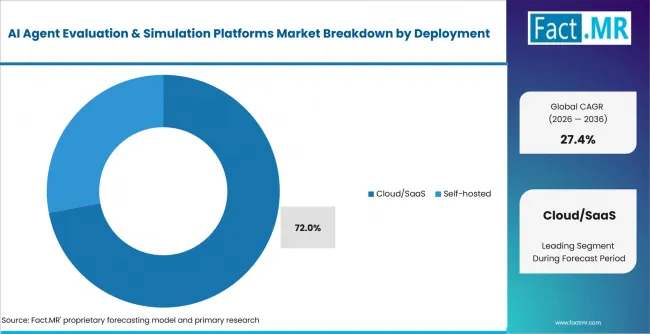
Ai Agent Evaluation & Simulation Platforms Market Analysis By Deployment | Source: Fact.MR
Cloud/SaaS leads the Deployment segment because engineering teams prefer shared scoring dashboards, hosted evaluation runs and easier collaboration across locations. Eurostat reported in December 2025 that 20.0% of EU enterprises with at least 10 employees used AI technologies in 2025, indicating a broad and growing enterprise base for AI adoption.
How does End-Use shape demand?
Software & internet is anticipated to lead with 34.0% share in 2026.
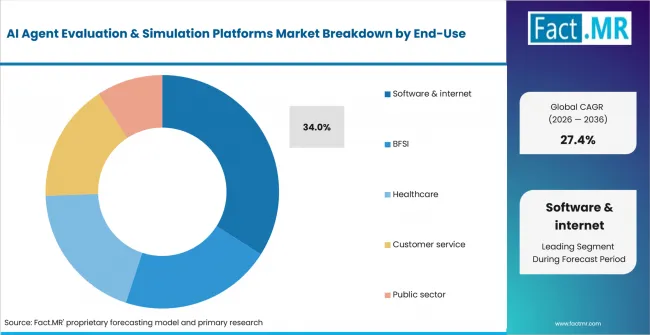
Ai Agent Evaluation & Simulation Platforms Market Analysis By End Use | Source: Fact.MR
Software & internet leads the End-Use segment because these companies are among the earliest to ship agent features into products, support workflows and developer environments. Their rapid release cycles increase demand for repeatable evaluation, tracing and safety checks before deployment, especially where customer-facing agents must perform consistently across changing tasks.
What supports Organization Size demand?
Large enterprises are estimated to represent 58.0% share in 2026.
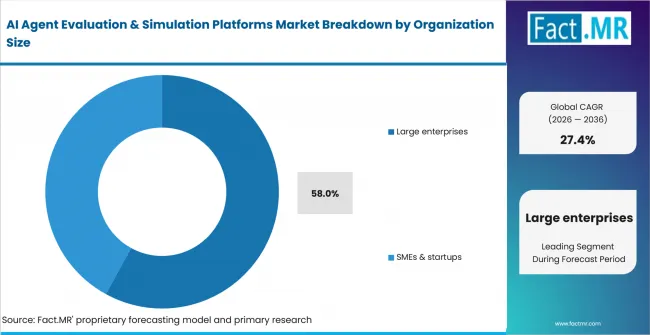
Ai Agent Evaluation & Simulation Platforms Market Analysis By Organization Size | Source: Fact.MR
Large enterprises lead the Organization Size segment because formal review teams require repeatable scoring, permission controls, escalation records and audit-ready evidence. Their broader governance needs favor platforms that combine simulations, human review queues and reporting tools, supporting more structured validation before autonomous agents are released into business-critical workflows.
What is accelerating AI Agent Evaluation & Simulation Platforms Market adoption, and what is holding it back?
Agent reliability testing drives it; benchmark validity and data controls restrain it.
Drivers Impact Analysis
| DRIVER | (~) % IMPACT ON CAGR | GEOGRAPHIC RELEVANCE | IMPACT TIMELINE |
|---|---|---|---|
| Agent reliability benchmarking | +5.0% | United States, Canada, United Kingdom | Short term (<= 2 years) |
| Multi-turn simulation environments | +4.3% | Software & internet clusters | Short term (<= 2 years) |
| Production observability and tracing | +3.9% | United States, Singapore, Germany | Medium term (2-4 years) |
| Red-teaming for tool-use agents | +3.2% | United States, United Kingdom, European Union | Medium term (2-4 years) |
| Regulated workflow evidence | +2.5% | BFSI, healthcare, public sector | Long term (>= 4 years) |
- Agent reliability benchmarking: Agent teams need repeatable scoring before a release enters customer or employee workflows. Benchmarks must evaluate task completion, tool selection and refusal behavior. Platform demand is expected to rise where failures carry support cost or compliance risk.
- Production observability and tracing: Trace review turns agent activity into evidence for engineers and risk teams. Developers need span-level records when an agent selects a tool or changes direction. Vendors that connect traces with evaluations are expected to move deeper into release workflows.
- Red-teaming for tool-use agents: Tool-use agents create a broader attack surface than standard chat interfaces. Security teams therefore need adversarial tests that cover instructions, tool calls and external actions. Evaluation platforms are expected to add more red-team replay and attack clustering.
- Regulated workflow evidence: BFSI, healthcare and public sector teams need evaluation records that survive internal audit. Scores alone are not enough when a release committee needs traces and prompts. Platforms with exportable review logs are expected to gain approval advantage.
Opportunity Impact Analysis
| OPPORTUNITY | (~) % IMPACT ON CAGR | GEOGRAPHIC RELEVANCE | IMPACT TIMELINE |
|---|---|---|---|
| CI/CD evaluation automation | +2.2% | Software engineering teams | Short term (<= 2 years) |
| Domain-specific simulation sets | +1.8% | BFSI and healthcare | Medium term (2-4 years) |
| Self-hosted regulated deployments | +1.4% | Europe, Canada, public sector | Medium term (2-4 years) |
| Assurance-ready reporting | +1.0% | European Union and Singapore | Long term (>= 4 years) |
- Domain-specific simulation sets: Generic tasks rarely reflect customer service, credit review or clinical administration. Providers can create stronger differentiation by offering scenario packs that match the buyer’s workflow. Domain coverage becomes valuable when evaluation results feed release decisions.
- Self-hosted regulated deployments: Some enterprises cannot send traces or user logs to a hosted environment. Self-hosted options therefore create opportunity in regulated accounts, even though Cloud/SaaS leads the market. Stronger privacy controls can shorten legal review for sensitive programs.
- Assurance-ready reporting: Singapore and the European Union are shaping demand for evidence around AI safety and accountability. Reporting templates are expected to become more valuable when procurement teams compare vendors. Platforms that convert tests into summaries can reduce approval friction.
Restraints Impact Analysis
| RESTRAINT | (~) % IMPACT ON CAGR | GEOGRAPHIC RELEVANCE | IMPACT TIMELINE |
|---|---|---|---|
| Weak benchmark validity | -2.0% | Global enterprise users | Short term (<= 2 years) |
| Data exposure and privacy review | -1.6% | Europe, Canada, healthcare | Short term (<= 2 years) |
| Undocumented agent tool behavior | -1.3% | Software & internet, BFSI | Medium term (2-4 years) |
| Cloud procurement scrutiny | -0.9% | Public sector and regulated accounts | Long term (>= 4 years) |
- Weak benchmark validity: Static benchmarks can miss failures that appear only during long workflows. NIST stated in March 2026 that AI security evaluations are a continuously moving target as models and attacks change. Buyers are expected to delay expansion until tests match operating conditions.
- Data exposure and privacy review: Evaluation runs often include prompts, retrieved documents and user histories. Legal teams need clear controls before sensitive traces move into hosted tools. Procurement is expected to take longer where test data includes customer or patient information.
- Undocumented agent tool behavior: Many failures happen when an agent selects a tool or passes the wrong parameter. Platforms need detailed span capture to diagnose those issues. Thin logging limits trust in evaluation scores and slows internal approval.
Which countries are scaling AI Agent Evaluation & Simulation Platforms Market fastest?
- The country comparison spans 2.40 percentage points and forms three practical growth bands across the forecast period.
- Singapore remains 0.66 percentage point above Canada through national AI programs and assurance-oriented deployment work.
- Canada remains 0.87 percentage point above the United States as business AI adoption rises from a smaller installed base.
- The United States remains 0.43 percentage point above the United Kingdom due to large software teams and enterprise AI operations.
- The United Kingdom remains 0.13 percentage point above Germany because large-business AI use supports evaluation procurement.
- Germany remains 0.31 percentage point above France as industrial enterprises add AI review to cloud and automation programs.
- France closes the displayed range through rising AI use in information and communication services.
Comparable CAGRs create different entry conditions because enterprise AI use varies by country. Coverage includes North America, Latin America, Europe, East Asia, South Asia and Pacific, Middle East and Africa.
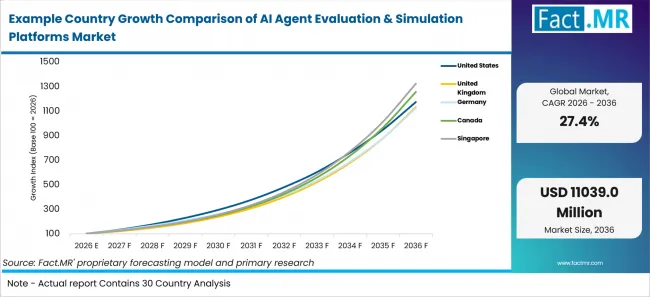
Example Country Growth Comparison Of Ai Agent Evaluation & Simulation Platforms Market | Source: Fact.MR
| Country | CAGR (2026-2036) |
|---|---|
| Singapore | 29.5% |
| Canada | 28.8% |
| United States | 28.0% |
| United Kingdom | 27.5% |
| Germany | 27.4% |
| France | 27.1% |
What supports Singapore adoption?
29.5% CAGR, supported by national AI programs and assurance-led deployment.
Singapore’s growth reflects a compact enterprise software base where public AI programs make testing visible before agents enter customer workflows. IMDA reported in October 2025 that SME AI adoption rose from 4.2% in 2023 to 14.5% in 2024. Vendors are expected to find demand where smaller teams need templates, traces and red-team results.
How is Canada scaling demand?
28.8% CAGR, shaped by wider business AI use and regulated-service buyers.
Canada’s outlook is tied to service-sector adoption and privacy review. Statistics Canada reported in May 2026 that 19.2% of businesses surveyed in the second quarter of 2026 had used AI to produce goods or deliver services over the preceding 12 months, up from 12.2% in the second quarter of 2025. Regulated accounts are expected to prefer tools that show goal completion, trace history and privacy controls.
What supports United States growth?
28.0% CAGR, backed by large-firm AI use and software-sector scale.
The United States benefits from software-platform scale and formal release processes. The U.S. Census Bureau reported in May 2026 that 37% of firms with at least 250 employees reported using AI in their business operations, based on BTOS data collected through May 3, 2026.
How is the United Kingdom developing demand?
27.5% CAGR, supported by large-business AI use and near-term adoption plans.
The United Kingdom is developing demand through large-business AI use and risk-aware procurement. ONS reported in January 2026 that 25.0% of UK businesses used AI in late December 2025, with 44.0% adoption among firms with at least 250 employees. Evaluation platforms are expected to gain attention where BFSI and public service teams need test histories.
What supports Germany adoption?
27.4% CAGR, led by enterprise AI use and industrial software governance.
Germany’s growth is shaped by industrial enterprises that require formal software controls. Destatis reported that 26.0% of German enterprises used AI in 2025, while large enterprises reached 57.0%.
How does France perform?
27.1% CAGR, associated with rising enterprise AI use and service-sector testing needs.
France closes the displayed range with rising enterprise AI use and service-sector testing demand. INSEE reported in July 2026 that 18.0% of French businesses used AI in 2025, and use reached 59.0% in information and communication. Vendors are expected to gain attention where French-language scenarios and audit trails match deployments.
Who leads the AI Agent Evaluation & Simulation Platforms Market?
LangChain, Inc. (LangSmith), Braintrust and Galileo as the most directly relevant evaluation-platform providers in the company set.
LangChain, Inc. (LangSmith) is tied to agent evaluation through LangSmith production traces and multi-turn scoring. Braintrust supports evaluation workflows with datasets, experiments and observability. Galileo adds agent metrics and evaluation workflows. Arize AI supports workflow inspection, while Patronus AI and Scale AI add benchmark and evaluation programs.
Which companies are the key providers?
Key companies include LangChain, Inc. (LangSmith), Braintrust, Galileo, Arize AI, Patronus AI and Scale AI.
- LangChain, Inc. (LangSmith)
- Braintrust
- Galileo
- Arize AI
- Patronus AI
- Scale AI
Bibliography
- European Commission. (2025, February 3). First rules of the Artificial Intelligence Act are now applicable.
- Eurostat. (2025, December 11). 20% of EU enterprises use AI technologies.
- Statistisches Bundesamt (Destatis). (2025, November 24). Qualitätsbericht – Nutzung von Informations- und Kommunikationstechnologie (IKT) in Unternehmen 2025 [Quality report – Use of information and communication technology (ICT) in enterprises 2025].
- Infocomm Media Development Authority. (2025, October 6). Singapore's digital economy at 18.6% of GDP, up from 14.9% in 2019; growth fuelled by accelerating digitalisation and AI adoption across sectors.
- National Institute of Standards and Technology. (2026, March 23). Insights into AI agent security from a large-scale red-teaming competition.
- Office for National Statistics. (2026, January 8). Business insights and impact on the UK economy: 8 January 2026.
- Arize AI. (2025, June 25). Arize Observe 2025 – Product Releases.
This Report Answers
- The report provides strategic intelligence on the AI Agent Evaluation & Simulation Platforms Market across Capability and Deployment choices that shape enterprise release controls.
- Segment analysis covers Evaluation & benchmarking and Cloud/SaaS as the share leaders within the 2026 market.
- Country outlook evaluates Singapore and Canada alongside the United States and the United Kingdom. Germany and France complete the growth comparison across the profiled markets.
- Competitive analysis profiles LangChain, Inc. (LangSmith) and Braintrust alongside Galileo and Arize AI. Patronus AI and Scale AI complete the provider set.
- Capability assessment covers Evaluation & benchmarking and Simulation environments. Observability & tracing and Red-teaming & safety complete the capability view.
What does the AI Agent Evaluation & Simulation Platforms Market cover?
AI agent evaluation and simulation platforms test whether agents finish business tasks safely. Coverage includes tools linked to AI agentic platforms, workflow-level scoring and production trace review. The market includes benchmarking, synthetic task simulation and safety testing where agents retrieve data or use external tools.
The market touches AI agent audit when evaluation outputs become proof for release approval. It also overlaps with frontier red-teaming where adversarial tests expose unsafe agent actions. Buyers usually treat these tools as release infrastructure for software, BFSI, healthcare and public-sector deployments.
What is included in the scope?
The scope includes platforms that evaluate agent behavior across full conversations and multi-step tasks. It includes ModelOps controls where agent release checks enter AI operations. It also includes reporting workflows tied to AI Act conformity when evidence supports regulated deployment review.
Cloud/SaaS and self-hosted deployments are included when they support scoring, trace capture and benchmark management. Related demand from AgentOps services is included where operating teams track agent activity after launch. Demand tied to code assurance is included when agents generate software artifacts that require evaluation.
What is excluded from the scope?
General chatbots, foundation model training and unrelated data-labeling services remain outside the scope. Ordinary AI generated content tools are excluded unless they include agent evaluation, simulation or trace scoring. The scope also excludes one-time manual reviews without reusable software or benchmark assets.
The market excludes basic prompt libraries and cloud-managed services that do not evaluate agent outcomes. Generic application monitoring remains outside the scope unless it captures agent-specific traces, tool calls and task-completion evidence. Consulting revenue without a direct link to reusable evaluation software is also excluded.
How Was the Analysis Built?
The analysis draws on 120+ sources, 35+ company portfolios, 25+ countries and more than 20 industry interviews.
- Primary Research: Primary research includes discussions with AI platform teams, software vendors, security reviewers, risk officers, product managers and procurement teams. These conversations examine release controls, evaluation setup, approval requirements and competitive positioning.
- Desk Research: Desk research covers government statistics, regulator publications, company announcements, technical studies, standards and public policy. Every source used is documented in the bibliography.
- Market Sizing and Forecasting: Market estimates combine historical performance, demand indicators, segment shares, company participation, country-level growth and barriers to market expansion.
- Data Validation and Update Cycle: Findings are validated against public data, company activity, regulatory changes, procurement patterns and software adoption. Regular updates review product launches, partnerships, approvals and shifts in commercial deployment.
What is the report’s scope and coverage?
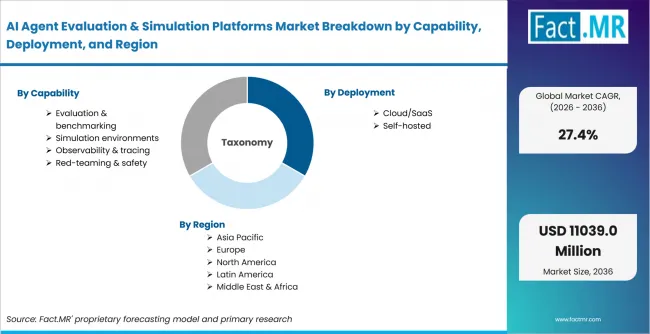
Ai Agent Evaluation & Simulation Platforms Market Breakdown By Capability, Deployment, And Region | Source: Fact.MR
| Attribute | Details |
|---|---|
| Quantitative Units | USD million in 2026 to USD million by 2036 at CAGR |
| Market Definition | Software platforms used to evaluate, simulate, red-team, observe and benchmark AI agents across multi-step tasks, tool calls, traces and business workflow outcomes |
| Capability | Evaluation & benchmarking; Simulation environments; Observability & tracing; Red-teaming & safety |
| Deployment | Cloud/SaaS; Self-hosted |
| End-Use | Software & internet; BFSI; Healthcare; Customer service; Public sector |
| Organization Size | Large enterprises; SMEs & startups |
| Regions Covered | North America; Latin America; Europe; East Asia; South Asia and Pacific; Middle East and Africa |
| Countries Covered | Singapore; Canada; United States; United Kingdom; Germany; France |
| Key Companies Profiled | LangChain, Inc. (LangSmith); Braintrust; Galileo; Arize AI; Patronus AI; Scale AI |
| Forecast Period | 2026 to 2036 |
| Approach | Hybrid top-down and bottom-up approach using AI adoption indicators; enterprise software spending patterns; agent deployment evidence; evaluation workflow requirements; country adoption patterns; deployment model mix; segment shares; company portfolio review; and public-source validation |
How is the market segmented?
-
By Capability:
- Evaluation & benchmarking
- Simulation environments
- Observability & tracing
- Red-teaming & safety
-
By Deployment:
- Cloud/SaaS
- Self-hosted
-
By End-Use:
- Software & internet
- BFSI
- Healthcare
- Customer service
- Public sector
-
By Organization Size:
- Large enterprises
- SMEs & startups
-
By Region:
- North America
- Latin America
- Europe
- East Asia
- South Asia and Oceania
- Middle East and Africa