- Market Value (2025): USD 124.4 Mn
- Estimated Value (2026): USD 131.1 Mn
- Forecast Value (2036): USD 205.8 Mn
- CAGR (2026-2036): 5.4%
What is the Canned Caviar Market forecast to be worth by 2036?
USD 131.1 million in 2026 to USD 205.8 million by 2036, at a 5.4% CAGR.
- The market reached USD 124.4 million in 2025.
- Demand is projected to increase from USD 131.1 million in 2026 to USD 205.8 million by 2036.
- The market is forecast to record a 5.4% CAGR from 2026 to 2036, creating an absolute opportunity of USD 74.7 million.
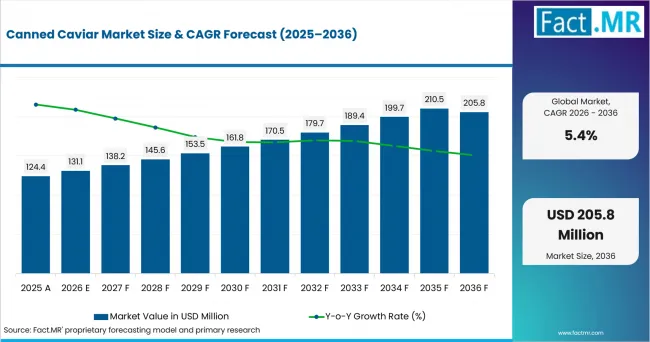
Canned Caviar Market Value Analysis | Source: Fact.MR
What are the defining numbers behind Canned Caviar Market growth?
USD 74.7 million absolute opportunity is expected between 2026 and 2036.
- Demand Drivers in the Market
- Premium seafood occasions support demand because caviar is usually bought for restaurants, entertaining, gifting and small-format indulgence rather than routine meal planning.
- Species identity and origin control are commercial requirements. CITES labelling and permit systems make traceable supply more valuable to retailers and foodservice buyers.
- Supermarkets and specialty online channels give canned caviar wider reach through small tins, refrigerated logistics, and product information that helps buyers compare grade and origin.
- Aquaculture supply is important because wild sturgeon trade is tightly controlled, while farmed production gives brands a more stable route to legal availability.
- Key Segments Analyzed
- By Type: Beluga Caviar is the leading type, accounting for 28.0% share in 2026.
- By Application: Supermarket leads with 32.8% share in 2026.
- Analyst Opinion at Fact.MR
- Buyer preference in canned caviar is shaped by trust as much as taste. Species name, tin integrity, storage conditions and sourcing documentation carry commercial weight because the product is high priced and easy to misrepresent. Suppliers gain an advantage when they make origin, grade, pack size and handling requirements clear across supermarket as well as specialty retail and foodservice channels. Shambhu Nath Jha, Sr. Consultant, Fact.MR.
- Strategic Implications
- Retailers should treat traceability, species information, and cold-chain handling as selling points as well as not only compliance details.
- Suppliers can differentiate through small tins, giftable formats, reliable documentation and clearer species-origin communication.
- Channel planning should reflect the split between premium supermarket shelves, specialist online retail, restaurants and seasonal entertaining demand.
The UK records the highest country CAGR at 7.8%, followed by Canada at 6.8%, Australia at 6.6% as well as the USA at 6.5% andGermany at 5.3% through 2036.
How does the Canned Caviar Market break down by segment?
Beluga Caviar leads Type with 28.0% share and Supermarket leads Application with 32.8% share in 2026.
Why does Beluga Caviar lead Type?
Beluga Caviar is projected to account for 28.0% share in 2026.
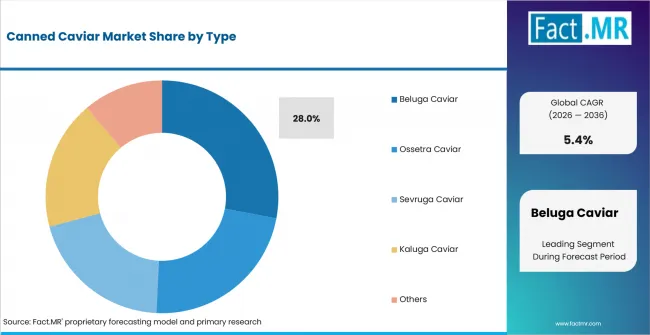
Canned Caviar Market Analysis By Type | Source: Fact.MR
Beluga Caviar leads because the name carries strong premium recognition among buyers who associate caviar with species, rarity, and eating occasion. That position also raises the burden on sellers. Premium tins need clear species identity, origin information, and legal labelling because CITES controls and Codex rules make species separation and container integrity part of market access. The segment is therefore supported by brand value, but it is not a loose commodity category. It depends on documented, controlled supply.
Why does Supermarket lead Application?
Supermarket is projected to account for 32.8% share in 2026.
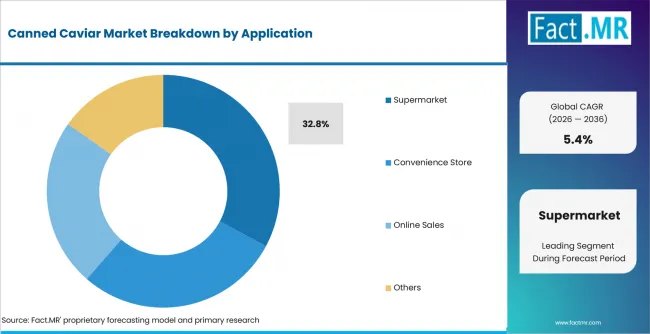
Canned Caviar Market Analysis By Application | Source: Fact.MR
Supermarkets lead because canned caviar is well suited to small, premium packs that can sit in controlled retail environments and be bought for entertaining, gifting or planned meals. The channel also reduces buyer hesitation. Shelf placement, pricing visibility, chilled handling and recognizable labels make the product easier to compare than restaurant-only or informal specialty routes. Online sales and convenience stores remain useful, but supermarkets offer the broadest bridge between premium positioning and routine purchase access.
What is accelerating Canned Caviar Market adoption, and what is holding it back?
Adoption is helped by premium seafood occasions, wider supermarket access, and formal traceability. Growth is held back by the product's narrow consumer base, strict wildlife-trade rules, price sensitivity and the need to protect species and origin claims.
Drivers Impact Analysis
| DRIVER | (~) % IMPACT ON CAGR | GEOGRAPHIC RELEVANCE | IMPACT TIMELINE |
|---|---|---|---|
| Premium occasions | +1.3% | UK, Canada and Australia | Short term (<= 2 years) |
| Traceable aquaculture | +1.1% | UK, Canada and Australia | Short term (<= 2 years) |
| Supermarket visibility | +0.8% | UK, Canada and Australia | Medium term (2-4 years) |
| Online information | +0.6% | UK, Canada and Australia | Medium term (2-4 years) |
Source: Fact.MR analysis. Updated Aug 4, 2026
- Premium occasions: Caviar is purchased for restaurants, celebrations, travel dining as well as gifting and at-home entertaining. This supports high value per tin.
- Traceable aquaculture: Farmed sturgeon supply gives importers and retailers a more reliable legal route than wild sourcing.
- Supermarket visibility: Premium grocery shelves help convert occasional buyers who may not buy from specialist caviar sellers.
- Online information: Specialist websites can explain species, tin size, serving guidance andstorage requirements before purchase.
Opportunity Impact Analysis
| OPPORTUNITY | (~) % IMPACT ON CAGR | GEOGRAPHIC RELEVANCE | IMPACT TIMELINE |
|---|---|---|---|
| Trial tins and gift packs | +0.9% | UK, Canada and Australia | Medium term (2-4 years) |
| Traceability-led retail positioning | +0.7% | UK, Canada and Australia | Medium term (2-4 years) |
| Foodservice-led consumer trial | +0.5% | UK, Canada and Australia | Long term (>= 4 years) |
Source: Fact.MR analysis. Updated Aug 4, 2026
- Small tins, curated gift packs, and clear serving guidance can widen trial without asking buyers to commit to large quantities.
- Retailers can use traceability and CITES-compliant labelling as quality signals for cautious buyers.
- Foodservice menus can introduce consumers to caviar before they purchase tins for home use.
Restraints Impact Analysis
| RESTRAINT | (~) % IMPACT ON CAGR | GEOGRAPHIC RELEVANCE | IMPACT TIMELINE |
|---|---|---|---|
| Cross-border compliance | -1.0% | UK, Canada and Australia | Short term (<= 2 years) |
| Premium-price sensitivity | -0.8% | Global sourcing and import-dependent markets | Short term (<= 2 years) |
| Product authenticity risks | -0.6% | Established and price-sensitive markets | Medium term (2-4 years) |
Source: Fact.MR analysis. Updated Aug 4, 2026
- CITES permits, labelling rules, and border checks can slow movement across countries and raise documentation costs.
- High unit prices keep demand sensitive to income, food inflation, and restaurant traffic.
- Mislabelled or substitute products can weaken trust, especially when buyers cannot interpret species codes or origin claims.
Which countries are scaling the Canned Caviar Market?
Country growth rates differ from the global 5.4% CAGR. The UK, Canada, Australia and the USA sit above the global rate. In contrast, Germany is close to it. These rates describe forecast pace; they do not make every country's demand structure identical.
- The UK leads the country set at 7.8% CAGR.
- Canada follows at 6.8% CAGR.
- Australia records 6.6% CAGR.
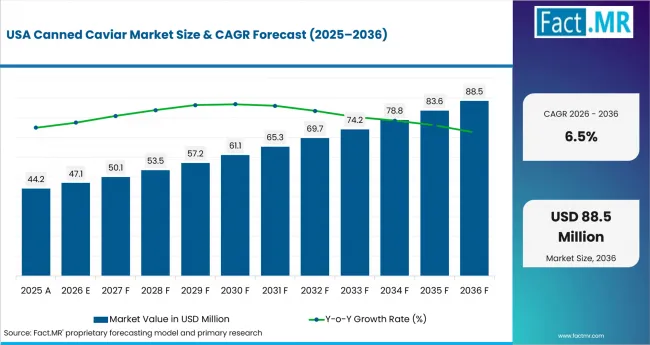
- The USA advances at 6.5% CAGR.
- Germany expands at 5.3% CAGR.
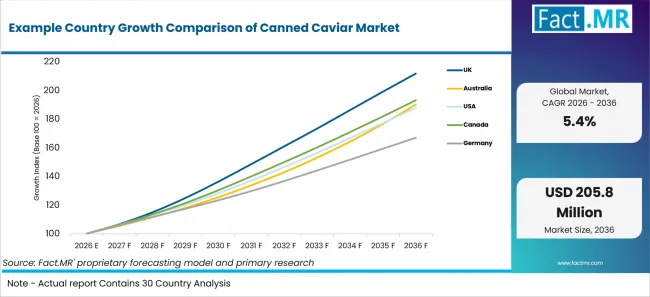
Example Country Growth Comparison Of Canned Caviar Market | Source: Fact.MR
| COUNTRY | CAGR, 2026 to 2036 |
|---|---|
| UK | 7.8% |
| Canada | 6.8% |
| Australia | 6.6% |
| USA | 6.5% |
| Germany | 5.3% |
Source: Fact.MR analysis. Updated Aug 4, 2026
What is driving the UK's growth through 2036?
The UK is forecast to record 7.8% CAGR through 2036, making it the fastest-growing country in the listed set. Growth is supported by a strong premium food base, a developed grocery channel, and a dining culture where small luxury items can be introduced through restaurants before moving into retail tins. DEFRA's food statistics show a large consumer food-and-drink expenditure base, while ONS retail data points to rising online spending values in 2026. For canned caviar, that matters because buyers often need product information before purchase: species, origin as well as storage as well as tin size and serving use. The UK therefore scales through formal retail and specialist online access rather than through mass seafood consumption alone.
What is driving Canada's growth through 2036?
Canada is forecast to grow at 6.8% CAGR through 2036, faster than Australia and the USA in this set. The country has a seafood-literate consumer base and a strong out-of-home food channel, which helps a premium tinned product reach restaurant, caterers as well as specialty grocers and gift buyers. Statistics Canada reported that food services and drinking places reached CAD 101.4 billion in annual sales in 2025, while food and beverage retail sales continued to rise in 2026. Canada also has active fish and seafood trade reporting through Fisheries and Oceans Canada, which supports buyer familiarity with imported and domestic premium seafood. Growth is still niche, but the channel base is better than the population size alone suggests.
What is driving Australia's growth through 2036?
Australia is forecast to grow at 6.6% CAGR through 2036. Demand is shaped by premium grocery, restaurant dining, domestic travel and entertaining occasions where small imported delicacies can command high value. Australian Bureau of Statistics retail data show the continuing role of supermarkets, cafes, restaurants and takeaway food services in consumer spending. In contrast, Tourism Research Australia reports a large domestic trip base. For canned caviar, the practical advantage is channel discipline. Imported premium seafood must move through formal retail, hospitality, and compliant import routes. This favors packaged tins with clear documentation over informal supply.
What is driving the USA's growth through 2036?
Canned Caviar Market Country Value Analysis | Source: Fact.MR
The USA is projected to expand at 6.5% CAGR through 2036, above the global rate. Growth is supported by scale: the country has a large supermarket network, a major restaurant base, specialty online retailand domestic aquaculture activity. U.S. Census retail and foodservice data show a large spending base for both grocery and out-of-home eating, while NOAA Fisheries reports that U.S. aquaculture is relatively small by volume but high in value. That distinction suits caviar because the product is high priced, compact, and dependent on controlled supply. U.S. Fish and Wildlife Service CITES rules also make legal documentation central to import and export activity, which favors suppliers that can prove species and origin cleanly.
What is driving Germany's growth through 2036?
Germany is forecast to expand at 5.3% CAGR through 2036, closest to the global rate among the listed countries. The market is steady rather than explosive because Germany already has a mature food retail system and a quality-conscious seafood buyer base. Destatis retail and accommodation-and-foodservice indicators point to a large but price-sensitive consumer channel. EUMOFA also shows that the wider EU fish market has faced challenging consumption and import conditions. For canned caviar, this means demand is supported by premium retail, restaurants and gifting as well as but faster growth is limited by cautious discretionary spending and the need to justify high unit prices.
Who leads the Canned Caviar Market?
Desjardin is the largest named company in the assessed set, with 9.6% share. Other listed participants are California Caviar Company, Petrossian, Awers Inc and Pioneering Caviar.
Competition is shaped by documented sourcing, pack quality, distribution access and brand trust. Buyers are likely to compare species claims, tin size, storage guidance and supply reliability rather than rely on a single specification. The named supplier set reflects participation across canned caviar and related premium roe offerings.
Which companies are the key providers?
Key companies include Desjardin; California Caviar Company; Petrossian; Awers Inc; Pioneering Caviar; KC Caviar; Imperia Caviar; Hangzhou Qiandaohu Xunlong Sci-Tech Co., Ltd.; Agroittica Lombarda; Caviar de Riofrio; Hubei Tianxia Sturgeon; Sterling Caviar; AMUR Caviar; and Russian Caviar House.
- Desjardin
- California Caviar Company
- Petrossian
- Awers Inc
- Pioneering Caviar
- KC Caviar
- Imperia Caviar
- Hangzhou Qiandaohu Xunlong Sci-Tech Co., Ltd.
- Agroittica Lombarda
- Caviar de Riofrio
- Hubei Tianxia Sturgeon
- Sterling Caviar
- AMUR Caviar
- Russian Caviar House
Bibliography
- Australian Bureau of Statistics. (2025, July 31). Retail Trade, Australia, June 2025.
- Codex Alimentarius Commission. (2010). Standard for Sturgeon Caviar, CXS 291-2010.
- CITES Secretariat. (n.d.). Sturgeons.
- CITES Secretariat. (n.d.). Universal Caviar Labelling Requirements.
- Federal Statistical Office of Germany. (2026). Retail trade.
- Federal Statistical Office of Germany. (2026). Turnover at current prices in accommodation and food services.
- Fisheries and Oceans Canada. (2025). Canada's fisheries fast facts 2025.
- NOAA Fisheries. (2026). Aquaculture.
- OECD and Food and Agriculture Organization of the United Nations. (2025). Fish and other aquatic products. In OECD-FAO Agricultural Outlook 2025-2034.
- Office for National Statistics. (2026, July 24). Retail sales, Great Britain: June 2026.
- Statistics Canada. (2026, April 28). Food services and drinking places, February 2026.
- Statistics Canada. (2026, July 23). Retail trade, May 2026.
- Tourism Research Australia. (2026). Domestic tourism statistics results.
- UK Department for Environment, Food & Rural Affairs. (2026). Food statistics in your pocket.
- U.S. Census Bureau. (2026, July 16). Monthly Retail Trade: Sales report.
- U.S. Fish and Wildlife Service. (n.d.). Export of caviar or meat of paddlefish or sturgeon removed from the wild under CITES.
- VisitBritain. (2026). Domestic tourism: latest results.
- European Commission, European Market Observatory for Fisheries and Aquaculture Products. (2025). The EU fish market 2025.
This Report Answers
- The report provides strategic intelligence on the Canned Caviar Market across Type and Application choices that shape premium product selection and retail placement.
- Segment analysis covers Beluga Caviar and Supermarket as the share leaders within the 2026 market.
- Country outlook evaluates the UK and Australia alongside the USA and Canada. Germany completes the growth comparison across the profiled markets.
- Competitive analysis profiles Desjardin and California Caviar Company alongside Petrossian and Awers Inc. Pioneering Caviar completes the provider view.
- Channel assessment covers Supermarket and Convenience Store alongside Online Sales. Other routes complete the commercial view.
What does the Canned Caviar Market cover?
The market covers canned caviar products and related premium roe offerings across the defined type, application, and regional categories. It focuses on packaged products sold through supermarket, convenience, online and other assessed channels.
What is included in the scope?
The scope includes the listed caviar types and commercial formats assessed within the study: Beluga, Ossetra, Sevruga as well as Kaluga and other canned caviar products sold through the defined applications.
What is excluded from the scope?
Products outside the defined type, application, and regional categories are excluded. The scope does not treat general fish roe, fresh seafood, or restaurant menu service as separate standalone markets unless they support canned caviar demand.
How Was the Analysis Built?
The analysis combines structured desk research, company and product mapping, expert validation. Demand-side checks across major regions.
- Primary Research: Interviews with buyers, suppliers, distributors and category specialists test purchasing criteria as well as sourcing constraints as well as adoption barriers and channel behavior.
- Desk Research: Public regulatory material, trade information, company literature andtechnical standards establish market boundaries and demand context.
- Market Sizing and Forecasting: Demand indicators, channel participation, product positioning as well as country-level growth patterns and supplier participation are reconciled across top-down and bottom-up views.
- Data Validation and Update Cycle: Findings are cross-checked across independent evidence routes and reviewed when material market, regulatory, or company changes occur.
Segmentation
What is the report's scope and coverage?
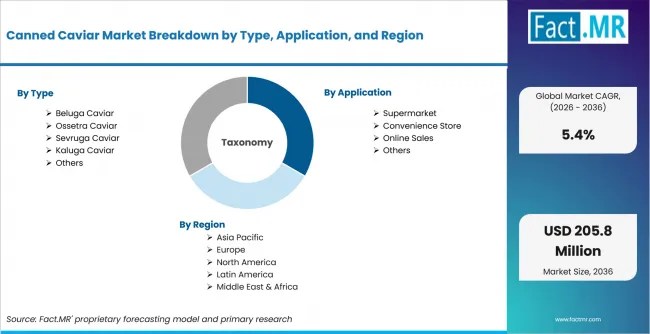
Canned Caviar Market Breakdown By Type, Application, And Region | Source: Fact.MR
| Attribute | Details |
|---|---|
| Quantitative Units | USD 131.1 million in 2026 to USD 205.8 million by 2036, at a 5.4% CAGR |
| Market Definition | Canned caviar products and related offerings across the assessed categories |
| Type | Beluga Caviar; Ossetra Caviar; Sevruga Caviar; Kaluga Caviar; Others |
| Application | Supermarket; Convenience Store; Online Sales; Others |
| Regions Covered | North America; Latin America; Europe; East Asia; South Asia & Oceania; Middle East & Africa |
| Countries Covered | UK; Australia; USA; Canada; Germany |
| Key Companies Profiled | Desjardin; California Caviar Company; Petrossian; Awers Inc; Pioneering Caviar; KC Caviar; and others |
| Forecast Period | 2026 to 2036 |
| Approach | Hybrid top-down and bottom-up market assessment |
Source: Fact.MR analysis. Updated Aug 4, 2026
How is the market segmented?
-
By Type:
- Beluga Caviar
- Ossetra Caviar
- Sevruga Caviar
- Kaluga Caviar
- Others
- Beluga Caviar
-
By Application:
- Supermarket
- Convenience Store
- Online Sales
- Others
- Supermarket
-
By Region:
- North America
- Latin America
- Western Europe
- Eastern Europe
- East Asia
- South Asia and Pacific
- Middle East & Africa
Frequently Asked Questions
How big is the Canned Caviar Market in 2026?
What is the CAGR of the Canned Caviar Market from 2026 to 2036?
Which type leads the Canned Caviar Market?
How much will the Canned Caviar Market add between 2026 and 2036?
Who are the leading companies in the Canned Caviar Market?
Who worked on this report


Preview the report firsthand - request a free sample
Free SampleGet the brochure for pricing and purchase details
Download PDF