- Market Value (2025): USD 2.6 Bn
- Estimated Value (2026): USD 2.9 Bn
- Forecast Value (2036): USD 8.0 Bn
- CAGR (2026-2036): 10.7%
What is the Data Quality Tools Market forecast to be worth by 2036?
USD 2.9 billion in 2026 to USD 8.0 billion by 2036 at 10.7% CAGR.
- The data quality tools market reached USD 2.6 billion in 2025 as enterprises kept funding profiling and validation software for governed application records.
- Demand is projected to increase from USD 2.9 billion in 2026 to USD 8.0 billion by 2036.
- The market is forecast to record 10.7% CAGR from 2026 to 2036 owing to cloud migration and stricter approval around trusted records.
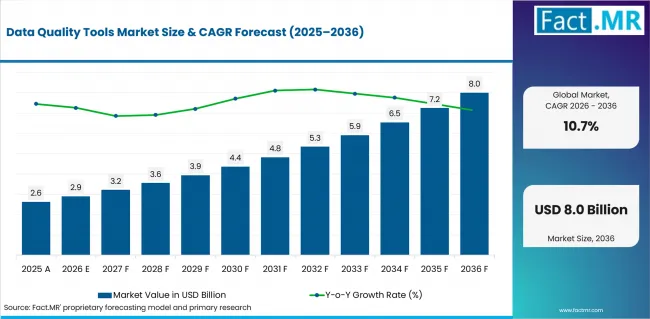
Data Quality Tools Market Value Analysis | Source: Fact.MR
What are the defining numbers behind Data Quality Tools Market growth?
USD 5.1 billion absolute opportunity by 2036.
- Demand Drivers in the Market
- Data profiling tools are expected to remain the first approval point. Customers need to see field errors and duplicates before larger clean-up work begins.
- Customer data management is anticipated to gain spending priority where CRM and billing records need one dependable account view.
- Large enterprises are projected to keep higher demand. Complex application stacks make data ownership and exception handling harder to manage manually.
- Key Segments Analyzed
- By Data Quality Solution Type: Data Profiling Tools are expected to hold 37.1% share in 2026 because profiling gives customers the first measurable view of field-level quality.
- By Application: Customer Data Management is projected to account for 30.1% share in 2026 as customer records remain central to CRM and service workflows.
- By End User: Large Enterprises are anticipated to capture 31.4% share in 2026. They operate more systems and require stronger governance before scaling automation.
- By Distribution Channel: Direct Sales are estimated to represent 31.6% share in 2026 since enterprise customers need demonstrations and integration review before purchase.
- By Deployment Mode: Cloud-Based solutions are forecast to hold 45.1% share in 2026. Hosted applications require validation close to daily workflows.
- Analyst Opinion at Fact.MR
- Shambhu Nath Jha, Sr. Consultant at Fact.MR, opines, “Data quality tools are judged by the rework they remove after purchase. Faster approval comes when they improve CRM and reporting workflows.”
- Strategic Implications
- Enterprise users should define the records that create the highest rework before choosing a platform. This keeps the purchase focused on business correction work.
- Providers can strengthen proposals by connecting data profiling results with data catalog workflows. Customers then see a clear route from error discovery to ownership.
- Investors should separate direct data quality exposure from adjacent data marketplace platforms. Commercial value improves when quality rules govern records that customers reuse daily.
Germany is projected at 13.9%; Brazil at 12.8%; Australia at 8.5%; the USA at 11.8%; Canada at 7.5%; the UK at 10.7%; and Japan at 9.6% during 2026 to 2036. Country analysis compares service depth and governance readiness.
How does the Data Quality Tools Market break down by segment?
Data Profiling Tools are expected to lead Data Quality Solution Type at 37.1% share in 2026. Customer Data Management is projected to lead Application at 30.1% share in 2026.
Which data quality solution type dominates?
Data Profiling Tools are projected to account for 37.1% share in 2026.
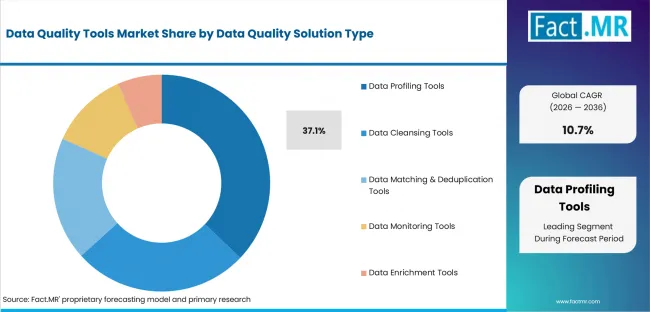
Data Quality Tools Market Analysis By Data Quality Solution Type | Source: Fact.MR
Profiling leads when customers need a first view of duplicate fields and missing values. Column Profiling and Pattern Discovery support early audits before correction work begins.
Why does Customer Data Management lead Application?
Customer Data Management is expected to account for 30.1% share in 2026.
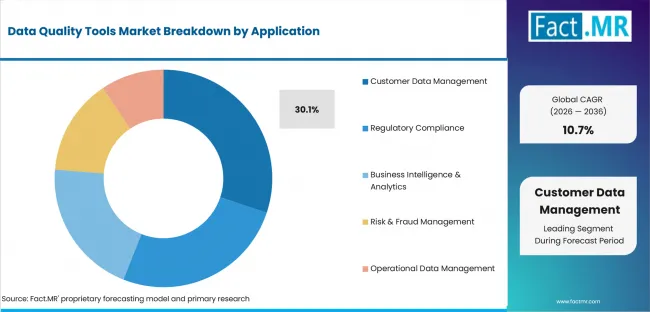
Data Quality Tools Market Analysis By Application | Source: Fact.MR
Customer records change across sales and service systems. CRM Data Validation and Customer Master Data help create one trusted account view before self-service analytics use expands.
What supports Large Enterprises within End User?
Large Enterprises are anticipated to hold 31.4% share in 2026.
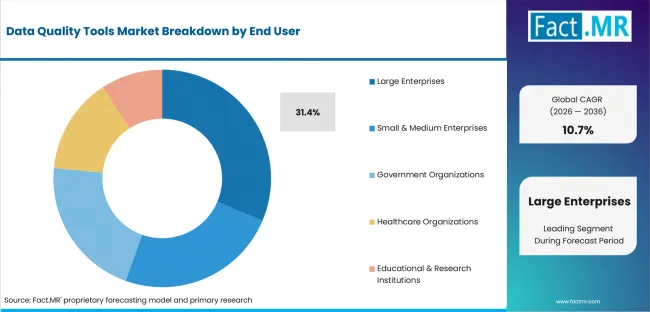
Data Quality Tools Market Analysis By End User | Source: Fact.MR
Large enterprises lead because the same record appears in many systems. Governance teams need stronger controls before automation or reporting expands.
Why does Direct Sales lead Distribution Channel?
Direct Sales are estimated to account for 31.6% share in 2026.
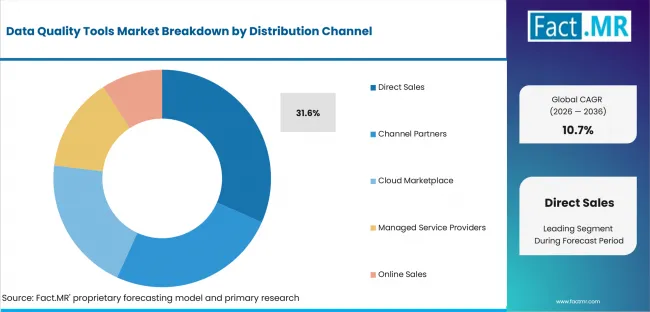
Data Quality Tools Market Analysis By Distribution Channel | Source: Fact.MR
Direct sales lead when customers need integration proof and service terms before approval. Cloud marketplaces support repeatable SaaS purchases after the first deployment works.
How does Cloud-Based deployment shape demand?
Cloud-Based solutions are forecast to hold 45.1% share in 2026.
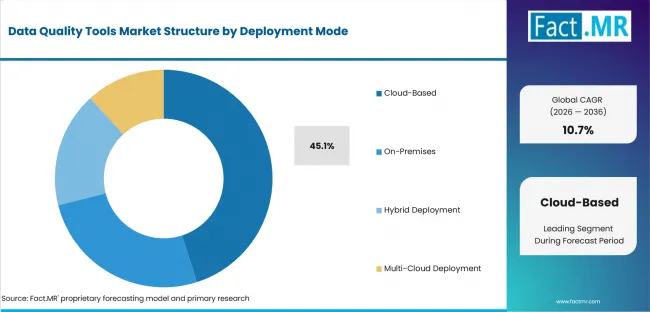
Data Quality Tools Market Analysis By Deployment Mode | Source: Fact.MR
Cloud-based tools lead because enterprise records move through hosted applications and analytics environments. Private Cloud and On-Premises remain relevant for sensitive records.
What is accelerating Data Quality Tools Market adoption, and what is holding it back?
Demand is expected to rise as companies fix data errors, manage complex customer records and improve cloud governance. Growth may be limited by high switching costs and difficult integration.
Drivers Impact Analysis
| DRIVER | (~) % IMPACT ON CAGR | GEOGRAPHIC RELEVANCE | IMPACT TIMELINE |
|---|---|---|---|
| Data profiling specification pull | +2.5% | Germany and large enterprises | Short term (<= 2 years) |
| Customer data management workload | +2.1% | Brazil and CRM-heavy users | Short term (<= 2 years) |
| Cloud-based governance requirements | +1.7% | USA, Canada, UK | Medium term (2-4 years) |
| Direct sales validation support | +1.2% | Enterprise procurement markets | Medium term (2-4 years) |
| Lifecycle control in complex records | +0.9% | Japan and regulated customers | Long term (>= 4 years) |
Source: Fact.MR analysis. Updated Jul 30, 2026
- Data profiling specification pull: Profiling tools are expected to gain budget priority when customers need measurable proof of record errors.
- Customer data management workload: Customer records need recurring validation because CRM and billing systems often store different account versions.
- Cloud-based governance requirements: Hosted application growth is expected to raise demand for monitoring rules across SaaS and hybrid environments.
Opportunity Impact Analysis
| OPPORTUNITY | (~) % IMPACT ON CAGR | GEOGRAPHIC RELEVANCE | IMPACT TIMELINE |
|---|---|---|---|
| Customer data management deployment support | +1.4% | Germany and Brazil | Medium term (2-4 years) |
| Security-led data governance upgrades | +1.1% | USA and UK | Medium term (2-4 years) |
| Managed-service conversion | +0.8% | Australia and Canada | Medium term (2-4 years) |
| Cloud marketplace validation | +0.6% | Cloud-first customers | Long term (>= 4 years) |
Source: Fact.MR analysis. Updated Jul 30, 2026
- Customer data management deployment support: Providers that connect profiling output to remediation workflows are expected to gain stronger CRM-owner approval.
- Security-led data governance upgrades: Data quality controls are expected to help customers clean records before access review and policy enforcement.
- Managed-service conversion: Managed services create an opening for packaged validation support where customers lack data stewardship capacity.
Restraints Impact Analysis
| RESTRAINT | (~) % IMPACT ON CAGR | GEOGRAPHIC RELEVANCE | IMPACT TIMELINE |
|---|---|---|---|
| Integration complexity and switching cost | -1.3% | Global enterprise accounts | Short term (<= 2 years) |
| Price sensitivity around customer data management | -0.9% | Brazil and smaller customers | Medium term (2-4 years) |
| Slow conversion without validation evidence | -0.7% | Australia and Canada | Medium term (2-4 years) |
| Data residency and vendor lock-in review | -0.5% | USA, UK, Japan | Long term (>= 4 years) |
Source: Fact.MR analysis. Updated Jul 30, 2026
- Integration complexity and switching cost: Projects slow when customers cannot connect tools to warehouses and CRM systems.
- Price sensitivity around customer data management: Smaller customers delay purchases when subscriptions exceed the immediate data-quality problem.
- Slow conversion without validation evidence: Customers hold back when vendors cannot show how profiling output becomes correction evidence.
Which countries are scaling Data Quality Tools Market fastest?
- Germany and Brazil lead through strong governance needs and implementation support. Australia and the USA remain close as buyers assess cloud migration, validation and enterprise software requirements.
- Canada and the UK grow steadily through compliance reviews and documentation checks. Japan follows a slower path because reliability testing and controlled system replacement matter more.
- Across all countries, adoption depends on integration proof, service depth, data ownership and confidence in cloud governance processes.
The full report provides country-level CAGR analysis across North America; Latin America; Europe; East Asia; South Asia; Oceania; and the Middle East and Africa.
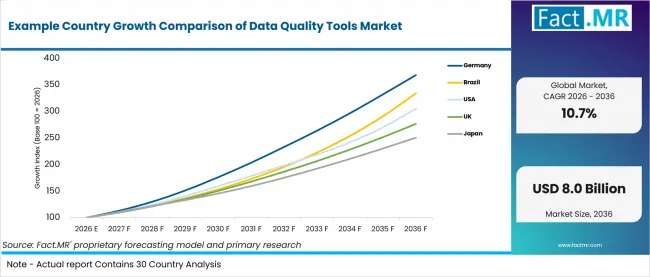
Example Country Growth Comparison Of Data Quality Tools Market | Source: Fact.MR
| Country | CAGR (2026-2036) |
|---|---|
| Germany | 13.9% |
| Brazil | 12.8% |
| Australia | 8.5% |
| USA | 11.8% |
| Canada | 7.5% |
| UK | 10.7% |
| Japan | 9.6% |
Source: Fact.MR analysis. Updated Jul 30, 2026
What supports Germany adoption?
13.9% CAGR, supported by enterprise governance and integration-led validation.
German customers expect data-quality tools to fit established enterprise systems. Data Profiling Tools are expected to gain priority where governance owners need proof of field errors. Providers compete on integration depth and support quality.
How is Brazil scaling demand?
12.8% CAGR, driven by customer data management and service-channel support.
Brazilian demand comes from cleaner customer records across sales and billing applications. Customer Data Management becomes easier to justify when duplicate records affect daily work. Local service access remains central to buyer confidence.
What is driving Australia’s growth from 2026 to 2036?
8.5% CAGR, backed by cloud migration and service reliability needs.
Australian customers need dependable controls across distributed operations. Large Enterprises are expected to prefer platforms that document errors and support correction across systems. Service reliability shapes the final purchase review.
How is USA demand developing?
11.8% CAGR, supported by direct sales and enterprise software review.
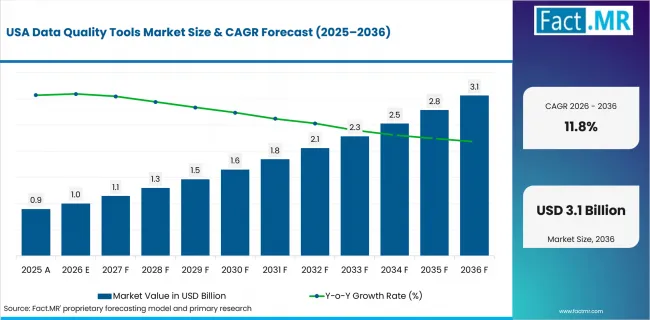
Data Quality Tools Market Country Value Analysis | Source: Fact.MR
USA demand reflects a mature software market where customers compare governance tools before purchase. Direct Sales remain important because complex accounts require security review.
How does Canada perform?
7.5% CAGR, led by cloud-based deployment and lower operating uncertainty.
Canadian growth reflects customers that need reliable service coverage across dispersed operations. Cloud-Based deployment is expected to appeal where teams want centralized monitoring.
What supports UK growth?
10.7% CAGR, supported by compliance review and governed cloud use.
UK demand is expected to develop through policy review and reporting control. Procurement teams compare data quality with cyber security needs when sensitive records move across hosted systems.
How is Japan progressing?
9.6% CAGR, shaped by reliability expectations and measured replacement demand.
Japanese customers value stable operation and precise documentation during software changeovers. Customer Data Management is expected to expand where vendors prove reliability before wider rollout.
Who leads the Data Quality Tools Market?
IBM and Informatica show direct relevance, while SAP strengthens the wider enterprise data management and governance landscape.
IBM supports data quality work through profiling, cleansing and governance capabilities across complex enterprise systems. Informatica contributes data matching, validation and customer record management tools. SAP adds data quality functions within its broader application and master data ecosystem. Oracle strengthens the field through database, cloud and enterprise application integration. SAS Institute and Ataccama support profiling, monitoring and remediation workflows. Qlik, through Talend extends the provider set through cloud-based data integration and governance capabilities.
Which companies are the key providers?
Key companies include IBM; Informatica; and SAP. Oracle; SAS Institute; Ataccama; and Qlik, through Talend complete the provider list.
- IBM
- Informatica
- SAP
- Oracle
- SAS Institute
- Ataccama
- Qlik, through Talend
Bibliography
- Office for Statistics Regulation. (2024, July 10). Spotlight on quality framework: Assuring confidence in economic statistics. UK Statistics Authority.
- Department for Education. (2024, August 31). Data quality standard: DDTS-154, version 1.00. GOV.UK.
- Government Digital Service. (2025, November 11). Implement a data quality action plan. GOV.UK.
- Informatica Inc. (2024, January 31). New research from Informatica reveals more data leaders plan to capitalize on generative AI, but data quality remains the key obstacle to adoption.
- Oracle Corporation. (2024, December). Using Oracle Enterprise Data Quality, 14c (14.1.2.0.0).
This Report Answers
- The report provides strategic intelligence on Data Quality Solution Type and Application choices that shape data profiling and customer record control.
- Segment analysis covers Data Profiling Tools and Customer Data Management as the share leaders within the 2026 market.
- Country outlook evaluates Germany and Brazil alongside Australia and the USA. Canada and the UK follow next. Japan completes the growth comparison.
- Competitive analysis profiles IBM alongside Informatica and SAP. Oracle and SAS Institute follow next. Ataccama and Qlik, through Talend complete the provider set.
- Deployment assessment covers Cloud-Based and On-Premises environments alongside direct sales requirements. Data mining use cases show why input quality matters before analytics work begins.
What does the Data Quality Tools Market cover?
Data quality tools improve enterprise records where trusted information affects reporting and workflows.
The market covers platforms and services that find record-level issues. These tools support profiling and validation before records move into business use.
What is included in the scope?
Data quality tools are used across enterprises and government organizations. Healthcare organizations and research institutions are included when record control affects operations.
The scope includes Data Quality Solution Type and Application. End User and Distribution Channel follow in the structure. Deployment Mode and Region complete the coverage.
What is excluded from the scope?
Unrelated infrastructure and general analytics spending remain outside scope. Adjacent software is excluded when it lacks direct data quality functionality.
The scope excludes tools that only visualize records without checking quality. Hosting work is excluded unless it supports data-quality deployment. Cyber security work follows the same rule.
How Was the Analysis Built?
The analysis draws on 120+ references and 35+ company portfolios. It reviews 25+ countries and 20+ industry interviews.
- Primary Research: Interviews with software providers and service firms test purchase priorities. Channel partners and enterprise users help review approval requirements.
- Desk Research: Official statistics and regulatory publications support the review. Company filings and trade data are used when they directly support retained claims.
- Market Sizing and Forecasting: Estimates combine historical performance and demand indicators. Pricing trends and segment shares are reviewed with country growth and adoption patterns.
- Data Validation and Update Cycle: Findings are validated against public information and company activity. Regulatory changes and procurement trends are checked before final use.
Segmentation
What is the report’s scope and coverage?
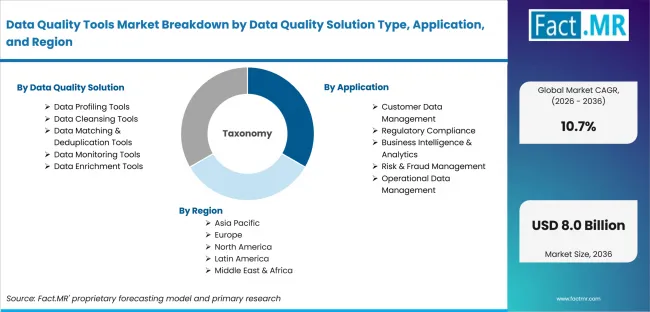
Data Quality Tools Market Breakdown By Data Quality Solution Type, Application, And Region | Source: Fact.MR
| Attribute | Details |
|---|---|
| Quantitative Units | USD 2.9 billion in 2026 to USD 8.0 billion by 2036, at a 10.7% CAGR. |
| Market Definition | Software and services used to profile, clean, match, monitor, enrich, and validate business records before those records are used in applications or reporting |
| Data Quality Solution Type | Data Profiling Tools; Column Profiling; Pattern Discovery; Data Cleansing Tools; Address Standardization; Data Parsing; Data Matching & Deduplication Tools; Data Monitoring Tools; Data Enrichment Tools |
| Application | Customer Data Management; Customer Master Data; CRM Data Validation; Regulatory Compliance; Business Intelligence & Analytics; Risk & Fraud Management; Operational Data Management |
| End User | Large Enterprises; Global Enterprises; Multinational Corporations; Small & Medium Enterprises; Government Organizations; Healthcare Organizations; Educational & Research Institutions |
| Distribution Channel | Direct Sales; Enterprise Sales Teams; Strategic Accounts; Channel Partners; Cloud Marketplace; Managed Service Providers; Online Sales |
| Deployment Mode | Cloud-Based; Public Cloud; Private Cloud; On-Premises; Hybrid Deployment; Multi-Cloud Deployment |
| Regions Covered | North America; Latin America; Europe; East Asia; South Asia and Oceania; Middle East and Africa |
| Countries Covered | Germany; Brazil; Australia; USA; Canada; UK; Japan |
| Key Companies Profiled | IBM; Informatica; SAP; Oracle; SAS Institute; Ataccama; Qlik, through Talend |
| Forecast Period | 2026 to 2036 |
| Approach | Hybrid top-down and bottom-up approach using software demand; deployment needs; customer data management; direct sales review; cloud adoption patterns; country growth; and company portfolio review |
Source: Fact.MR analysis. Updated Jul 30, 2026
How is the market segmented?
-
By Data Quality Solution Type:
- Data Profiling Tools
- Column Profiling
- Pattern Discovery
- Data Cleansing Tools
- Address Standardization
- Data Parsing
- Data Matching & Deduplication Tools
- Record Matching
- Duplicate Detection
- Data Monitoring Tools
- Quality Dashboards
- Real-Time Monitoring
- Data Enrichment Tools
- Reference Data Enrichment
- Third-Party Data Validation
- Data Profiling Tools
-
By Application:
- Customer Data Management
- Customer Master Data
- CRM Data Validation
- Regulatory Compliance
- Data Governance
- Compliance Reporting
- Business Intelligence & Analytics
- Data Warehousing
- Reporting & Visualization
- Risk & Fraud Management
- Fraud Detection
- Risk Assessment
- Operational Data Management
- Supply Chain Data
- Financial Data Processing
- Customer Data Management
-
By End User:
- Large Enterprises
- Global Enterprises
- Multinational Corporations
- Small & Medium Enterprises
- Medium Businesses
- Small Businesses
- Government Organizations
- Public Sector Agencies
- Regulatory Authorities
- Healthcare Organizations
- Hospitals
- Diagnostic Networks
- Educational & Research Institutions
- Universities
- Research Centers
- Large Enterprises
-
By Distribution Channel:
- Direct Sales
- Enterprise Sales Teams
- Strategic Accounts
- Channel Partners
- Value-Added Resellers
- System Integrators
- Cloud Marketplace
- SaaS Marketplace
- Public Cloud Marketplace
- Managed Service Providers
- Data Management Service Providers
- IT Outsourcing Firms
- Online Sales
- Vendor Websites
- Digital Software Platforms
- Direct Sales
-
By Deployment Mode:
- Cloud-Based
- Public Cloud
- Private Cloud
- On-Premises
- Local Data Centers
- Dedicated Servers
- Hybrid Deployment
- Cloud Integrated
- Multi-Environment
- Multi-Cloud Deployment
- Cross-Cloud Management
- Cloud-to-Cloud Integration
- Cloud-Based
-
By Region:
- North America
- Latin America
- Europe
- East Asia
- South Asia and Oceania
- Middle East and Africa
Frequently Asked Questions
Which Data Quality Solution Type leads the market?
Which Application leads the market?
Which End User category leads the market?
Which Distribution Channel leads the market?
Which Deployment Mode leads the market?
Which country records the highest listed CAGR?
What is the primary driver in this market?
What is the main restraint?
Why do large enterprises lead demand?
Who worked on this report


Preview the report firsthand - request a free sample
Free SampleGet the brochure for pricing and purchase details
Download PDF