- Market Value (2025): USD 3.4 Bn
- Estimated Value (2026): USD 3.8 Bn
- Forecast Value (2036): USD 10.6 Bn
- CAGR (2026-2036): 10.8 %
What is the Electric Vehicle Battery Testing Equipment Market forecast to be worth by 2036?
USD 3.8 billion to USD 10.6 billion by 2036 at a 10.8% CAGR.
- The electric vehicle battery testing equipment market reached USD 3.4 billion in 2025.
- Demand is projected to increase from USD 3.8 billion in 2026 to USD 10.6 billion by 2036.
- The market is forecast to record a 10.8% CAGR from 2026 to 2036 and create an absolute opportunity of USD 6.8 billion.
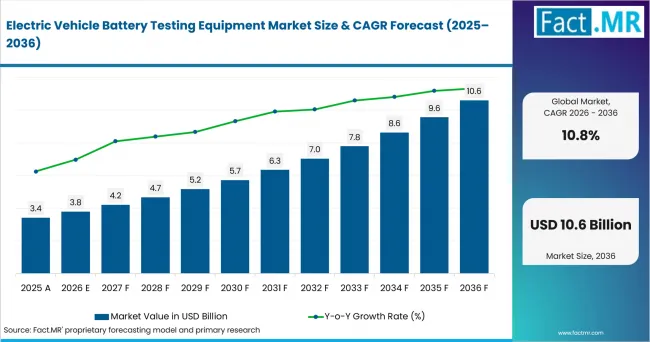
Electric Vehicle Battery Testing Equipment Market Value Analysis | Source: Fact.MR
What are the defining numbers behind Electric Vehicle Battery Testing Equipment Market growth?
An absolute opportunity of USD 6.8 billion is expected between 2026 and 2036.
- Demand Drivers in the Market
- Rapid expansion of battery manufacturing is increasing demand for cell, module and pack testing capacity. Global lithium-ion battery manufacturing capacity exceeded 4 TWh in 2025, rising by roughly 30% from 2024. Each additional production line requires testing for capacity, charge-discharge performance, cycle life and manufacturing consistency before cells can be assembled into vehicle packs.
- EV battery safety regulations require manufacturers to validate performance under mechanical, electrical and thermal stress. UN Regulation No. 100 covers rechargeable energy-storage-system tests related to vibration, mechanical shock, thermal shock, fire resistance, overcharge and external short circuit. These requirements create recurring demand for environmental chambers, cyclers and pack-level safety-testing systems.
- Battery manufacturers are under pressure to improve production yield while detecting defects earlier. Testing at the cell stage helps identify variation in capacity and internal resistance before defective cells are incorporated into modules or packs, where correction becomes more expensive. The U.S. Department of Energy supports diagnostic methods intended to improve battery quality, manufacturing yield and system efficiency.
- Continued changes in battery chemistry and design require flexible test equipment. Manufacturers are developing LFP and high-nickel lithium-ion cells alongside sodium-ion and solid-state technologies. Testing platforms must therefore support different voltage ranges, charging profiles and thermal conditions rather than being configured for one fixed cell design.
- Battery durability remains central to vehicle cost and warranty risk. DOE battery-development programmes use testing to evaluate cells and modules against targets for lower cost, longer operating life and improved performance. Long-duration cycling and accelerated ageing tests allow manufacturers to estimate degradation before batteries enter vehicle production.
- Key Segments Analyzed
- Battery Cell Testing Systems account for 41.0% of the Equipment Type segment in 2026 because performance variation must be identified before cells are assembled into modules and packs.
- Cell Performance Testing holds 39.0% of the Testing Application segment in 2026, supported by routine evaluation of capacity, charge-discharge behaviour and cycle stability.
- Battery Manufacturing represents 44.0% of the End-use Industry segment in 2026 as gigafactories require testing across development, production and end-of-line quality control.
- Battery Manufacturers account for 42.0% of the Customer Category segment in 2026 because they carry direct responsibility for cell consistency and pack-level performance.
- Automated Test Systems hold 40.0% of the Testing Technology segment in 2026, reflecting the need to test large cell volumes with consistent procedures and traceable results.
- Analyst Opinion at Fact.MR
- Shambhu Nath Jha, Principal Consultant at Fact.MR, states, “Electric Vehicle Battery Testing Equipment companies need to show how the product fits each use case rather than compete on generic claims. Leading positioning supports premium demand, but repeat sales are expected to depend on consistent quality, clear documentation and a measurable outcome.”
- Strategic Implications
- Brand owners should position offerings by application fit rather than generic capability claims. Clearer articulation of the specific use case and the supporting evidence is expected to shorten the buying decision and strengthen pricing power.
- Suppliers can strengthen retention by documenting specification, compliance and performance in simple customer-facing materials. Transparent documentation reduces evaluation friction and supports repeat purchasing, particularly in compliance-heavy regions.
- Distributors should plan channel strategies around the leading segment and the fastest-growing use cases. Aligning inventory, pricing and promotion with the share leaders is expected to improve margin capture.
- Pricing strategy should reflect the value of documented outcomes rather than raw capacity. Differentiating on reliability, compliance and committed service levels is expected to protect margins against lower-cost substitutes.
USA follows 11.4% by 2036. Germany is projected at 10.9% by 2036. South Korea is forecast to expand at 10.4% by 2036. Japan is estimated at 10.0% by 2036. India is estimated at 9.5% by 2036. France is estimated at 9.0% by 2036.
How does the Electric Vehicle Battery Testing Equipment Market break down by segment?
The market is segmented by Equipment Type, Testing Application, End-use Industry, Customer Category and Testing Technology.
Why do Battery Cell Testing Systems lead Equipment Type?
Battery Cell Testing Systems are projected to account for a 41.0% share in 2026.
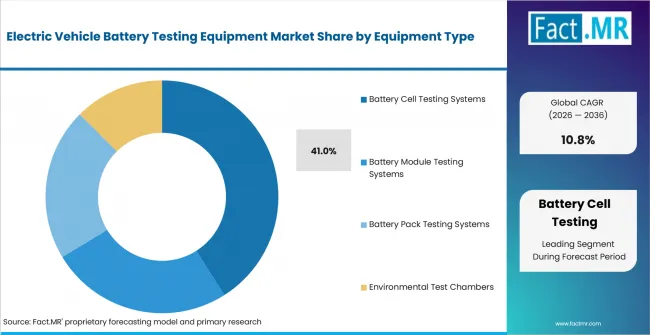
Electric Vehicle Battery Testing Equipment Market Analysis By Equipment Type | Source: Fact.MR
Cell testing leads because the cell is the smallest independently testable energy-storage unit and the point at which production defects can be identified most economically. Manufacturers measure capacity, voltage response and internal resistance before cells are grouped into modules. Removing an inconsistent cell at this stage reduces the risk of pack imbalance and premature degradation.
The scale of testing is also high. DOE battery-test facilities can operate hundreds of independent testing channels across different chemistries and formats, illustrating the volume of parallel testing needed during battery development and qualification.
Why does Cell Performance Testing lead Testing Application?
Cell Performance Testing is projected to account for a 39.0% share in 2026.
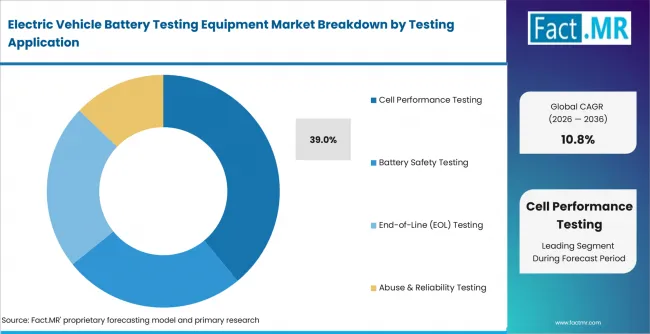
Electric Vehicle Battery Testing Equipment Market Analysis By Testing Application | Source: Fact.MR
Cell Performance Testing leads because every battery design must demonstrate usable capacity and stable behaviour over repeated charging cycles. Testing also measures how performance changes with temperature and discharge rate, allowing manufacturers to determine whether a cell is suitable for a passenger vehicle or another duty cycle.
Performance data supports battery-management-system calibration and warranty decisions. DOE research uses electrochemical performance testing to project battery life and understand degradation under controlled cycling conditions.
Why does Battery Manufacturing lead End-use Industry?
Battery Manufacturing is projected to account for a 44.0% share in 2026.
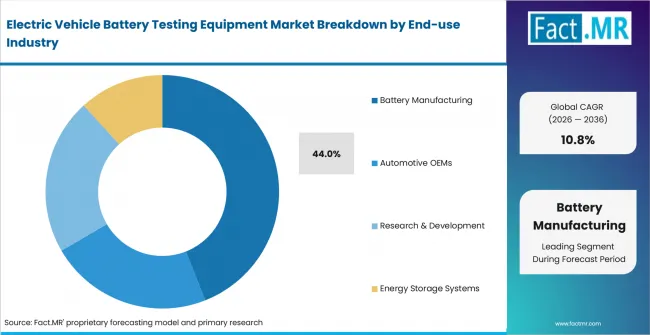
Electric Vehicle Battery Testing Equipment Market Analysis By End Use Industry | Source: Fact.MR
Battery manufacturing leads because testing is embedded throughout production rather than limited to final certification. Incoming materials may be inspected before cell assembly, while completed cells undergo formation and ageing. Modules and packs then require electrical and safety validation before shipment to vehicle manufacturers.
Global battery production capacity exceeded 4 TWh in 2025, with capacity in the European Union and the USA growing by around 50% year over year. This expansion increases the installed requirement for formation cyclers, environmental chambers and automated inspection systems.
Why do Battery Manufacturers lead Customer Category?
Battery Manufacturers are projected to account for a 42.0% share in 2026.
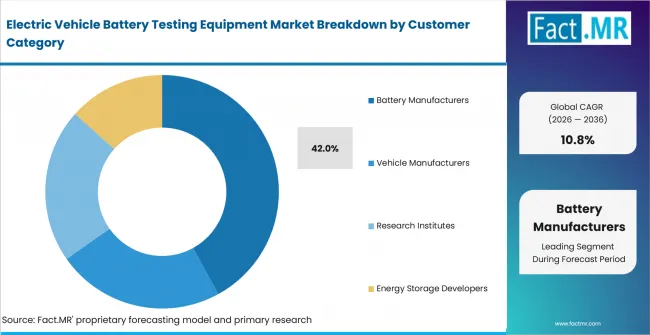
Electric Vehicle Battery Testing Equipment Market Analysis By Customer Category | Source: Fact.MR
Battery manufacturers lead because they are responsible for demonstrating that cells meet promised specifications before supplying vehicle OEMs. Differences in capacity or thermal behaviour can affect the performance of the complete pack, making testing central to quality control and customer acceptance.
Manufacturers also need detailed test records for traceability and process improvement. Results can be linked to production batches and used to identify whether variation originated in materials, electrode processing or cell assembly.
Why do Automated Test Systems lead Testing Technology?
Automated Test Systems are projected to account for a 40.0% share in 2026.
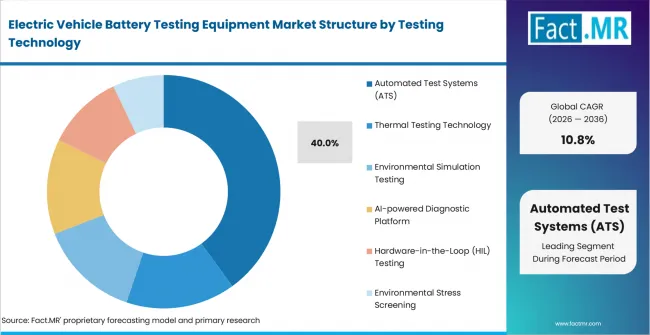
Electric Vehicle Battery Testing Equipment Market Analysis By Testing Technology | Source: Fact.MR
Automated systems lead because large battery plants must test thousands of cells under repeatable conditions. Manual testing cannot provide the same throughput or consistency across charging sequences and safety cut-offs. Automated equipment can run parallel test channels and record results without continuous operator intervention.
Automation also improves traceability by linking test outcomes with cell identifiers and manufacturing records. This allows failed units to be isolated quickly while production engineers analyse recurring defects or process drift.
What is accelerating Electric Vehicle Battery Testing Equipment Market adoption, and what is holding it back?
Demand is expected to rise through battery manufacturing expansion, safety validation and automated quality control. Growth may be limited by high equipment cost, changing battery chemistries and qualification complexity.
Drivers Impact Analysis
| Driver | (~) % Impact on CAGR | Geographic Relevance | Impact Timeline |
|---|---|---|---|
| Battery manufacturing expansion | +2.8% | China, USA, Germany | Short term (<= 2 years) |
| EV battery safety validation | +2.4% | Global EV markets | Short term (<= 2 years) |
| Early defect detection and yield control | +2.0% | China, South Korea, Japan | Medium term (2-4 years) |
| Chemistry and cell-format changes | +1.6% | USA, Japan, Europe | Medium term (2-4 years) |
| Durability and warranty testing | +1.2% | Automotive manufacturing markets | Long term (>= 4 years) |
Source: Fact.MR analysis. Updated Aug 6, 2026
- Battery manufacturing expansion: New cell, module and pack lines increase demand for capacity, charge-discharge and cycle-life testing before batteries move into vehicle packs.
- EV battery safety validation: Mechanical, electrical and thermal stress tests create recurring need for cyclers, environmental chambers and pack-level safety systems.
- Early defect detection and yield control: Cell-stage testing helps manufacturers identify capacity and internal-resistance variation before defects become costly at module or pack level.
Opportunity Impact Analysis
| Opportunity | (~) % Impact on CAGR | Geographic Relevance | Impact Timeline |
|---|---|---|---|
| High-throughput automated test lines | +1.5% | China and USA | Medium term (2-4 years) |
| Flexible chemistry-compatible platforms | +1.2% | Japan, South Korea, Germany | Medium term (2-4 years) |
| Pack-level safety and abuse testing | +0.9% | India, France, USA | Long term (>= 4 years) |
| Traceable quality-data systems | +0.7% | Global battery manufacturers | Long term (>= 4 years) |
Source: Fact.MR analysis. Updated Aug 6, 2026
- High-throughput automated test lines: Large battery plants need parallel channels and repeatable procedures to test thousands of cells with consistent records.
- Flexible chemistry-compatible platforms: Equipment that supports LFP, high-nickel lithium-ion, sodium-ion and solid-state formats can reduce replacement risk for manufacturers.
- Pack-level safety and abuse testing: Vehicle qualification and homologation needs create opportunity for systems that validate overcharge, short-circuit, thermal and mechanical safety.
Restraints Impact Analysis
| Restraint | (~) % Impact on CAGR | Geographic Relevance | Impact Timeline |
|---|---|---|---|
| High equipment and integration cost | -1.3% | Developing EV markets | Short term (<= 2 years) |
| Changing battery designs | -1.0% | Global | Short term (<= 2 years) |
| Qualification complexity | -0.8% | Automotive OEM supply chains | Medium term (2-4 years) |
| Throughput and traceability burden | -0.6% | High-volume battery plants | Long term (>= 4 years) |
Source: Fact.MR analysis. Updated Aug 6, 2026
- High equipment and integration cost: Cyclers, chambers and automated systems require major upfront spending before production benefits are fully visible.
- Changing battery designs: New chemistries and voltage ranges can make fixed test setups less useful when manufacturers shift cell formats.
- Qualification complexity: Battery testing must satisfy safety, durability and customer-acceptance requirements, which can extend approval timelines before wider deployment.
Which countries are scaling the Electric Vehicle Battery Testing Equipment Market fastest?
- USA: Federal battery programmes support the fabrication and testing of advanced EV cells, including projects targeting lower manufacturing cost and higher production throughput. This strengthens demand for flexible laboratory and production-testing equipment.
- Germany: Germany is expanding battery-cell research and production infrastructure through facilities such as the Research Institution for Battery Cell Production. New pilot and manufacturing capacity increases demand for equipment that can validate cells before industrial scaling.
- South Korea: The country’s large battery manufacturing base supports demand for precision test systems across cell development and pack qualification. Domestic suppliers also require equipment compatible with several chemistries and international vehicle standards.
- Japan: Japan revised its battery strategy in 2026 to strengthen manufacturing across the battery power-supply system and improve performance beyond energy density alone. This broadens testing requirements to include power output and durability.
- India: The National Automotive Board is expanding EV and charging-equipment testing infrastructure across its centres. Its testing facilities generated INR 3.89 billion, approximately USD 44 million, in operating income during fiscal 2024–2025, showing growing demand for formal testing and homologation services.
- France: France is building a domestic battery production base through projects such as the ACC gigafactory. New cell manufacturing capacity creates demand for formation testing and end-of-line inspection within the country.
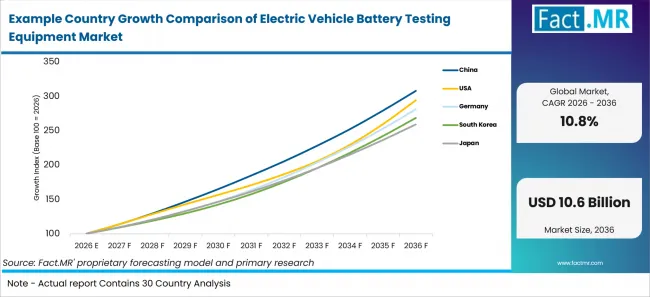
Example Country Growth Comparison Of Electric Vehicle Battery Testing Equipment Market | Source: Fact.MR
| Country | CAGR (2026-2036) |
|---|---|
| USA | 11.4% |
| Germany | 10.9% |
| South Korea | 10.4% |
| Japan | 10.0% |
| France | 9.0% |
Source: Fact.MR analysis. Updated Aug 6, 2026
What is driving the USA’s growth through 2036?
The USA is forecast to expand at an 11.4% CAGR from 2026 to 2036.
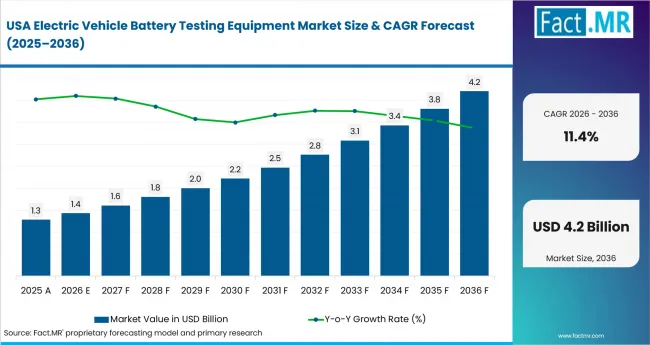
Electric Vehicle Battery Testing Equipment Market Country Value Analysis | Source: Fact.MR
Growth is being supported by federal investment in advanced battery development and domestic manufacturing. U.S. Department of Energy programmes fund the fabrication and testing of next-generation lithium battery cells while targeting manufacturing-cost reductions of at least 30% and throughput improvements of at least 50%. These goals depend on equipment that can measure electrochemical performance and verify production consistency.
The expansion of U.S. cell manufacturing also increases demand for formation cyclers and environmental test systems. Testing requirements span laboratory development and end-of-line pack validation.
What is driving Germany’s growth through 2036?
Germany is forecast to expand at a 10.9% CAGR from 2026 to 2036.
Germany is investing in battery-cell production research to help transfer new chemistries from laboratory development into industrial manufacturing. The Research Institution for Battery Cell Production provides a dedicated environment for scaling production processes, creating demand for testing equipment across pilot and pre-commercial lines.
The country’s automotive base also creates demand for pack-level validation linked to vehicle safety and durability. Suppliers must support European standards and test results that can be integrated into OEM qualification systems.
What is driving South Korea’s growth through 2036?
South Korea is forecast to expand at a 10.4% CAGR from 2026 to 2036.
South Korea’s battery industry is supported by major cell manufacturers serving domestic and international vehicle programmes. These suppliers conduct development across several cell formats and chemistries, increasing demand for testing systems with wide current and voltage ranges.
High export exposure also makes traceable quality data important. Manufacturers require automated equipment that can produce consistent records for vehicle customers operating under different regulatory frameworks.
What is driving Japan’s growth through 2036?
Japan is forecast to expand at a 10.0% CAGR from 2026 to 2036.
Japan’s revised Battery and Power Industry Strategy places greater emphasis on output performance alongside energy density. This increases the need to test power delivery and thermal behaviour rather than focusing on capacity alone.
The government previously authorized battery-related investment plans worth approximately JPY 1 trillion, or about USD 6.8 billion, with subsidies of up to JPY 350 billion, or roughly USD 2.4 billion. Expansion of manufacturing and technology development increases demand for qualification equipment across cells and battery components.
What is driving France’s growth through 2036?
France is forecast to expand at a 9.0% CAGR from 2026 to 2036.
France is establishing domestic cell-production capacity through European battery projects. The ACC facility in Douvrin became the country’s first large battery plant, while further investment is building a broader manufacturing ecosystem.
Local production increases demand for equipment across formation and safety testing. It also creates requirements for automated inspection systems that can support European vehicle manufacturers with traceable quality data.
Who leads the Electric Vehicle Battery Testing Equipment Market?
Chroma ATE Inc. is positioned as a leading provider through its battery cyclers, automated test systems and power-electronics testing portfolio. Its equipment supports cell and pack validation across development laboratories and production lines.
Arbin Instruments and Maccor compete strongly in electrochemical cycling and long-duration battery research. AVL, HORIBA and HIOKI bring broader automotive testing capabilities, including pack validation and precision electrical measurement.
Keysight Technologies and National Instruments compete through modular instrumentation and automated software environments. ESPEC focuses on environmental chambers for temperature and humidity testing, while BAC Instruments serves specialized battery-test applications.
Competition depends on current and voltage accuracy, channel density and software integration. Manufacturers also assess whether equipment can support new chemistries without major hardware replacement. Systems that combine automated control with traceable data are better positioned for gigafactory deployments.
The competitive landscape remains fragmented because laboratory research and production testing require different configurations. Research centres value flexibility and measurement depth, while high-volume manufacturers prioritize throughput and uptime.
Which companies are the key providers?
Key companies include Chroma ATE Inc.; Arbin Instruments; AVL List GmbH; HIOKI E.E. Corporation; Keysight Technologies, Inc.; National Instruments Corporation; HORIBA, Ltd.; Maccor, Inc.; BAC Instruments Inc.; and ESPEC Corporation.
- Chroma ATE Inc.
- Arbin Instruments
- AVL List GmbH
- HIOKI E.E. Corporation
- Keysight Technologies, Inc.
- National Instruments Corporation
- HORIBA, Ltd.
- Maccor, Inc.
- BAC Instruments Inc.
- ESPEC Corporation
How is the market segmented?
-
By Equipment Type:
- Battery Cell Testing Systems
- Capacity Test Equipment
- Formation & Aging Testers
- Battery Module Testing Systems
- Module Charge/Discharge Testers
- Module Balancing Testers
- Battery Pack Testing Systems
- High-voltage Pack Testers
- BMS Validation Systems
- Environmental Test Chambers
- Temperature Cycling Chambers
- Humidity Test Chambers
- Battery Cell Testing Systems
-
By Testing Application:
- Cell Performance Testing
- Cycle Life Testing
- Charge/Discharge Testing
- Battery Safety Testing
- Thermal Runaway Testing
- Vibration Testing
- End-of-Line (EOL) Testing
- Leakage Current Testing
- Insulation Resistance Testing
- Abuse & Reliability Testing
- Impact & Crush Testing
- Overcharge & Short Circuit Testing
- Cell Performance Testing
-
By End-use Industry:
- Battery Manufacturing
- Gigafactories
- EV Component Manufacturing
- Automotive OEMs
- Electric Commercial Vehicles
- Battery Recycling
- Research & Development
- University Research
- Government Testing Centers
- Energy Storage Systems
- Grid-scale Battery Systems
- Renewable Energy Storage
- Battery Manufacturing
-
By Customer Category:
- Battery Manufacturers
- Cell Manufacturers
- Module Manufacturers
- Vehicle Manufacturers
- Automotive Tier-1 Suppliers
- Test Laboratories
- Research Institutes
- Certification Bodies
- Quality Inspection Agencies
- Energy Storage Developers
- Independent Testing Organizations
- Compliance Assessment Agencies
- Battery Manufacturers
-
By Testing Technology:
- Automated Test Systems (ATS)
- High-Precision Measurement
- Multi-channel Battery Analyzer
- Thermal Testing Technology
- Environmental Simulation Testing
- AI-powered Diagnostic Platform
- Hardware-in-the-Loop (HIL) Testing
- Real-time Data Acquisition
- Cloud-connected Analytics Platform
- Environmental Stress Screening
- Climate Simulation Technology
- High-accuracy Sensor Network
- Automated Test Systems (ATS)
-
By Region:
- North America
- Latin America
- Western Europe
- Eastern Europe
- East Asia
- South Asia and Pacific
- Middle East & Africa
Bibliography
- Federal Ministry of Education and Research, Germany. (2025). High-Tech Agenda Germany.
- Government of France, Directorate General for Enterprise. (2024). Annual Report 2023.
- Government of India, Ministry of Heavy Industries. (2025). National Automotive Board Annual Report 2024–2025.
- Government of India, Ministry of Heavy Industries. (2025). Advanced Battery Safety and EV Testing Requirements.
- International Energy Agency. (2026). Electric Vehicle Batteries. In Global EV Outlook 2026.
- International Energy Agency. (2026). Manufacturing and Trade. In Global EV Outlook 2026.
- Japan Ministry of Economy, Trade and Industry. (2026). Battery and Power Industry Strategy.
- Japan Ministry of Economy, Trade and Industry. (2024). Plans for Securing the Supply of Storage Batteries.
- U.S. Department of Energy. (2024). Vehicle Technologies Office Batteries Funding Opportunity.
- Wikipedia. (2026). Rechargeable battery. Wikimedia Foundation
This Report Answers
- The report provides strategic intelligence on the Electric Vehicle Battery Testing Equipment Market across the covered segments that shape product positioning.
- Segment analysis covers the leading segments and their share within the 2026 market.
- Country outlook evaluates the highest-growth markets and the wider regional comparison.
- Competitive analysis profiles the named providers in the electric vehicle battery testing equipment space.
- Application assessment covers the covered use cases with attention to channel access and product fit.
What does the Electric Vehicle Battery Testing Equipment Market cover?
Electric Vehicle Battery Testing Equipment products are sold across the covered segments and applications.
The Electric Vehicle Battery Testing Equipment Market covers products identified by the covered segments and sold in the assessed formats for the leading applications. The assessment includes the leading segments, the segment share leaders and the countries that drive the fastest growth. Other uses are included when the product is sold within the assessed scope.
What is included in the scope?Electric Vehicle Battery Testing Equipment is assessed across the covered segments and regions with company coverage tied to named providers.
The scope includes the covered segments and regions. Coverage spans the leading segments and the application base that drives demand. The country view includes the listed countries and their projected growth, while the regional view covers North America, Latin America, Europe, East Asia, South Asia and Pacific, and the Middle East and Africa. Company coverage includes the named providers listed in the competitive section.
What is excluded from the scope?Products outside the assessed segments and applications are outside this market.
The scope excludes products that do not sit within the covered segments. General alternatives and adjacent categories are outside the scope unless sold within the assessed definition. Related services and supporting equipment that are not directly tied to the covered product are excluded, keeping the market sizing consistent with the stated definition.
How Was the Analysis Built?
The analysis draws on 120+ sources and 35+ company portfolios. It covers 25+ countries and more than 20 industry interviews.
- Primary Research: Primary research includes discussions with manufacturers and service providers. It covers distributors, end users and subject-matter experts. These conversations examine purchasing priorities and channel requirements.
- Desk Research: Desk research covers official statistics and regulatory publications. It reviews company literature, trade data and standards. Every source used in the analysis is documented in the bibliography.
- Market Sizing and Forecasting: Market estimates combine historical performance with demand indicators. The model reviews pricing trends, segment shares and country-level growth. Barriers to market expansion are tested before the forecast is finalized.
- Data Validation and Update Cycle: Findings are validated by comparing interviews with public data and company activity. Regular updates review launches, sourcing shifts and changes in customer adoption.
Segmentation
What is the report's scope and coverage?
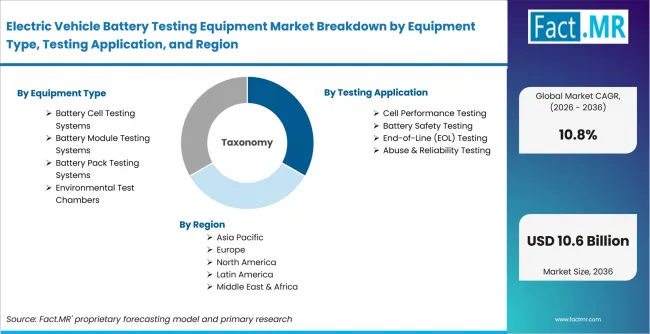
Electric Vehicle Battery Testing Equipment Market Breakdown By Equipment Type, Testing Application, And Region | Source: Fact.MR
| Attribute | Details |
|---|---|
| Quantitative Units | USD billion in 2026 to USD billion by 2036 at a CAGR |
| Market Definition | Electric Vehicle Battery Testing Equipment products sold across the covered segments and applications |
| Segments Covered | Equipment Type; Testing Application; End-use Industry; Customer Category; Testing Technology |
| Regions Covered | North America; Latin America; Europe; East Asia; South Asia and Pacific; Middle East and Africa |
| Countries Covered | China; USA; Germany; South Korea; Japan; India; France |
| Key Companies Profiled | Chroma ATE Inc.; Arbin Instruments; AVL List GmbH; HIOKI E.E. Corporation; Keysight Technologies, Inc.; and others |
| Forecast Period | 2026 to 2036 |
| Approach | Hybrid top-down and bottom-up approach using segment demand; share; country growth; channel visibility; pricing; and company portfolio review |
Source: Fact.MR analysis. Updated Aug 6, 2026
Frequently Asked Questions
Which Equipment Type leads the market?
Which Testing Application leads the market?
Which End-use Industry leads the market?
Which Customer Category leads the market?
Which Testing Technology leads the market?
Which country records the highest listed CAGR?
What is the primary driver in this market?
What is the main restraint?
Which companies are included in the market assessment?
Who worked on this report


Preview the report firsthand - request a free sample
Free SampleGet the brochure for pricing and purchase details
Download PDF