- Market Value (2025): USD 2.4 Bn
- Estimated Value (2026): USD 2.7 Bn
- Forecast Value (2036): USD 8.3 Bn
- CAGR (2026-2036): 11.9%
What is the Motor Predictive Monitors Market forecast to be worth by 2036?
USD 2.7 billion in 2026 to USD 8.3 billion by 2036 at an 11.9% CAGR.
- The Motor Predictive Monitors Market reached USD 2.4 billion in 2025.
- Demand is projected to increase from USD 2.7 billion in 2026 to USD 8.3 billion by 2036.
- The market is forecast to record an 11.9% CAGR from 2026 to 2036 as reliability engineers and plant managers shift fixed service routines toward condition-based motor decisions.
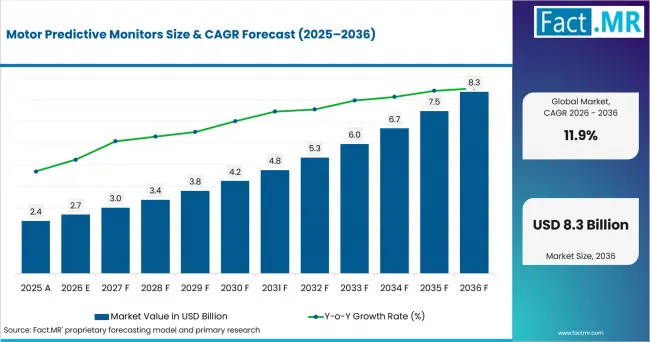
Motor Predictive Monitors Value Analysis | Source: Fact.MR
What are the defining numbers behind Motor Predictive Monitors Market growth?
USD 5.6 billion absolute opportunity by 2036, led by wireless sensor nodes, vibration analysis and oil & gas and chemicals.
- Demand Drivers in the Market
- Reliability engineers need motor-fault visibility before bearing wear, misalignment or insulation stress moves into a forced outage.
- Energy managers need loaded-motor data. The IEA 4E Electric Motor Systems Platform reported in December 2025 that electric motor systems accounted for 53% of global electricity consumption in 2023.
- Maintenance planners need alerts that lead to clear action when vibration patterns or current signatures point to a repair window.
- Process operators need remote motor data in hazardous areas where wireless nodes and drive-integrated analytics reduce manual route checks.
- Key Segments Analyzed
- By Monitoring Method: Vibration analysis is expected to hold 31.0% share in 2026 because it captures bearing, imbalance and misalignment behavior that maintenance teams already recognize.
- By Hardware Form: Wireless sensor nodes are projected to account for 34.0% share in 2026 as brownfield plants need broad asset coverage with limited cabling work.
- By Motor Size: 10-75 kW motors are anticipated to capture 29.0% share in 2026 due to their wide use across pumps, fans and conveyors.
- By Industry: Oil & gas and chemicals are estimated to represent 24.0% share in 2026 owing to remote assets, hazardous zones and high downtime cost.
- Analyst Opinion at Fact.MR
- Fact.MR Principal Consultant Shambhu Nath Jha states, “Motor monitoring is shifting from alarm collection to decision support. Plant teams are asking whether a vibration alert, current signature or thermal pattern gives them enough confidence to schedule work before a forced stop. Demand is expected to concentrate around suppliers that combine sensor placement guidance, clear diagnostics and simple links to plant systems.”
- Strategic Implications
- Sensor suppliers should prove that devices capture motor signals consistently across mounting positions and variable-speed operating profiles.
- Software vendors should connect alerts with asset records and work-order systems so maintenance teams can act through automated data flow.
- Motor OEMs should package monitoring with drives and service agreements for pumps, fans and compressors that operate continuously.
- Service providers should combine route-based inspections with wireless nodes for plants that are moving toward permanent monitoring in stages.
Japan is projected to record 14.1% CAGR through 2036 supported by machinery investment and factory automation. France is anticipated to post 13.1% CAGR as manufacturing recovery and industrial electrification guide motor-system upgrades. The UK is estimated to advance at 12.5% CAGR as water investment increases pump-monitoring requirements. Germany is forecast to hold 11.8% CAGR owing to export-linked manufacturing and industrial reliability programs. The USA is expected to reach 9.5% CAGR because large process industries already use structured maintenance programs.
How does the Motor Predictive Monitors Market break down by segment?
Wireless sensor nodes lead Hardware Form at 34.0%; vibration analysis leads Monitoring Method at 31.0%.
Which Monitoring Method dominates?
Vibration analysis holds 31.0% share in 2026.
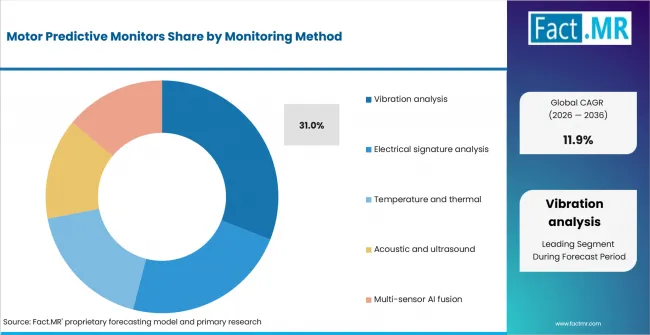
Motor Predictive Monitors Analysis By Monitoring Method | Source: Fact.MR
Vibration analysis leads because it maps directly to common motor failure modes such as imbalance, looseness and bearing wear. Reliability teams already understand vibration routes, making permanent vibration nodes easier to justify. Emerson released AMS Machine Works version 1.8 in April 2025 to unite modern condition-monitoring hardware data and support better decisions for process industries.
What leads the Hardware Form segment?
Wireless sensor nodes account for 34.0% share in 2026.
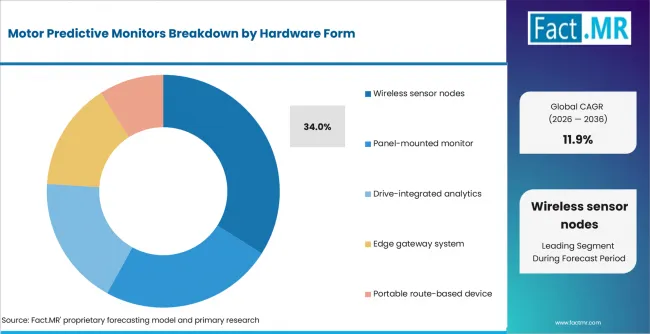
Motor Predictive Monitors Analysis By Hardware Form | Source: Fact.MR
Wireless sensor nodes lead Hardware Form as plants want broader motor coverage with limited wiring across pump skids and production cells. Fluke Reliability and Treon announced a May 2025 partnership to build a wireless condition-monitoring and industrial asset diagnostic ecosystem. The partnership combines wireless condition monitoring, IoT connectivity and AI-based diagnostics, with Treon contributing device technology spanning high-volume screening and diagnostic sensors for industrial assets.
How does Motor Size shape demand?
10-75 kW motors capture 18.0% share in 2026.
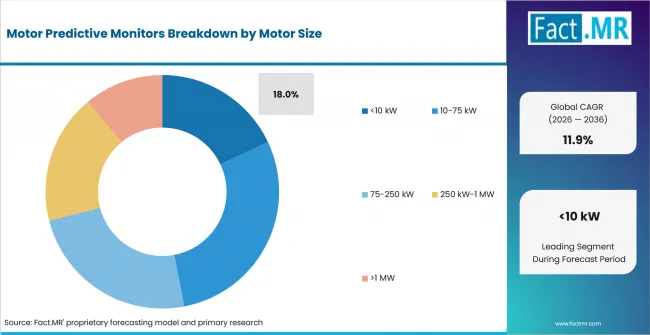
Motor Predictive Monitors Analysis By Motor Size | Source: Fact.MR
The 10-75 kW band leads because these motors are common in pumps, fans, conveyors and auxiliary drives. They are valuable enough to monitor continuously, yet numerous enough for wireless programs to scale.
What supports Oil & gas and chemicals within Industry?
Oil & gas and chemicals represent 24.0% share in 2026.
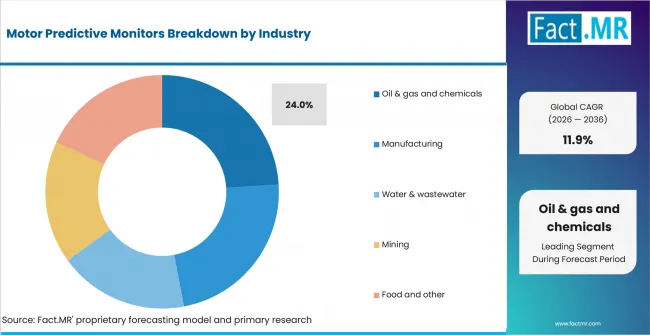
Motor Predictive Monitors Analysis By Industry | Source: Fact.MR
Oil and gas and chemical plants lead Industry because motor-driven pumps and compressors operate in continuous processes. The U.S. Energy Information Administration forecast on August 12, 2026 that U.S. marketed natural gas production would average 122.5 Bcf/d in 2026. Large production networks give operators a clear reason to monitor motors tied to flow, pressure and safe process continuity.
What is accelerating Motor Predictive Monitors Market adoption, and what is holding it back?
Demand is expected to rise through continuous reliability monitoring and motor-energy scrutiny. Adoption is moderated by integration effort, alarm confidence and skills availability.
Drivers Impact Analysis
| DRIVER | (~) % IMPACT ON CAGR | GEOGRAPHIC RELEVANCE | IMPACT TIMELINE |
|---|---|---|---|
| Condition-based maintenance for motor-driven equipment | +1.8% | Global | Short term (<=2 years) |
| Wireless sensor coverage for distributed motors | +1.4% | North America, Europe, East Asia | Medium term (2-4 years) |
| Energy-efficiency pressure in motor systems | +1.1% | Global | Medium term (2-4 years) |
| Drive-integrated electrical signature analysis | +0.8% | Oil & gas, chemicals, water | Long term (>=4 years) |
- Condition-based maintenance for motor-driven equipment: Predictive monitors help operators identify developing faults before motors disrupt pumps, fans, compressors, and other critical equipment. Continuous condition monitoring supports planned maintenance, reduces unexpected stoppages, and improves equipment availability across production environments.
- Wireless sensor coverage for distributed motors: Wireless monitoring nodes help plants extend condition-monitoring coverage across older facilities, remote skids, and lower-criticality assets. They are particularly useful where installing new cabling would interrupt operations or make monitoring uneconomical.
- Energy-efficiency pressure in motor systems: Predictive monitoring helps energy and maintenance teams identify electrical, thermal, and mechanical conditions that can increase energy use. Asset-level visibility allows operators to address inefficient operation before it becomes a recurring operating cost.
- Drive-integrated electrical signature analysis: Electrical signature analysis can extend motor monitoring to submerged, high-temperature, hazardous, or difficult-to-access locations where field sensors are harder to install. Cabinet-side monitoring supports retrofit programs across process plants with large installed drive bases.
Opportunity Impact Analysis
| OPPORTUNITY | (~) % IMPACT ON CAGR | GEOGRAPHIC RELEVANCE | IMPACT TIMELINE |
|---|---|---|---|
| Multi-sensor AI fusion for fault classification | +1.2% | Global | Medium term (2-4 years) |
| Route-to-fixed monitoring migration | +0.9% | North America, Western Europe | Short term (<=2 years) |
| Water and process asset programs | +0.8% | UK, USA, France | Medium term (2-4 years) |
- Multi-sensor AI fusion: Platforms that combine vibration, thermal, acoustic, and electrical-current data can provide richer context for motor fault classification. Multi-sensor analysis helps distinguish mechanical, thermal, and electrical problems and can extend predictive monitoring across a wider range of rotating equipment.
- Route-to-fixed monitoring migration: Plants that rely on handheld inspection routes can begin by installing permanent monitoring nodes on assets with recurring failures. Once alert quality and workflow integration are proven, fixed monitoring can expand across a broader portion of the motor and rotating-equipment base.
- Water and process asset programs: Pump stations, treatment facilities, and other distributed process assets create opportunities for wireless condition monitoring. Remote monitoring can help operators track motor and pump health across dispersed locations while supporting maintenance planning and reducing dependence on frequent manual inspection routes.
Restraint Impact Analysis
| RESTRAINT | (~) % IMPACT ON CAGR | GEOGRAPHIC RELEVANCE | IMPACT TIMELINE |
|---|---|---|---|
| Alarm-confidence requirements in mixed motor fleets | -0.5% | Global | Short term (<=2 years) |
| Legacy controls and data-normalization effort | -0.4% | North America, Europe | Medium term (2-4 years) |
| Reliability skills concentrated in large plants | -0.3% | Global | Long term (>=4 years) |
- Alarm-confidence requirements in mixed motor fleets: Maintenance teams need alerts that reflect actual fault behavior across changing motor loads, speeds, and operating conditions. Poorly tuned thresholds can reduce trust in automated monitoring, making model calibration and application-specific validation important before wider deployment.
- Legacy controls and data-normalization effort: Older drives, PLCs, and historians often require gateways, protocol conversion, and data normalization before condition data can support maintenance workflows. Integration complexity can therefore determine how quickly predictive monitoring expands across brownfield facilities.
- Reliability skills concentrated in large plants: Smaller facilities may lack in-house vibration and diagnostics expertise and often depend on external service partners for fault interpretation. Supplier-led analysis, training, and remote support can therefore play an important role in extending adoption beyond large process plants.
Which countries are scaling the Motor Predictive Monitors Market through 2036?
- The country comparison spans 4.54 percentage points and forms three practical growth bands across the forecast period.
- Japan remains 0.94 percentage point above France due to machinery orders, automation depth and maintenance digitization.
- France remains 0.63 percentage point above the UK as manufacturing output and industrial electrification support monitoring needs.
- The UK remains 0.68 percentage point above Germany as water-sector investment widens pump and motor monitoring needs.
- Germany remains 2.29 percentage points above the USA owing to export-linked machinery production and structured plant maintenance.
- The USA closes the displayed range through scale in manufacturing, oil and gas and chemicals.
Comparable CAGRs create different entry conditions due to motor-fleet age, energy cost, plant digitization and maintenance staffing. Full report coverage includes North America, Latin America, Western Europe, Eastern Europe, East Asia, South Asia & Pacific, Middle East & Africa.
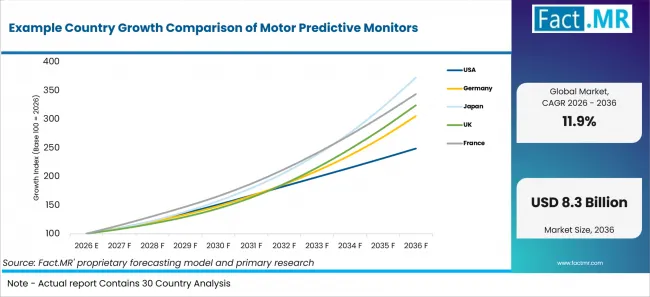
Example Country Growth Comparison Of Motor Predictive Monitors | Source: Fact.MR
| Country | CAGR 2026-2036 |
|---|---|
| Japan | 14.1% |
| France | 13.1% |
| United Kingdom | 12.5% |
| Germany | 11.8% |
| United States | 9.5% |
How does Japan perform?
14.1% CAGR, supported by machinery orders and automation intensity.
Japan’s factory and machinery base gives predictive monitors a clear path across motors used in pumps, machine tools and production lines. The Cabinet Office reported that the total value of machinery orders received by 280 manufacturers increased 23.8% in December 2025 from the previous month on a seasonally adjusted basis. Monitoring suppliers are expected to benefit where manufacturers want condition data with simpler wiring in motor rooms.
What supports France adoption?
13.1% CAGR, supported by manufacturing recovery and electrification planning.
France is building demand around plant reliability and energy use in process industries. INSEE reported on June 5, 2026 that manufacturing output increased 1.3% in March 2026, following a 0.1% decline in February. Motor predictive monitors are expected to gain use where manufacturers connect vibration, temperature and electrical data with energy management and maintenance planning.
What supports the United Kingdom’s growth?
12.5% CAGR, backed by water investment and asset-reliability needs.
The UK has a clear pump-monitoring route through water and wastewater infrastructure. The Environment Agency reported in October 2025 that water companies in England were allocated a record GBP 98 billion for 2025 to 2030 under Ofwat’s price review. Wireless motor monitors are expected to support stations where operators need early warning across distributed assets.
What is supporting Germany’s adoption?
11.8% CAGR, supported by export scale and industrial reliability upgrades.
Germany’s manufacturing base creates demand for monitors that fit documented maintenance routines and drive-heavy automation cells. Destatis reported on August 20, 2026 that German exports amounted to EUR 817.8 billion in the first half of 2026. Predictive monitors are expected to fit machinery, chemicals and automotive plants where uptime protection and energy tracking influence maintenance decisions.
What supports USA adoption?
9.5% CAGR, shaped by manufacturing scale and process-industry maturity.
The USA remains a large installed-base market for motors used in manufacturing, oil and gas and chemicals. The U.S. Census Bureau reported in September 2026 that manufactured-goods orders reached USD 663.6 billion in July 2026. Predictive-monitor adoption is expected to expand where operators combine wireless nodes with existing reliability programs and plant data systems.
Who leads the Motor Predictive Monitors Market?
ABB is active across motors, drives and condition-monitoring solutions. Its Digital Powertrain portfolio provides condition intelligence across motors, drives and driven equipment, while its SAM4 solution enables monitoring from sensors installed in the MNS motor-control-center cabinet rather than directly on the machine. This approach can support applications where equipment is hazardous or difficult to access.
Siemens competes through Senseye Predictive Maintenance, Siplus CMS 1200 and industrial automation integration. In June 2025, its Sachsenmilch deployment combined AI-based predictive maintenance with vibration monitoring and control-system data, while further integration with SAP Plant Maintenance was planned. Emerson is positioned through AMS Machine Works, whose version 1.8 was released in April 2025 to unite current-generation AMS condition-monitoring hardware data within a single platform.
SKF, Fluke Reliability and Augury broaden the competitive set across condition-monitoring expertise, route-based vibration tools and AI diagnostics. SKF signed an agreement in March 2026 to acquire G-Tech Instruments and strengthen its condition-monitoring portfolio. Fluke supports route-based vibration monitoring through handheld tools, while Augury provides continuous machine-health analytics, including AI diagnostics for slow-rotating assets.
Competitive differentiation is likely to reflect signal quality, installation flexibility, analytics reliability and the ability to convert condition data into actionable maintenance decisions. Vendors that combine continuous monitoring with technical service and integration into maintenance systems may gain stronger positions as plants expand beyond periodic route-based checks.
Which companies are the key providers?
Key companies include ABB; Siemens; Emerson; SKF; Fluke Reliability; Augury.
- ABB
- Siemens
- Emerson
- SKF
- Fluke Reliability
- Augury
Bibliography
- ABB. (2025, November 3). ABB launches embedded ESA technology in drives, turning modernization into a digital catalyst.
- Augury. (2025, March 11). Augury launches AI predictive maintenance for ultra low RPM.
- Cabinet Office, Government of Japan. (2026, February 19). Machinery orders in December, 2025 and forecast for Jan.-Mar. 2026.
- Emerson. (2025, April 2). Emerson’s asset management software unifies equipment reliability data in a secure, easy-to-use, integrated platform.
- Environment Agency. (2025, October 23). Water and sewerage companies in England: Environmental performance report 2024.
- Federal Statistical Office (Destatis). (2026, August 20). German exports in first half of 2026: +3.9% on the same period a year earlier.
- Fluke Reliability. (2025, May 29). Fluke Reliability and Treon partner to elevate industrial asset performance with AI diagnostics and IoT sensors.
- INSEE. (2026, June 5). In April 2026, manufacturing output increased by 0.4%.
- Electric Motor Systems Platform. (2025, December 19). Policy brief #9 – Electric motor systems: Why are they important?
- Ofwat. (2025, November 27). PR24 Reconciliation Rulebook: Guidance Document.
- Siemens. (2025, June 4). AI-supported predictive maintenance: Siemens and Sachsenmilch are breaking newground in the food and beverage industry.
- U.S. Census Bureau. (2026, September 2). Monthly full report on manufacturers’ shipments, inventories, & orders.
- U.S. Energy Information Administration. (2026, August 12). United States on track for record natural gas production in 2026.
This Report Answers
- The report explains where motor predictive monitors are used across monitoring method and hardware form. It also covers motor size and industry, together with regional and country coverage.
- Segment analysis identifies the leading subsegments and the operational reasons plant teams prioritize them.
- Country analysis examines the listed markets and the industrial mechanisms supporting motor-monitoring deployment.
- Competitive analysis reviews current providers across condition monitoring, drives and reliability software.
- Application analysis assesses how uptime, energy use and maintenance staffing influence purchase decisions for motor monitoring.
What does the Motor Predictive Monitors Market cover?
The Motor Predictive Monitors Market covers monitoring systems that detect motor faults before they interrupt plant operations. It includes sensors and embedded analytics used for vibration and electrical signature checks. Temperature and acoustic detection are also included. The scope overlaps with predictive maintenance programs and machine condition monitoring systems where rotating assets require continuous health visibility.
The assessment covers motors used in pumps and fans. It also covers compressors, conveyors and process equipment. Drive-linked diagnostics and panel-mounted monitoring are included where plants use motor protection devices to connect asset protection with maintenance planning. The evaluation addresses industrial motor systems across discrete and process industries.
What is included in the scope?
The scope includes wireless nodes, portable route tools, edge gateways and drive-integrated monitors that capture motor condition signals. It includes wireless equipment maintenance tools when motor diagnostics are a core function and asset performance management platforms when they turn motor alerts into maintenance actions.
It includes handheld vibration analyzers used in route-based programs and permanent systems deployed on medium and high power motors. The scope covers hardware and software sold to process and discrete operations across these industries.
What is excluded from the scope?
The scope excludes general industrial diagnostic tools when they are sold as separate inspection products. Standalone thermal cameras, clamp meters and inspection tools fall outside the boundary unless they are configured as part of a motor predictive monitoring program.
The scope also excludes vehicle-only drivetrain vibration monitoring systems and smart CNC sensors when they target tool wear, machining quality or vehicle drivetrain faults rather than electric-motor condition monitoring in industrial operations.
How Was the Analysis Built?
The analysis draws on 120+ sources, 35+ company portfolios, 25+ countries, and more than 20 industry interviews.
- Primary Research: Primary research includes discussions with manufacturers, service providers, technology developers, distributors, end users, and subject-matter experts. These conversations examine purchasing priorities, product adoption, operational challenges, approval requirements, competitive positioning, and the factors that influence wider market acceptance.
- Desk Research: Desk research covers government statistics, regulatory publications, company filings, trade data, technical studies, industry associations, standards, public policy, and other authoritative sources. Every source used in the analysis is documented in the bibliography.
- Market Sizing and Forecasting: Market estimates combine historical performance, demand indicators, pricing and volume trends, segment shares, company participation, country-level growth, adoption patterns, investment activity, and barriers to market expansion.
- Data Validation and Update Cycle: Findings are validated by comparing primary interviews with public data, company activity, regulatory changes, trade patterns, and industry developments. Regular updates review new product launches, capacity changes, partnerships, approvals, and shifts in commercial adoption.
What is the report’s scope and coverage?
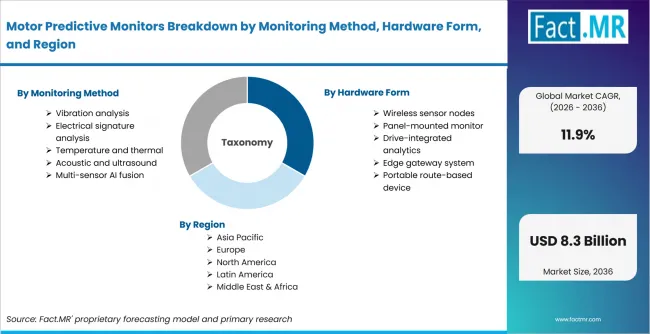
Motor Predictive Monitors Breakdown By Monitoring Method, Hardware Form, And Region | Source: Fact.MR
| Attribute | Details |
|---|---|
| Quantitative Units | USD billion |
| Market Definition | Devices, embedded analytics and connected monitoring systems used to track electric-motor condition through vibration, electrical signature, temperature, acoustic or multi-sensor data. |
| Monitoring Method | Vibration analysis; Electrical signature analysis; Temperature and thermal; Acoustic and ultrasound; Multi-sensor AI fusion |
| Hardware Form | Wireless sensor nodes; Panel-mounted monitor; Drive-integrated analytics; Edge gateway system; Portable route-based device |
| Motor Size | <10 kW; 10-75 kW; 75-250 kW; 250 kW-1 MW; >1 MW |
| Industry | Oil & gas and chemicals; Manufacturing; Water & wastewater; Mining; Food and other |
| Regions Covered | North America; Latin America; Western Europe; Eastern Europe; East Asia; South Asia & Pacific; Middle East & Africa |
| Countries Covered | United States; Germany; Japan; United Kingdom; France |
| Key Companies Profiled | ABB; Siemens; Emerson; SKF; Fluke Reliability; Augury |
| Forecast Period | 2026 to 2036 |
| Approach | Hybrid top-down and bottom-up approach using installed motor base, monitoring-method adoption, hardware form mix, motor-size exposure, industry demand and provider portfolio review. |
How is the market segmented?
-
By Monitoring Method
- Vibration analysis
- Electrical signature analysis
- Temperature and thermal
- Acoustic and ultrasound
- Multi-sensor AI fusion
-
By Hardware Form
- Wireless sensor nodes
- Panel-mounted monitor
- Drive-integrated analytics
- Edge gateway system
- Portable route-based device
-
By Motor Size
- <10 kW
- 10-75 kW
- 75-250 kW
- 250 kW-1 MW
- >1 MW
-
By Industry
- Oil & gas and chemicals
- Manufacturing
- Water & wastewater
- Mining
- Food and other
-
By Region
- North America
- Latin America
- Western Europe
- Eastern Europe
- East Asia
- South Asia & Pacific
- Middle East & Africa