- Market Value (2025): USD 1.5 Bn
- Estimated Value (2026): USD 1.7 Bn
- Forecast Value (2036): USD 7.1 Bn
- CAGR (2026-2036): 15.1%
What is the OT Data Bridges Retail / FMCG Market forecast to be worth by 2036?
USD 1.7 billion in 2026 to USD 7.1 billion by 2036 at a 15.1% CAGR.
- The OT Data Bridges Retail / FMCG Market crossed a valuation of USD 1.5 billion in 2025.
- Demand is projected to increase from USD 1.7 billion in 2026 to USD 7.1 billion by 2036.
- The market is forecast to record 15.1% CAGR from 2026 to 2036 as retail and FMCG teams connect production data with analytics systems.
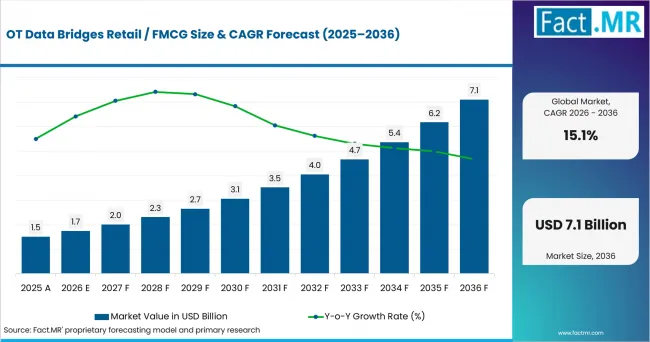
Ot Data Bridges Retail Fmcg Value Analysis | Source: Fact.MR
What are the defining numbers behind OT Data Bridges Retail / FMCG Market growth?
USD 5.4 billion absolute opportunity by 2036, led by edge gateways, cloud analytics and factory performance use cases.
- Demand Drivers in the Market
- Plant teams need edge gateways that normalize PLC data for business applications.
- Retail technology teams need secure OPC and MQTT bridges for controlled analytics feeds.
- FMCG quality teams need traceability links between process equipment and MES platforms.
- Cold-chain managers need refrigeration data in cloud systems to detect temperature exceptions.
- Key Segments Analyzed
- By Bridge Layer: Edge gateway is expected to hold 31.0% share in 2026 owing to its role as the first controlled translation layer.
- By OT Source: Packaging lines are projected to account for 28.0% share in 2026 as FMCG plants prioritize line-speed visibility.
- By IT Destination: Cloud analytics is anticipated to capture 30.0% share in 2026 since retailers need comparable plant and warehouse data.
- By Retail / FMCG Use: Factory performance is estimated to represent 31.0% share in 2026, supported by OEE and downtime analysis.
- Analyst Opinion at Fact.MR
- Shambhu Nath Jha, Principal Consultant at Fact.MR, states, “Retail and FMCG operators are using OT data bridges for decisions that affect stock and waste. Packaging stops, refrigeration events and warehouse movements need clean data models. Suppliers that combine protocol depth and secure edge deployment are expected to stay closer to the buying problem.”
- Strategic Implications
- Gateway vendors should show how machine tags become usable OEE and traceability data.
- Retail IT teams should define which OT data moves to cloud systems and which data remains local.
- System integrators should maintain reusable templates for packaging and refrigeration assets.
- Cybersecurity teams should validate segmented bridge designs before multi-site rollouts.
Italy is forecast to record 19.0% CAGR through 2036, led by food-sector modernization. Germany is projected to post 15.9% CAGR as cloud adoption supports OT-to-IT integration. France is anticipated to advance at 14.8% CAGR, supported by retail recovery. The USA is estimated to reach 14.4% CAGR as e-commerce raises the value of plant-to-cloud visibility. The UK is forecast to record 14.1% CAGR as food manufacturing scale supports connected operations.
How does the OT Data Bridges Retail / FMCG Market break down by segment?
Edge gateway leads Bridge Layer at 31.0%; factory performance leads Retail / FMCG Use at 31.0%.
Which Bridge Layer dominates?
Edge gateway will hold 31.0% share in 2026.
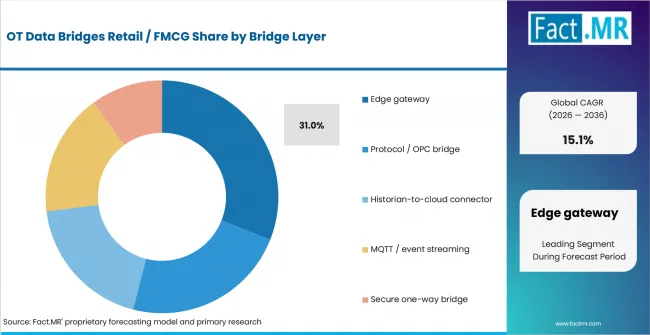
Ot Data Bridges Retail Fmcg Analysis By Bridge Layer | Source: Fact.MR
Edge gateways lead since they operate close to PLCs and line controllers. They translate protocols before data reaches higher-level systems. Siemens' Industrial Edge Hub Access page lists OPC UA Connector and Cloud Connector (MQTT) among available applications.
What leads the OT Source segment?
Packaging lines will account for 28.0% share in 2026.
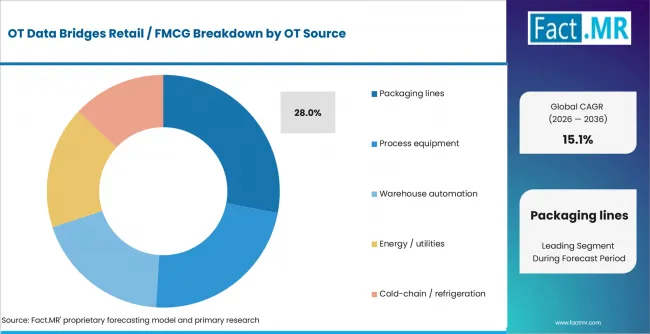
Ot Data Bridges Retail Fmcg Analysis By Ot Source | Source: Fact.MR
Packaging lines lead because speed and downtime affect fill rates. FMCG operators need line data to reach MES, OEE and traceability systems. Kepware (Velotic) Edge supports OPC UA and MQTT communication with SCADA, MES, AWS and Azure.
How does IT Destination shape demand?
Cloud analytics will hold 30.0% share in 2026.
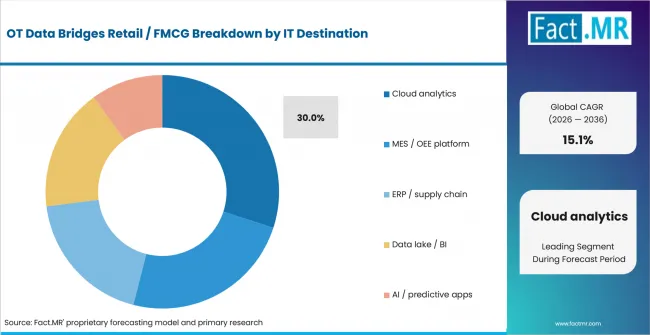
Ot Data Bridges Retail Fmcg Analysis By It Destination | Source: Fact.MR
Cloud analytics leads as retailers compare performance across plants and warehouses. Cloud systems need consistent tag structures before dashboards can be trusted. In its March 10, 2026 release, the U.S. Census Bureau estimated seasonally adjusted U.S. retail e-commerce sales at USD 316.1 billion in the fourth quarter of 2025.
What supports Factory Performance within Retail / FMCG Use?
Factory performance will lead with 31.0% share in 2026.
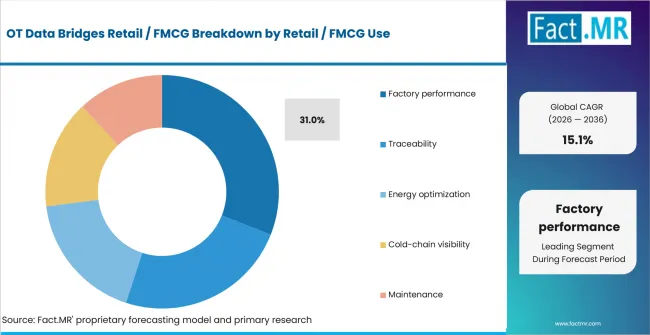
Ot Data Bridges Retail Fmcg Analysis By Retail Fmcg Use | Source: Fact.MR
Factory performance leads because OEE and shift reporting depend on clean machine data. Rockwell Automation FactoryTalk DataMosaix brings IT, OT and engineering data together. Multi-line FMCG sites need comparable operating measures across sites.
What is accelerating OT Data Bridges Retail / FMCG Market adoption, and what is holding it back?
Demand is expected to rise through packaging-line visibility and cloud analytics needs. Growth is constrained by OT cybersecurity reviews and legacy systems.
Drivers Impact Analysis
| DRIVER | (~) % IMPACT ON CAGR | GEOGRAPHIC RELEVANCE | IMPACT TIMELINE |
|---|---|---|---|
| Packaging-line data visibility | +1.8% | Global | Short term (<= 2 years) |
| Cloud analytics for multi-site operations | +1.4% | North America, Europe | Medium term (2-4 years) |
| Cold-chain and traceability monitoring | +1.1% | USA, UK, France, Italy | Medium term (2-4 years) |
| Protocol modernization through OPC UA and MQTT | +0.9% | Global | Long term (>= 4 years) |
Source: Fact.MR analysis. Updated Sep 10, 2026
Opportunity Impact Analysis
| OPPORTUNITY | (~) % IMPACT ON CAGR | GEOGRAPHIC RELEVANCE | IMPACT TIMELINE |
|---|---|---|---|
| Unified namespace projects for FMCG plants | +1.2% | Europe, North America | Medium term (2-4 years) |
| Managed edge gateways for smaller factories | +0.9% | Global | Short term (<= 2 years) |
| Energy and waste analytics from OT data | +0.7% | Western Europe | Long term (>= 4 years) |
Source: Fact.MR analysis. Updated Sep 10, 2026
Restraints Impact Analysis
| RESTRAINT | (~) % IMPACT ON CAGR | GEOGRAPHIC RELEVANCE | IMPACT TIMELINE |
|---|---|---|---|
| OT cybersecurity approval cycles | -0.7% | Global | Short term (<= 2 years) |
| Legacy tag structures and poor asset context | -0.5% | Europe, North America | Medium term (2-4 years) |
| Shortage of OT and data-engineering skills | -0.4% | Global | Long term (>= 4 years) |
Source: Fact.MR analysis. Updated Sep 10, 2026
Which countries are scaling the OT Data Bridges Retail / FMCG Market through 2036?
- The country comparison spans 4.9 percentage points across the forecast period.
- Italy remains 3.1 percentage points above Germany due to food-sector modernization.
- Germany remains 1.1 percentage points above France as cloud use supports OT-to-IT projects.
- France remains 0.4 percentage point above the USA through retail recovery.
- The USA remains 0.3 percentage point above the UK as e-commerce supports fulfillment visibility.
- The UK closes the displayed range through food manufacturing scale.
Comparable CAGRs create different entry conditions because store networks and cybersecurity controls vary by country. Full report coverage includes North America, Latin America, Western Europe, Eastern Europe, East Asia, South Asia & Pacific, Middle East & Africa.
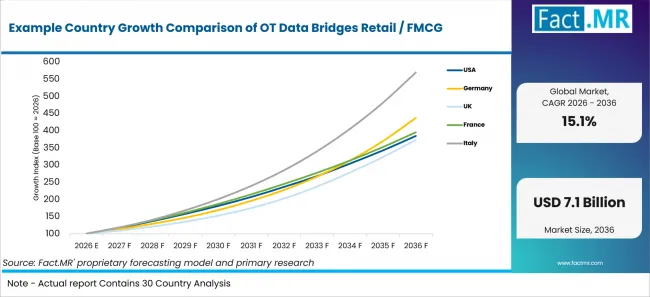
Example Country Growth Comparison Of Ot Data Bridges Retail Fmcg | Source: Fact.MR
| Country | CAGR |
|---|---|
| Italy | 19.0% |
| Germany | 15.9% |
| France | 14.8% |
| United States | 14.4% |
| United Kingdom | 14.1% |
Source: Fact.MR analysis. Updated Sep 10, 2026
What supports Italy adoption?
19.0% CAGR, supported by food-sector scale and accelerating industrial digitalization.
ISTAT reported that Italy’s agri-food sector generated EUR 89 billion in value added in 2025, compared with EUR 83.4 billion in 2024. Demand for OT data bridges rises as manufacturers connect production-line events with retail analytics, traceability and quality systems while reusing common edge connectors across plants.
What is supporting Germany’s adoption?
15.9% CAGR, driven by cloud adoption and Industry 4.0 integration.
Destatis reported that 54% of German enterprises with at least 10 employees used paid cloud computing services in 2025. This strengthens the case for OT data bridges that connect packaging assets and legacy PLC environments with MES, cloud analytics and standardized OPC UA or MQTT-based data models.
How is France developing demand?
14.8% CAGR, supported by industrial digitalization and stronger data integration across FMCG operations.
The European Commission reported that 69.44% of French SMEs had at least basic digital intensity in 2025. This expanding digital base supports demand for bridge software that connects factory traceability, energy monitoring, warehouse automation and cold-chain systems with centralized analytics while maintaining separation from control networks.
What supports USA adoption?
14.4% CAGR, driven by e-commerce scale and complex food-retail operating environments.
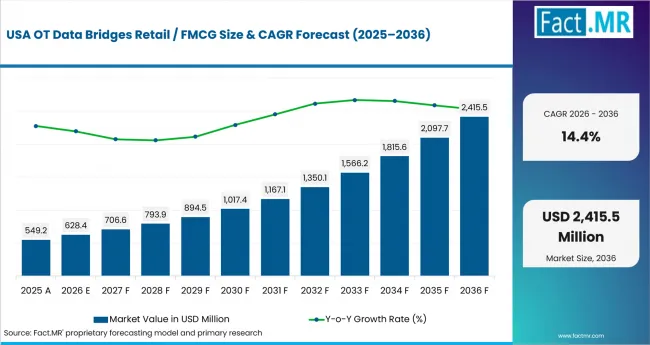
Ot Data Bridges Retail Fmcg Country Value Analysis | Source: Fact.MR
In its March 10, 2026 release, the U.S. Census Bureau initially estimated seasonally adjusted U.S. retail e-commerce sales at USD 316.1 billion in the fourth quarter of 2025. Large digital retail volumes increase the need to connect packaging lines, warehouses and replenishment systems, supporting reusable edge gateways and common data models across multi-site PLC and SCADA estates.
What supports the United Kingdom’s growth?
14.1% CAGR, backed by food-manufacturing scale and growing use of external data infrastructure.
The Office for National Statistics reported that food manufacturing represented 22.9% of total UK manufacturers’ sales in 2025. This substantial operating base supports demand for OT bridges linking packaging, refrigeration and other plant systems with cloud analytics and enterprise reporting while maintaining controlled access to live production data.
Who leads the OT Data Bridges Retail / FMCG Market?
Kepware (Velotic), Siemens, Rockwell Automation, AVEVA, Litmus and HiveMQ are active providers across industrial connectivity, edge gateways and event-streaming layers.
Kepware (Velotic) participates through Kepware Server and Kepware Edge. PTC documents OPC UA protocol translation and interoperability through OPC UA and MQTT, while Kepware Edge provides containerized industrial connectivity for Linux-based environments.
Siemens participates through Industrial Edge and its connector applications. Siemens’ Industrial Edge Hub Access page lists SIMATIC S7 Connector, OPC UA Connector, Cloud Connector (MQTT) and Flow Creator Edge App.
Rockwell Automation participates through FactoryTalk Linx Gateway and FactoryTalk DataMosaix. FactoryTalk Linx Gateway version 6.60.00, released in September 2025, enables third-party clients using OPC UA, RTD and MQTT to obtain data through its standalone data service.
AVEVA participates through CONNECT and AVEVA PI Data Infrastructure. On June 4, 2026, AVEVA announced upcoming CONNECT capabilities including an industrial knowledge graph and a twin builder that applies agentic AI, with these capabilities planned as part of a major CONNECT release in Q1 2027.
Litmus provides an industrial edge data platform that connects industrial assets and structures and contextualizes machine and OT data for downstream applications, analytics and AI. HiveMQ documents MQTT and its publish-subscribe model as a real-time, event-driven foundation for Unified Namespace architectures.
Which companies are the key providers?
Key companies include Kepware (Velotic); Siemens; Rockwell Automation; AVEVA; Litmus; and HiveMQ.
- Kepware (Velotic)
- Siemens
- Rockwell Automation
- AVEVA
- Litmus
- HiveMQ
Bibliography
- Agence nationale de la sécurité des systèmes d'information. (2026, March 11). Panorama de la cybermenace 2025.
- AVEVA. (2026, June 4). AVEVA expands CONNECT in India with new AI capabilities to accelerate industrial intelligence.
- Department for Science, Innovation and Technology, & Home Office. (2026, April 30). Cyber security breaches survey 2025/2026. GOV.UK.
- Department for Science, Innovation and Technology. (2026, June 18). UK Business Data Survey 2026. GOV.UK.
- Deters, J. (2026, February 22). Why MQTT is critical for building a Unified Namespace. HiveMQ.
- European Commission. (2026, June 3). 2026 country report – France (SWD(2026) 210 final).
- Federal Government of Germany. (2026, May 12). Bundeslagebild Cybercrime 2025: Internetkriminalität auf hohem Niveau.
- Insee. (2026, June 18). Activité des formes de vente du commerce de détail: Données annuelles de 2020 à 2025.
- Istat. (2025, December 15). Imprese e ICT – Anno 2025.
- Istat. (2026a, June 12). Economic accounts for agriculture – Year 2025.
- Istat. (2026b, February 5). Retail trade – December 2025.
- National Institute of Standards and Technology. (2026, April 15). NIST updates NVD operations to address record CVE growth.
- Office for National Statistics. (2026, July 24). UK manufacturers' sales by product: 2025.
- PTC. (2025a, November 25). Kepware Edge 1.0.236.0.
- PTC. (2025b, November 25). Kepware Server 7.0.236.0.
- Rockwell Automation. (2025, September). Release notes: FactoryTalk Linx Gateway, version 6.60.00.
- Statistisches Bundesamt (Destatis). (2025, November 24). Jedes zweite Unternehmen nutzt kostenpflichtige Cloud-Services.
- Statistisches Bundesamt (Destatis). (2026, January 7). Einzelhandelsumsatz im Jahr 2025 real voraussichtlich um 2,4 % höher als im Vorjahr.
- U.S. Census Bureau. (2026, March 10). Quarterly retail e-commerce sales: 4th quarter 2025.
- Zeballos, E., & Sinclair, W. (2026, June 11). Total U.S. food spending reached $2.51 trillion in 2025. Economic Research Service, U.S. Department of Agriculture.
This Report Answers
- The report explains OT data bridges by bridge layer, OT source, IT destination and retail or FMCG use.
- Segment analysis identifies the leading subsegments and the operational reasons retailers prioritize them.
- Country analysis examines the listed markets and the infrastructure or policy mechanisms supporting bridge deployment.
- Competitive analysis reviews current providers across industrial connectivity, edge data platforms and MQTT event streaming.
- Application analysis assesses how packaging and refrigeration data influence purchase decisions.
What does the OT Data Bridges Retail / FMCG Market cover?
The OT Data Bridges Retail / FMCG Market covers software and gateway layers that connect machine data with business systems. It overlaps with adjacent coverage of industrial automation control systems, where plant software and control systems form the wider operating base.
The assessment covers cloud analytics, MES and OEE platforms, ERP and supply-chain systems, data lakes and predictive applications. Retail use cases connect naturally with research on retail analytics platforms, where store and inventory data rely on clean upstream signals.
What is included in the scope?
The scope includes licensed bridge software, edge gateway software, protocol translation, historian connectors and MQTT event streaming used in retail and FMCG operations. The scope also includes controlled integration with smart factory platforms when the bridge layer moves machine data into higher-level applications.
It includes data movement from packaging lines, process equipment, warehouse automation, utilities and refrigeration. Related operating environments include food cold chain systems and food distribution networks that need live temperature and location data.
What is excluded from the scope?
The scope excludes general retail analytics software without an OT data bridge function. ERP, MES and OEE platforms sold without machine-data connectors are outside scope.
Raw automation hardware is excluded when sold without bridge software. Standalone storage racks, robotics and automated storage systems are outside scope unless the commercial offer includes data-bridge software.
In-store customer-facing retail technology is excluded unless it connects OT assets with enterprise systems. The boundary stays separate from alternative retailing technologies focused on sales-environment tools.
How Was the Analysis Built?
The analysis draws on 120+ sources, 35+ company portfolios, 25+ countries and more than 20 interviews.
- Primary Research: Interviews include technology developers, integrators, retail operations teams, FMCG plant managers, distributors and end users. They examine adoption, approval requirements and competitive positioning.
- Desk Research: Desk research covers government statistics, regulatory publications, company filings, technical documentation, standards and company sources. The bibliography lists the principal external evidence sources used in the report.
- Market Sizing and Forecasting: Estimates combine historical performance, demand indicators, segment shares, company participation, country growth, adoption patterns and barriers to expansion.
- Data Validation and Update Cycle: Findings are validated against public data, company activity, regulatory changes, technical standards and industry developments. Updates review launches, partnerships and adoption shifts.
Segmentation
What is the report’s scope and coverage?
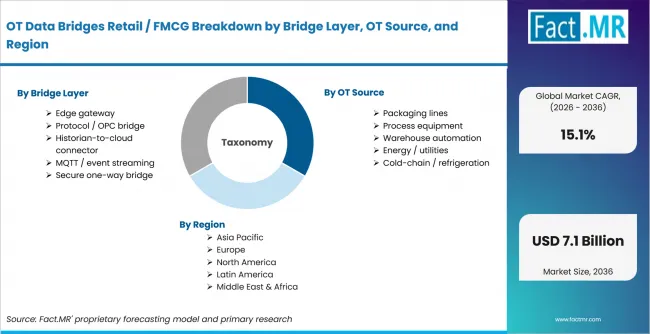
Ot Data Bridges Retail Fmcg Breakdown By Bridge Layer, Ot Source, And Region | Source: Fact.MR
| Attribute | Details |
|---|---|
| Quantitative Units | USD billion |
| Market Definition | Software and gateway layers that move OT data from retail and FMCG assets into IT systems, including edge gateways, OPC bridges, historian connectors, MQTT event streaming and secure one-way bridge designs. |
| Bridge Layer | Edge gateway; Protocol bridge; Historian connector; MQTT event streaming; Secure one-way bridge |
| OT Source | Packaging lines; Process equipment; Warehouse automation; Energy and utilities; Cold-chain refrigeration |
| IT Destination | Cloud analytics; MES and OEE platform; ERP and supply chain; Data lake and BI; AI and predictive apps |
| Retail / FMCG Use | Factory performance; Traceability; Energy optimization; Cold-chain visibility; Maintenance |
| Regions Covered | North America; Latin America; Western Europe; Eastern Europe; East Asia; South Asia & Pacific; Middle East & Africa |
| Countries Covered | United States; Germany; United Kingdom; France; Italy |
| Key Companies Profiled | Kepware (Velotic); Siemens; Rockwell Automation; AVEVA; Litmus; HiveMQ |
| Forecast Period | 2026 to 2036 |
| Approach | Hybrid top-down and bottom-up approach using installed OT assets, software revenue, deployment mix, country adoption, supplier portfolio review and end-use validation. |
Source: Fact.MR analysis. Updated Sep 10, 2026
How is the market segmented?
-
By Bridge Layer
- Edge gateway
- Protocol bridge
- Historian connector
- MQTT event streaming
- Secure one-way bridge
-
By OT Source
- Packaging lines
- Process equipment
- Warehouse automation
- Energy and utilities
- Cold-chain refrigeration
-
By IT Destination
- Cloud analytics
- MES and OEE platform
- ERP and supply chain
- Data lake and BI
- AI and predictive apps
-
By Retail / FMCG Use
- Factory performance
- Traceability
- Energy optimization
- Cold-chain visibility
- Maintenance
-
By Region
- North America
- Latin America
- Western Europe
- Eastern Europe
- East Asia
- South Asia & Pacific
- Middle East & Africa
Frequently Asked Questions
How big is the OT Data Bridges Retail / FMCG Market in 2026?
What is the CAGR of the OT Data Bridges Retail / FMCG Market from 2026 to 2036?
Which bridge layer leads the OT Data Bridges Retail / FMCG Market?
Which Retail / FMCG use leads the OT Data Bridges Retail / FMCG Market?
Who are the leading companies in the OT Data Bridges Retail / FMCG Market?
Who worked on this report


Preview the report firsthand - request a free sample
Free SampleGet the brochure for pricing and purchase details
Download PDF