- Base Value(2025): 132.0 Mn
- Estimated Value(2026): 147.6 Mn
- Forecast Value (2036): 450.2 Mn
- CAGR (2026 - 2036): 11.8%
Precursor Crystallization Tanks Market Overview, Growth Outlook, and Forecast by Fact.MR
- In 2025, the precursor crystallization tanks market was valued at USD 132.0 million.
- Demand for precursor crystallization tanks is projected to grow to USD 147.6 million in 2026 and reach USD 450.2 million by 2036.
- The market is expected to expand at a CAGR of 11.8% during the forecast period.
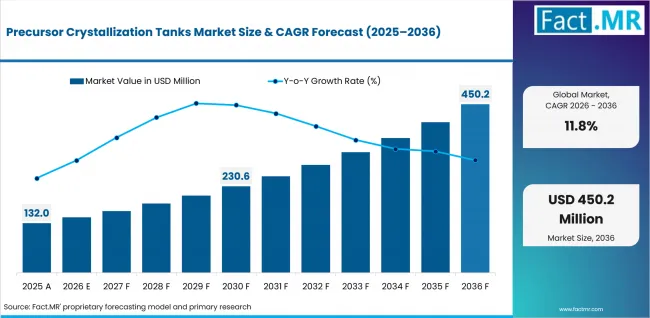
Precursor Crystallization Tanks Market Value Analysis | Source: Fact.MR
Summary of the Precursor Crystallization Tanks Market
- Market Snapshot
- Global precursor crystallization tanks market revenue stood at USD 147.6 million in 2026 and is forecast to reach USD 450.2 million by 2036.
- At an 11.8% CAGR from 2026 to 2036, the market is expected to expand ~3.0x in value, creating an absolute dollar opportunity of USD 302.6 million.
- Market growth will be propelled by increasing investments in lithium-ion battery precursors production, increase in electric vehicle battery chain production, and higher adoption of high-quality crystallization techniques in chemical manufacturing processes.
- Increasing application of automated crystallization techniques and high investment in cathode precursor production plants are driving market demand worldwide.
- Growth in the expansion of battery gigafactories, chemical process plants, and advanced material manufacturing facilities is another key market driver.
- Demand and Growth Drivers
- Growing demand for lithium-ion batteries and cathode precursors in the world
- Increasing investments in EV battery production and battery recycling plants
- Increased usage of continuous crystallization solutions for large-scale industrial production
- Increasing need of high purity crystallization system in the specialty chemical industry
- Development in automation, plc and SCADA based industrial process systems
- Demand for solutions in:
- High-purity precursor crystallization
- Continuous and large-scale industrial processing
- Improved process automation and operational efficiency
- Resistance to corrosion within aggressive chemical environments
- Better particle size distribution and product consistency
- A more energy efficient and less demanding (to maintain) crystallization process
- Smart process monitoring, scalable production
- Product and Segment View
- Batch crystallization tanks account for 43.9% of type share in 2026, emerging as the leading segment due to their operational flexibility, cost efficiency, and widespread usage in specialty chemical and precursor processing applications.
- Stainless Steel accounts for 59.8% of material of construction share in 2026, supported by strong corrosion resistance, durability, and broad industrial applicability.
- Medium Capacity Tanks hold 45.1% of capacity share in 2026, driven by extensive adoption across mid-scale battery precursor and chemical processing plants.
- Geography and Competitive Outlook
- Rising battery precursor production, expanding lithium refining capacity, and growing investments in EV supply chains are driving strong market growth across East Asia, North America, and South Asia & Pacific.
- Major growth markets in the precursor crystallization tanks market include India (13.8% CAGR), Canada (13.4% CAGR), Japan (13.0% CAGR), China (12.7% CAGR), United States (11.6% CAGR), Germany (10.1% CAGR), and South Korea (10.1% CAGR) during the forecast period.
- Market growth is supported by:
- Expansion of lithium-ion battery gigafactories
- Rising investments in cathode active material production
- Increasing adoption of continuous crystallization systems
- Growth in specialty chemical processing infrastructure
- Rising automation in industrial process equipment
- Prominent players in the market include EKATO Group, GEA Group, Sulzer Chemtech, Myande Group, Veolia Water Technologies, SPX FLOW, RCM Thermal Kinetics, Tsukishima JFE Aqua Solution, Swenson Technology, and Pfaudler Group.
- Analyst Opinion
- Shambhu Nath Jha, Principal Consultant at Fact.MR, opines, “CXO Executives should be aware that the source of future competitive advantage in the precursor crystallization tanks market will increasingly hinge on the ability to develop high efficiency continuous crystallization systems, further automation and smarter process-control tools, more robust solutions for lithium-ion battery precursor production, and more corrosion resistant and large scale tank technology that can meet growing global needs from the EV battery, specialty chemical, and advanced material processing sectors.
Precursor Crystallization Tanks Market — At a Glance
| Attribute | Details |
|---|---|
| Market Value 2025 | USD 132.0 Million |
| Market Value 2026 | USD 147.6 Million |
| Market Value 2036 | USD 450.2 Million |
| Absolute Dollar Opportunity | USD 302.6 Million |
| Total Growth | 205.00% |
| CAGR | 11.80% |
| Growth Multiple | 3.0x |
| Key Demand Theme | Rising investments in lithium-ion battery precursor manufacturing, increasing demand for continuous crystallization systems, growing deployment of automated industrial processing equipment, expansion of EV battery supply chains, and increasing requirement for high-purity precursor processing technologies |
| Leading Type Segment | Batch Crystallization Tanks |
| Type Segment Share | 43.9% |
| Leading Material of Construction | Stainless Steel |
| Material Share | 59.8% |
| Leading Capacity Segment | Medium Capacity |
| Capacity Share | 45.1% |
| Leading Operation Mode | Semi-Automatic Systems |
| Operation Mode Share | 39.8% |
| Leading Application | Chemical Processing |
| Application Share | 43.7% |
| Leading End Use Industry | Industrial Manufacturers |
| End Use Industry Share | 70.2% |
| Key Growth Regions | East Asia, North America, South Asia & Pacific |
| Key Companies | EKATO Group, GEA Group, Sulzer Chemtech, Myande Group, Veolia Water Technologies, SPX FLOW, RCM Thermal Kinetics, Tsukishima JFE Aqua Solution, Swenson Technology, Pfaudler Group |
| Segmentation by Type | Batch Crystallization Tanks, Continuous Crystallization Tanks, Specialized Crystallization Tanks |
| Segmentation by Material of Construction | Stainless Steel, Alloy-Based Tanks, Lined & Composite Tanks |
| Segmentation by Capacity | Small Capacity, Medium Capacity, Large Capacity |
| Segmentation by Operation Mode | Manual Systems, Semi-Automatic Systems, Fully Automatic Systems |
| Segmentation by Region | North America, Latin America, Western Europe, Eastern Europe, East Asia, South Asia-Pacific, and Middle East & Africa |
Source: Fact.MR analysis. Updated May 30, 2026
The precursor crystallization tanks market is projected to create an absolute dollar opportunity of USD 302.6 million between 2026 and 2036. Market growth is driven by increasing investments in lithium-ion battery precursor manufacturing, rising demand for high-purity crystallization systems in specialty chemical processing, and rapid expansion of EV battery supply chains globally. Growing adoption of automated and continuous crystallization technologies, along with rising deployment of large-capacity process tanks for cathode precursor production and advanced material processing, is further supporting market expansion worldwide.
Key Growth Drivers, Constraints, and Opportunities
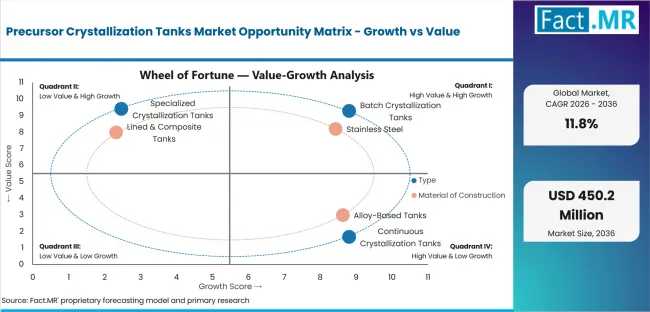
Precursor Crystallization Tanks Market Opportunity Matrix Growth Vs Value | Source: Fact.MR
Key Factors Driving Growth
- The rapid growth of lithium-ion battery production and EV supply chains is driving up demand for crystallization tanks for precursors worldwide.
- Growing investments in cathode precursor production plants and battery gigafactories are enabling the large-scale continuous crystallization systems deployment.
- A growing need for high-purity precursor materials with well-defined particle morphology is leading to increased utilization of advanced crystallization and process-control techniques.
| Growth Driver | Demand Impact | Time Horizon | Key Impact Area | Fact.MR Insight |
|---|---|---|---|---|
| Rising global investments in lithium-ion battery manufacturing | High | Short–Mid Term | Demand for precursor crystallization systems & large-capacity process tanks | Expansion of EV battery gigafactories and cathode precursor production facilities is significantly driving demand for advanced precursor crystallization tanks globally. |
| Increasing adoption of continuous crystallization technologies | High | Mid–Long Term | High-throughput industrial processing & operational efficiency | Manufacturers are increasingly shifting toward continuous crystallization systems to improve yield rates, process consistency, automation efficiency, and large-scale production capability. |
| Growing requirement for high-purity cathode precursor materials | Medium-High | Mid–Long Term | Precision crystallization & particle morphology control | Rising performance requirements for lithium-ion batteries are accelerating adoption of highly controlled crystallization systems capable of delivering consistent particle size and precursor purity. |
| Expansion of industrial automation and smart manufacturing systems | Medium-High | Mid–Long Term | SCADA integration & process optimization | Increasing deployment of automated monitoring, PLC controls, and AI-assisted process management is improving operational efficiency and supporting modernization of crystallization infrastructure. |
| Rising investments in battery recycling and advanced material processing | Medium-High | Long Term | Sustainable precursor processing & secondary material recovery | Growing focus on battery recycling and circular supply chain development is creating long-term opportunities for precursor crystallization equipment in lithium recovery and advanced chemical processing applications. |
Source: Fact.MR analysis. Updated May 30, 2026
Key Market Constraints
- The large upfront capital costs for automation and large-capacity crystallizer systems could also hinder adoption for small and mid-size producers.
- Multi-parameter process control, which includes pH stability, control of supersaturation, temperature, and optimization of particle growth, that is required during this process represents a challenge for operations.
- Corrosive precursor chemistries and harsh industrial environments result in increased maintenance and materials of construction concerns.
Key Opportunity Areas
- Increasing investments in lithium refining, battery recycling and cathode active material production are driving long term demand for crystallization equipment suppliers.
- Growing penetration of continuous crystallization technology and process optimization with the assistance of AI is enabling advanced automation solution providers.
- An increased emphasis on energy efficient and low maintenance crystallization systems is driving new developments in the areas of heat recovery, mixing efficiency and process integration.
Segment-wise Analysis of the Precursor Crystallization Tanks Market
- Batch crystallization tanks account for 43.9% share of the type segment in 2026, driven by their operational flexibility, cost efficiency, and extensive usage across specialty chemical processing, lithium precursor manufacturing, and controlled industrial crystallization applications.
- Stainless steel accounts for 59.8% share of the material of construction segment in 2026, supported by strong corrosion resistance, durability, cost-effectiveness, and broad adoption in battery precursor and chemical processing facilities globally.
- Medium capacity tanks represent 45.1% share of the capacity segment in 2026, owing to their balanced production capability, operational flexibility, and widespread deployment across mid-scale industrial precursor manufacturing plants.
The precursor crystallization tanks market is segmented by type, material of construction, capacity, operation mode, application, end use industry, and region.
Which Type Segment Topped the Precursor Crystallization Tanks Market?
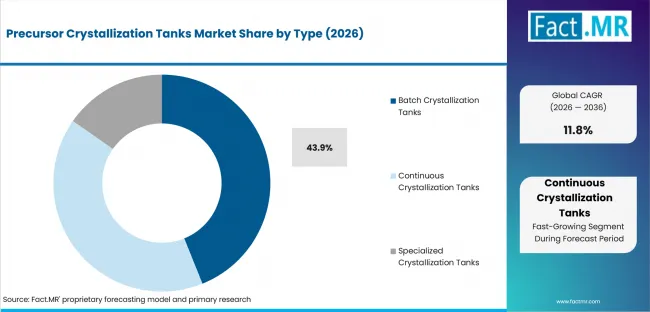
Precursor Crystallization Tanks Market Analysis By Type | Source: Fact.MR
Batch Crystallization Tanks are projected to account for 43.9% of the largest share by 2026 in the Precursor Crystallization Tanks Market. This leadership is driven by their operational flexibility, lower implementation cost, suitability for controlled crystallization processes, and extensive usage across specialty chemical manufacturing and lithium-ion battery precursor production facilities.
Which Material of Construction Segment Accounts for the Highest Share in the Market?
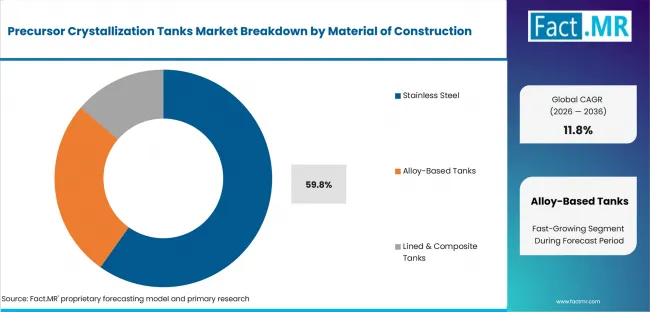
Precursor Crystallization Tanks Market Analysis By Material Of Construction | Source: Fact.MR
Stainless Steel is expected to hold the largest share of 59.8% in the material of construction segment in 2026. This dominance is attributed to strong corrosion resistance, durability, cost-effectiveness, easy maintenance, and broad compatibility with industrial precursor processing operations. Stainless steel tanks are extensively used in battery precursor manufacturing and chemical processing facilities because they provide reliable long-term operational performance in demanding industrial environments.
Which Capacity Segment Leads the Market?
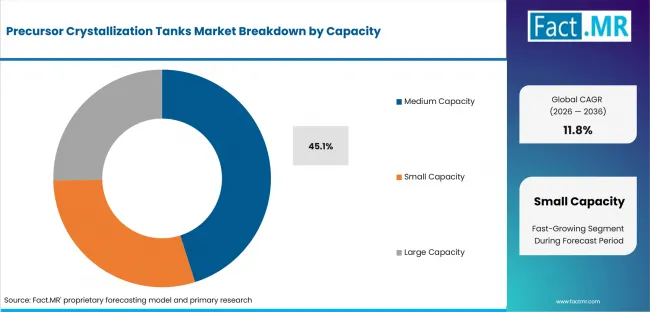
Precursor Crystallization Tanks Market Analysis By Capacity | Source: Fact.MR
Medium Capacity Tanks are anticipated to hold the highest market share, accounting for 45.1% in 2026, owing to their balanced production capability, operational flexibility, and suitability for mid-scale industrial crystallization applications. Increasing deployment in specialty chemical plants and lithium precursor production facilities is supporting segment growth. These systems provide optimized throughput while maintaining lower operational complexity compared to large-capacity industrial installations.
Which Operation Mode Segment Holds the Largest Share in the Market?
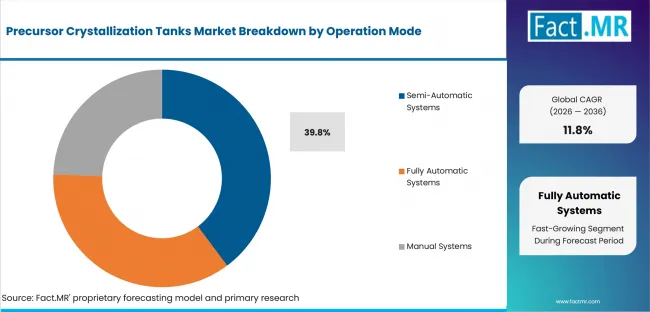
Precursor Crystallization Tanks Market Analysis By Operation Mode | Source: Fact.MR
Semi-Automatic Systems are projected to dominate the operation mode segment, capturing 39.8% share in 2026. This leadership is driven by increasing demand for cost-efficient automation, improved process consistency, reduced labor dependency, and better operational control in industrial crystallization processes. Semi-automatic systems provide an effective balance between manual flexibility and automated efficiency, making them widely preferred across mid-sized battery precursor and chemical processing plants.
Which Application Segment Holds the Largest Share in the Market?
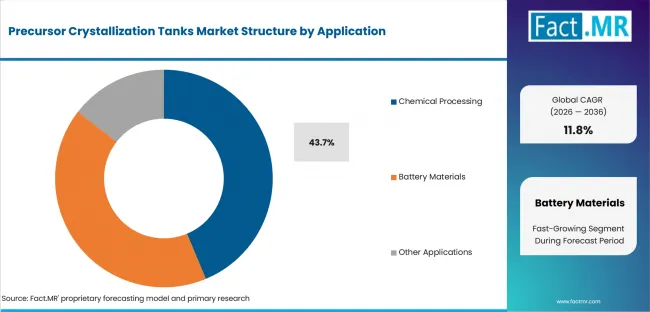
Precursor Crystallization Tanks Market Analysis By Application | Source: Fact.MR
Chemical Processing is projected to account for the largest share of 43.7% in 2026 in the application segment. The dominance of this segment is supported by extensive use of crystallization systems in specialty chemicals, industrial salts, advanced materials, and fine chemical manufacturing operations. Growing industrial demand for high-purity crystallization processes and increasing investments in chemical production infrastructure continue to support strong market expansion globally.
Which End Use Industry Segment Holds the Largest Share in the Market?
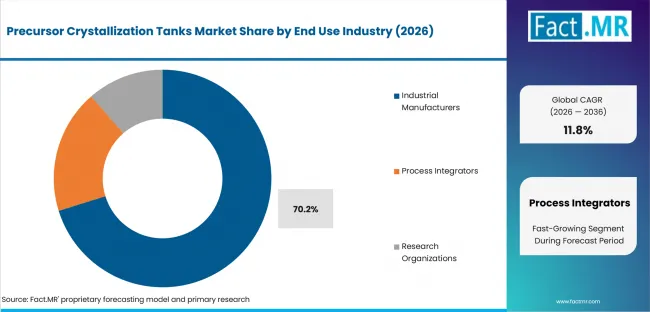
Precursor Crystallization Tanks Market Analysis By End Use Industry | Source: Fact.MR
Industrial Manufacturers are expected to lead the end use industry segment, accounting for 70.2% share in 2026. This dominance is driven by expanding investments in lithium-ion battery precursor manufacturing, large-scale chemical processing facilities, and industrial automation infrastructure. Increasing deployment of continuous and high-capacity crystallization systems in commercial production plants is further strengthening demand among industrial manufacturers worldwide.
Regional Outlook Across Key Markets
North America, Latin America, Western Europe, Eastern Europe, East Asia, South Asia & Pacific, Middle East & Africa are the major geographies considered in this report. This section is a comprehensive examination spectrum of the expansion in lithium-ion battery precursor production, the adoption of the industrial crystallization equipment, the growth of the EV battery supply chain, the specialty chemical processing infrastructure, the penetration of the automation to the industrial processing systems, the demand of continuous crystallization solutions, the investments in cathode material production plants and the escalating utilization of high-purity precursor processing vessels in the worldwide battery production and advanced chemical processing industry.
.webp "Top Country Growth Comparison Precursor Crystallization Tanks Market Cagr (2026 2036)")
Top Country Growth Comparison Precursor Crystallization Tanks Market Cagr (2026 2036) | Source: Fact.MR
CAGR Table
| Country | CAGR (%) |
|---|---|
| China | 12.7% |
| South Korea | 10.1% |
| Japan | 13.0% |
| United States | 11.6% |
| Germany | 9.1% |
| India | 13.8% |
| Canada | 13.4% |
Source: Fact.MR analysis. Updated May 30, 2026
Source: Fact.MR (FMR) analysis, based on proprietary forecasting model and primary research.
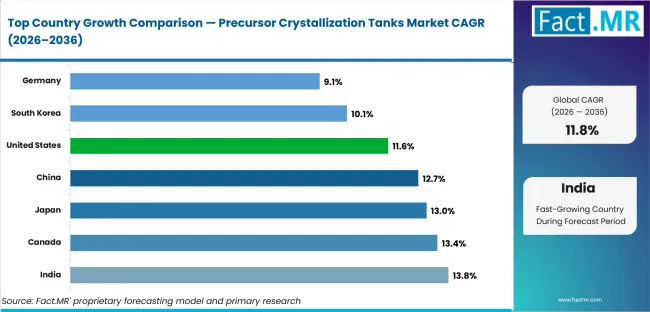
Precursor Crystallization Tanks Market Cagr Analysis By Country | Source: Fact.MR
North America Precursor Crystallization Tanks Market
North America is becoming a key growth region in the precursor crystallization tanks market with new investments in lithium-ion battery manufacturing, the expansion of EV supply chains, and the implementation of automated industrial crystallization systems. The battery precursor production infrastructure, sophisticated chemical processing and industrial automation in the region are rapidly developing. Key players are expanding their regional footprints with high-efficiency crystallization systems, smart process-control solutions and industrial processing solutions for large capacities
- U.S.: Demand for precursor crystallization tanks in the U.S. is projected to rise at 11.6% CAGR through 2036. Growth is driven by increasing battery gigafactory investments, expansion of cathode precursor production, and rising deployment of automated crystallization technologies.
- Canada: Demand for precursor crystallization tanks in Canada is projected to grow at 13.4% CAGR through 2036, supported by increasing investments in critical minerals processing, battery material manufacturing, and advanced industrial crystallization infrastructure.
Europe Precursor Crystallization Tanks Market
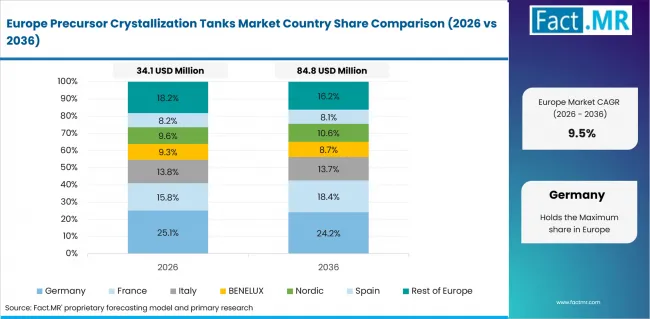
Precursor Crystallization Tanks Market Europe Country Market Share Analysis, 2026 & 2036 | Source: Fact.MR
The European market is a high-technology market for precursor crystallization tanks due to rising investments in battery material processing, industrial automation and specialty chemical production. The emphasis on localized EV battery supply chains and high-purity precursor production is enabling region-wide adoption of cutting-edge crystallization technologies. Manufacturers of industrial equipment are making growing investments in energy-efficient crystallization technologies, corrosion resistant materials and process control systems.
- Germany: Demand for precursor crystallization tanks in Germany is projected to rise steadily through 2036, driven by expansion of battery precursor manufacturing facilities, industrial automation adoption, and growing specialty chemical processing investments.
East Asia Precursor Crystallization Tanks Market
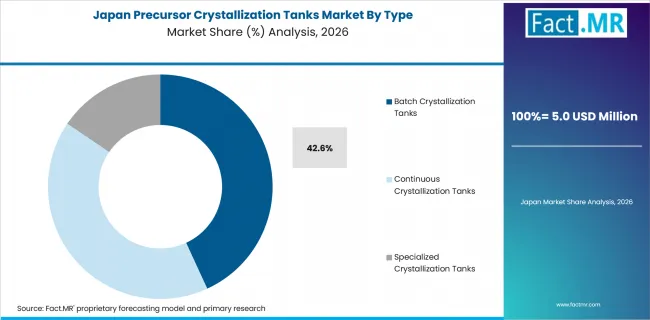
Precursor Crystallization Tanks Market Japan Market Share Analysis By Type | Source: Fact.MR
The Precursor Crystallization Tanks Market is anticipated to hold a dominant position in the East Asia region on account of high production of lithium-ion battery precursors, large capacity of cathode material production and powerful infrastructure of industrial chemical processing. Regional producer is evolving their focus towards continuous crystallization systems, the integration of smart automation and high throughput production technologies of precursors.
- China: Demand for precursor crystallization tanks in China is projected to rise at 12.7% CAGR through 2036, driven by expanding EV battery production capacity, increasing lithium precursor manufacturing, and large-scale industrial automation investments.
- Japan: Demand for precursor crystallization tanks in Japan is expected to grow at 13.0% CAGR through 2036 due to increasing investments in high-purity battery materials, advanced crystallization technologies, and precision chemical manufacturing systems.
- South Korea: Demand for precursor crystallization tanks in South Korea is projected to rise at 10.1% CAGR through 2036, supported by strong battery material manufacturing expansion, rising automation adoption, and increasing cathode precursor production capacity.
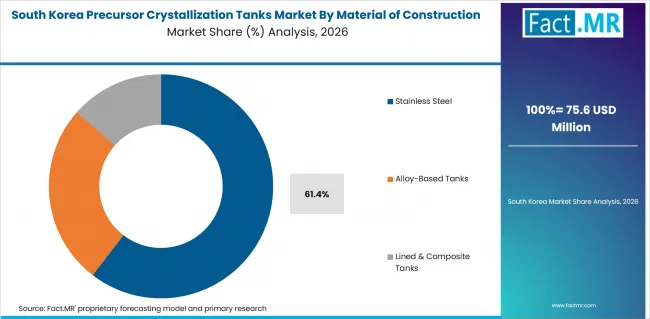
Precursor Crystallization Tanks Market South Korea Market Share Analysis By Material Of Construction | Source: Fact.MR
South Asia & Pacific Precursor Crystallization Tanks Market
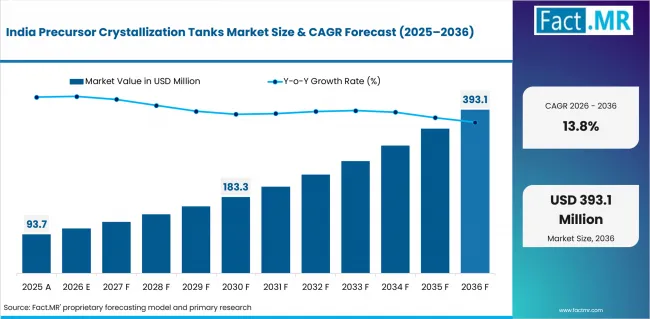
Precursor Crystallization Tanks Market Country Value Analysis | Source: Fact.MR
South Asia & Pacific is anticipated to be one of the fastest-growing regions in the precursor crystallization tanks market owing to rapid industrialization, increasing battery manufacturing investments, and expanding specialty chemical production infrastructure. Regional manufacturers are increasingly deploying medium- and large-capacity crystallization systems to support growing precursor processing requirements.
- India: Demand for precursor crystallization tanks in India is projected to rise at 13.8% CAGR through 2036, driven by expanding lithium-ion battery investments, rising industrial automation adoption, and increasing chemical processing infrastructure development.
Latin America Precursor Crystallization Tanks Market
The precursor crystallization tanks market is lucrative due to the steady growth in the demand for growth in the precursor crystallization tanks industry in Latin America; the growth can be attributed to rising investments in refining of lithium, specialty chemicals, and industrial processes modernization.
- Brazil: Demand for precursor crystallization tanks in Brazil is projected to rise steadily through 2036, supported by increasing industrial chemical processing activities, battery material investments, and growing adoption of industrial crystallization technologies.
The Fact.MR report analyzes market trends, industrial automation adoption, battery precursor manufacturing expansion, competitive benchmarking, process equipment innovation, and long-term growth opportunities across individual countries in North America, Latin America, Europe, East Asia, South Asia & Pacific, and Middle East & Africa. Readers gain detailed insights into industrial crystallization infrastructure development, battery material production trends, continuous crystallization technology adoption, and future opportunities across global advanced material and chemical processing industries.
Competitive Benchmarking and Company Positioning
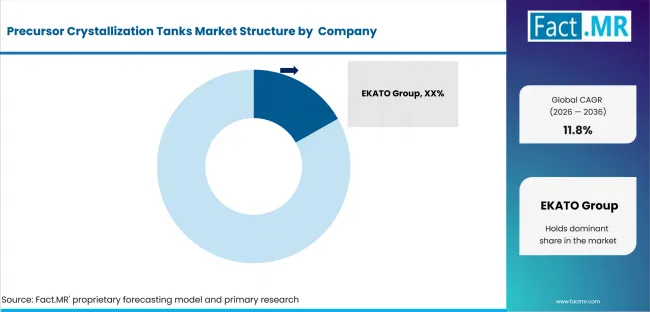
Precursor Crystallization Tanks Market Analysis By Company | Source: Fact.MR
Leading Companies Shaping the Precursor Crystallization Tanks Market
The precursor crystallization tanks market is moderately consolidated along with EKATO Group, GEA Group, Sulzer Chemtech, Myande Group, Veolia Water Technologies, SPX FLOW, RCM Thermal Kinetics, Tsukishima JFE Aqua Solution, Swenson Technology, and Pfaudler Group. Factors of competition include process efficiency, crystallization yield performance, automation level, corrosion resistance of tank materials, adequate size for mass production, and adoption of advanced process control techniques. Top players are further enhancing their dominance in the market through adoption of continuous crystallization systems, smart automation platforms, energy-efficient process design and solutions for high-purity precursor processing.
There is a growing focus among manufacturers to develop high-performance crystallization equipment that can be utilized for the production of lithium-ion battery precursors, specialty chemical processing, and material synthesis at industrial-scale. Regional players and new entrants on the other hand are contesting based on tank manufacturing efficiencies, customized reactor solutions, localized engineering support, and diverse automation integration solutions for growing EV production and industrial processing markets worldwide.
Recent Industry Developments
- Aquatech – Acquisition of FTS H2O to Advance Lithium Processing and Brine Crystallization Technologies (May 2026)
- Aquatech acquired FTS H2O to strengthen its capabilities in energy-efficient lithium processing, zero liquid discharge (ZLD), and brine mining technologies. The acquisition enhances Aquatech’s industrial crystallization and mineral recovery portfolio, supporting growing global demand for lithium precursor processing and battery material production infrastructure.
- EKATO – Continuous Crystallization in a Draft Tube Baffled Crystallizer Initiative (March 2025)
- EKATO highlighted its Draft Tube Baffled (DTB) continuous crystallization technology designed to improve crystal size distribution, process stability, and industrial-scale crystallization efficiency. The initiative strengthens EKATO’s position in advanced precursor crystallization technologies used in battery material and specialty chemical manufacturing applications.
- Sulzer – BioFlux™ Technology Deployment for Sustainable Fuel Processing Plant (June 2025)
- Sulzer announced deployment of its BioFlux™ processing technology for SEDC Energy’s sustainable aviation fuel plant in Malaysia. Although focused on sustainable fuel production, the development reinforces Sulzer’s advanced industrial process engineering and separation technology capabilities relevant to crystallization and chemical processing industries.
- GMM Pfaudler – FY26 Industrial Process Equipment Expansion and Performance Update (May 2026)
- GMM Pfaudler reported steady FY26 performance supported by continued investments in corrosion-resistant process equipment, engineered systems, and industrial processing infrastructure. The company continues strengthening its presence in chemical processing and industrial reactor equipment markets, including crystallization-related applications.
- Rock Tech Lithium – Partnership with GEA for Lithium Converter Equipment in Germany (March 2025)
- Rock Tech Lithium partnered with GEA Group for deployment of crystallization and process technologies at its Guben lithium converter project in Germany. The collaboration supports battery-grade lithium hydroxide production and strengthens industrial crystallization infrastructure for the European EV battery supply chain.
Leading Companies Shaping the Precursor Crystallization Tanks Market
- EKATO Group
- GEA Group
- Sulzer Chemtech
- Myande Group
- RCM Thermal Kinetics
- Chem Process System
- GPI Tanks
- Pfaudler Group
- Pierre Guerin
Sources and Research References
- [1] Aquatech, “Aquatech Acquires FTS H2O to Advance Energy-Efficient Lithium Processing, Zero Liquid Discharge, and Brine Mining”, May 2026
- [2] EKATO, “Continuous Crystallization in a Draft Tube Baffled Crystallizer”, March 2025
- [3] Sulzer, “Sulzer to provide BioFlux™ technology for SEDC Energy sustainable aviation fuel plant in Malaysia”, June 2025
- [4] GMM Pfaudler, “GMM Pfaudler posts steady FY26 performance”, May 2026
- [5] Rock Tech Lithium, “Rock Tech Lithium Partners with GEA for Key Equipment in Guben Lithium Converter”, March 2025
Precursor Crystallization Tanks Market Definition
The precursor crystallization tank market is a segment of the process industry based on equipment, equipment that enables the controlled crystallization of precursor substances or raw materials used in the manufacturing of batteries and specialty chemicals and in the processing of advanced materials. These tanks facilitate particle generation, purity management and continuous or batch crystallization under the influence of temperature, pressure and stirring. Precursor crystallization tanks find their application in the production of cathode precursors for lithium-ion batteries, chemical processing and large-scale materials synthesis.
Precursor Crystallization Tanks Market Inclusions
The report on the precursor crystallization tanks market presents a detailed assessment of the global and regional market for the 2026-2036 prediction period. It provides detailed information on the segment by type, construction material, capacity, mode of operation, application, end user industry, and region, and analyzes technology adoption trends, industry competition, industrial automation, and battery precursor manufacturing developments. The report also identifies new trends such as continuous crystallization, intelligent process automation, corrosion-resistant tank materials, high-capacity industrial processing systems and growing infrastructure for lithium-ion battery supply chain worldwide.
Precursor Crystallization Tanks Market Exclusions
This study addresses industrial precursor crystallization tanks for lithium-ion battery precursor production, specialty chemical processing, and advanced materials application. However, general industrial storage tanks, non-crystallization chemical reactors, pharmaceutical laboratory crystallizers, or other mixing and agitation equipment without the ability to crystallize precursors are not within the scope of this study. Also outside the scope of the report are equipment used for downstream cell manufacture in batteries, mining extraction equipment, systems that use wastewater-only crystallization, and small laboratory scale vessels except where these are designed for industrial precursor crystallization and controlled particle formation.
Precursor Crystallization Tanks Market Research Methodology
- Primary Research
- Fact.MR has considered a top-down and bottom-up approach to the analysis of the precursor crystallization tanks market size from a global perspective to estimate and validate the size of the market. Comprehensive primary interviews were conducted for the crystallization equipment market with manufacturers of crystallization equipment, industrial reactor suppliers, battery precursor manufacturers, specialty chemical producers, EPC contractors, automation suppliers, and industry consultants to confirm market trends, pricing dynamics, technology adoption, automation demand, production capacity augmentation, and future demand outlook, across battery materials as well as industrial chemicals processing.
- Desk Research
- This report includes data from company annual and investor reports, and various publications related to industrial equipment, battery manufacturing, crystallization technology, chemical processing white papers, the automation industry, government industrial statistics, trade journals and energy transition reports. Other references are reviews of lithium-ion battery supply chains, specialty chemical manufacturing, industrial automation systems, process engineering technologies, advanced material processing infrastructure and global investments in EV battery precursor production and crystallization equipment installations.
- Market-Sizing and Forecasting
- Approach for Estimation the Fact.MR’s market estimation methodology considers the revenue generated by the manufacturers of the crystallization tanks, suppliers of industrial process equipment, and providers of automation solutions and analyzed through a bottom-up approach and further validated by a top-down approach of the global industrial crystallization equipment market at regional and application level. The projection includes battery precursor capacity development, industrial automation trends, chemical processing investments, as well as increasing adoption of continuous crystallization techniques worldwide.
- Data Validation and Update Cycle
- Market projections were validated through triangulation of primary interviews, company financial analysis, industrial equipment demand assessment, battery manufacturing investments, regional chemical processing trends, and historical growth patterns in industrial crystallization systems. Forecasts are periodically updated based on changes in EV battery production, lithium precursor investments, industrial automation adoption, raw material processing infrastructure, regulatory developments, and technological advancements in continuous and high-purity crystallization systems used across advanced material and specialty chemical manufacturing industries.
Segmentation
Scope of Analysis
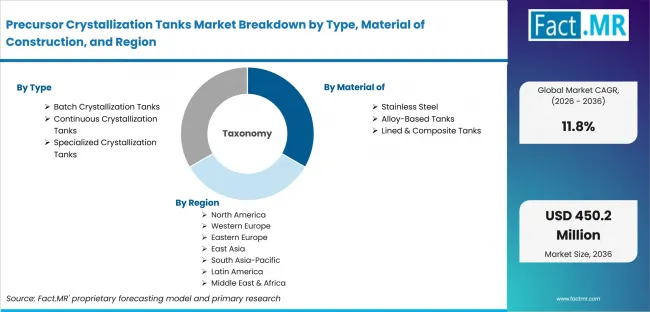
Precursor Crystallization Tanks Market Breakdown By Type, Material Of Construction, And Region | Source: Fact.MR
Parameter |
Details |
|---|---|
| Quantitative Units | USD 132.0 million (2025) to USD 450.2 million (2036), at a CAGR of 11.8% |
| Market Definition | The precursor crystallization tanks market covers industrial crystallization reactors, co-precipitation systems, and process tanks designed for controlled precursor particle formation, crystal growth, and high-purity material processing used in lithium-ion battery precursor manufacturing, specialty chemicals, and advanced material production industries. These systems include batch crystallization tanks, continuous crystallization systems, evaporative crystallizers, and automated process-control reactors integrated with mixing, temperature regulation, filtration, and drying systems for industrial-scale precursor processing applications. |
| Regions Covered | North America, Eastern Europe, Western Europe, East Asia, South Asia & Pacific, Latin America, Middle East & Africa |
| Countries Covered | USA, Canada, Germany, China, Japan, India, South Korea, Brazil, Indonesia, UK, France, Italy, Australia, UAE, South Africa, and 20+ countries |
| Key Companies | EKATO Group, GEA Group, Sulzer Chemtech, Myande Group, Veolia Water Technologies, SPX FLOW, RCM Thermal Kinetics, Tsukishima JFE Aqua Solution, Swenson Technology, Pfaudler Group |
| Forecast Period | 2026 to 2036 |
| Approach | Hybrid demand-side and top-down methodology based on lithium-ion battery manufacturing expansion, cathode precursor production capacity, industrial crystallization equipment demand, automation adoption trends, specialty chemical processing investments, continuous crystallization technology penetration, and EV supply chain expansion, validated through primary interviews with crystallization equipment manufacturers, battery material producers, EPC contractors, industrial automation providers, chemical processing companies, and industry experts across key global regions. |
Source: Fact.MR analysis. Updated May 30, 2026
Analysis by Type, Material of Construction, Capacity, Operation Mode, Application, End Use Industry, and Region
-
Precursor Crystallization Tanks Market by Type
- Batch Crystallization Tanks
- Standard Batch Tanks
- Vacuum Batch Tanks
- Cooling Batch Tanks
- Continuous Crystallization Tanks
- MSMPR Crystallizers
- DTB Crystallizers
- Fluidized Bed Crystallizers
- Specialized Crystallization Tanks
- Evaporative Crystallization Tanks
- Reactive Crystallization Tanks
- Forced Circulation Crystallizers
- Batch Crystallization Tanks
-
Precursor Crystallization Tanks Market by Material of Construction
- Stainless Steel
- SS 304
- SS 316/316L
- Duplex Stainless Steel
- Alloy-Based Tanks
- Hastelloy
- Titanium Alloy
- Nickel Alloy
- Lined & Composite Tanks
- Glass-Lined Tanks
- PTFE-Lined Tanks
- FRP/Composite Tanks
- Stainless Steel
-
Precursor Crystallization Tanks Market by Capacity
- Small Capacity
- Medium Capacity
- Large Capacity
-
Precursor Crystallization Tanks Market by Operation Mode
- Manual Systems
- Semi-Automatic Systems
- Fully Automatic Systems
-
Precursor Crystallization Tanks Market by Application
- Battery Materials
- Lithium-Ion Cathode Precursors
- Nickel/Cobalt/Manganese Sulfate Precursors
- LFP Precursors
- Chemical Processing
- Specialty Chemicals
- Industrial Salts
- Fine Chemicals
- Other Applications
- Pharmaceuticals
- Fertilizers & Agrochemicals
- Food & Beverage Ingredients
- Battery Materials
-
Precursor Crystallization Tanks Market by End Use Industry
- Industrial Manufacturers
- Battery Material Producers
- Chemical Manufacturers
- Metallurgical Companies
- Research Organizations
- R&D Laboratories
- Pilot Production Facilities
- Universities & Institutes
- Process Integrators
- EPC Companies
- Industrial Automation Providers
- Process Equipment Integrators
- Industrial Manufacturers
-
Precursor Crystallization Tanks Market by Region
- North America
- USA
- Canada
- Mexico
- Latin America
- Brazil
- Chile
- Rest of LATAM
- East Asia
- China
- Japan
- South Korea
- Taiwan
- South Asia & Pacific
- India
- Singapore
- Australia
- ASEAN
- Western Europe
- Germany
- France
- U.K.
- Italy
- Spain
- BENELUX
- Nordic
- Rest of Western Europe
- Eastern Europe
- Poland
- Hungary
- Czech Republic
- Balkan & Baltics
- Rest of Eastern Europe
- Middle East and Africa
- Kingdom of Saudi Arabia
- United Arab Emirates
- South Africa
- Rest of Middle East and Africa
- North America
Frequently Asked Questions
How large is the demand for Precursor Crystallization Tanks in the global market in 2025?
What will be the market size of the Precursor Crystallization Tanks Market by 2036?
What is the expected demand growth for the Precursor Crystallization Tanks Market between 2026 and 2036?
How significant is the growth outlook for India in this market?
Which company is identified as a leading player in the Precursor Crystallization Tanks Market?
Who worked on this report


Preview the report firsthand - request a free sample
Free SampleGet the brochure for pricing and purchase details
Download PDF