


- Base Value(2025): 1.8 Bn
- Forecast Value (2035): 2.7 Bn
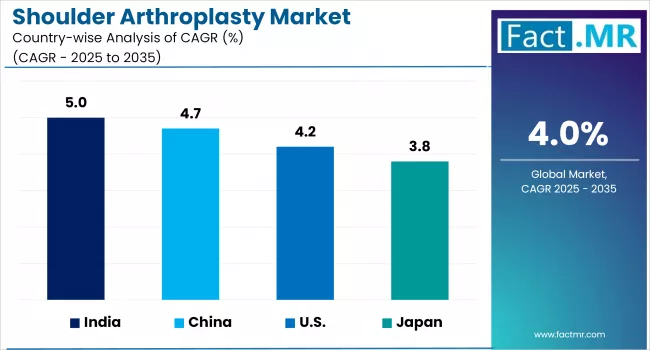
- CAGR (2035): 4.0%
Shoulder Arthroplasty Market Outlook (2025 to 2035)
The global shoulder arthroplasty market is projected to increase from USD 1.8 billion in 2025 to USD 2.7 billion by 2035, with a CAGR of 4.0%, driven by the increasing incidence of shoulder disorders, including shoulder arthritis. Their use makes them ideal for restoring shoulder joint functionality, reducing pain, and improving mobility in patients with degenerative, traumatic, or inflammatory shoulder conditions.
-2025-to-2035.webp)
What are the Drivers of Shoulder Arthroplasty Market?
The growth of the shoulder arthroplasty market is fueled by the rising prevalence of degenerative shoulder conditions among the aging global population. As life expectancy increases, age-related disorders such as osteoarthritis, rheumatoid arthritis, and rotator cuff arthropathy are becoming more common, driving the demand for surgical interventions like total and reverse shoulder replacements.
The growing geriatric demographic, particularly in countries such as the U.S., Japan, and Germany, constitutes a significant portion of the patient base opting for shoulder arthroplasty to regain mobility and enhance quality of life. The increasing number of shoulder injuries and musculoskeletal disorders resulting from sports activities, trauma, and physically demanding occupations is promoting the market growth.
The surge in sports-related injuries among youth and middle-aged adults, combined with rising awareness about surgical solutions, is expanding the patient pool. Moreover, improved access to diagnostic imaging technologies, such as MRI and CT scans, is facilitating early and accurate diagnosis of shoulder problems, leading to timely surgical treatments and better clinical outcomes.
Technological advancements in implant design and surgical procedures are significantly contributing to the growth of the shoulder arthroplasty market. Innovations such as reverse shoulder arthroplasty, 3D-printed custom implants, and minimally invasive or computer-assisted surgeries have enhanced surgical precision, shortened recovery times, and prolonged implant longevity. These improvements have made shoulder replacement procedures more reliable and accessible, improving both patient satisfaction and clinical success rates.
The market is benefiting from supportive healthcare policies and the growing shift toward outpatient procedures. In developed regions, favorable reimbursement policies and the rise of ambulatory surgical centers are reducing patient costs and increasing surgical volumes.
At the same time, emerging economies such as India, China, and Brazil are experiencing growth due to improvements in healthcare infrastructure, rising disposable income, and increasing awareness of orthopedic solutions. This combination of factors is positioning shoulder arthroplasty as a preferred treatment option, driving its global market expansion.
What are the Regional Trends of Shoulder Arthroplasty Market?
North America holds a significant market share in the global shoulder arthroplasty market. This leadership is driven by a high prevalence of osteoarthritis, well-established healthcare infrastructure, and strong reimbursement systems such as Medicare and private insurance.
The presence of major orthopedic device manufacturers and high adoption of advanced surgical technologies, such as computer assisted and minimally invasive techniques, further boosts procedural volumes in the region. The growing trend of outpatient surgeries and increasing awareness among the elderly population also contribute to North America's sustained market dominance.
In Europe, countries like Germany, the U.K., and France are witnessing steady growth due to rising aging populations and increasing orthopedic surgical rates. Moreover, the presence of well-trained orthopedic surgeons and strong collaboration between hospitals and medical device companies facilitate high-quality care across Western Europe.
Asia Pacific is the fastest-growing region in the shoulder arthroplasty market, driven by rapidly improving healthcare infrastructure, increasing medical tourism, and a rising middle-class population with growing healthcare awareness. Countries like India, China, Japan, and South Korea are seeing a surge in orthopedic procedures due to rising life expectancy, urbanization, and a growing burden of shoulder-related disorders.
In Middle East and Southeast Asia, the market is at a developing stage but shows growing promise. Countries such as Saudi Arabia and UAE are investing in healthcare modernization, orthopedic training, and public-private partnerships to enhance surgical capacities.
Although limited by cost constraints and access challenges, the rising burden of musculoskeletal disorders and government initiatives to improve orthopedic care are expected to drive gradual growth in these regions.
What are the Challenges and Restraining Factors of Shoulder Arthroplasty Market?
The high cost of shoulder replacement surgeries, especially in low- and middle-income countries, is hampering the growth of the shoulder arthroplasty market. The procedure involves expensive implants, preoperative imaging, surgical expertise, and postoperative rehabilitation, making it unaffordable for a significant segment of the population. In regions with limited health insurance coverage or underdeveloped healthcare systems, cost becomes a significant barrier to access, resulting in reduced overall procedure volumes.
The limited availability of skilled orthopedic surgeons, particularly in emerging and rural areas, is hindering the market growth. Shoulder arthroplasty is a complex procedure that requires specialized training and experience.
In many developing regions, a shortage of trained professionals and advanced surgical infrastructure results in delayed or suboptimal treatment. This challenge is compounded by a lack of access to advanced technologies, such as computer-assisted navigation, robotic surgery, and patient-specific implants, which are more commonly available in developed countries.
Postoperative complications and implant-related issues also pose significant concerns. Although modern implants have improved in durability and design, issues such as implant loosening, infection, nerve damage, and joint stiffness remain potential risks. These complications can lead to revision surgeries, which are more complex, costlier, and carry higher risks.
Regulatory hurdles and reimbursement limitations in certain countries can delay product approvals and restrict patient access to newer technologies. Lengthy regulatory approval processes for new implants and inconsistent reimbursement policies may hinder innovation and market entry for new players. These barriers can particularly impact smaller manufacturers, limiting competition that could otherwise help reduce costs and improve access to quality care.
Country-Wise Outlook
U.S. Shoulder Arthroplasty Market sees Growth Driven Well-established Healthcare Infrastructure
A combination of demographic, technological, and healthcare infrastructure factors drives the growth of the U.S. shoulder arthroplasty market. The U.S. has a well-established orthopedic care network, with widespread availability of advanced surgical procedures, including reverse total shoulder arthroplasty, which has seen a rapid increase in adoption due to its effectiveness in complex cases.
Technological innovations are accelerating market growth in the U.S. The adoption of robotic-assisted surgeries, 3D-printed implants, and navigation systems is improving surgical accuracy and outcomes, which in turn is boosting patient confidence and acceptance. The increasing preference for outpatient surgeries and procedures in ambulatory surgical centers (ASCs) is also making shoulder arthroplasty more accessible and cost-efficient.
The presence of favorable reimbursement policies, supported by Medicare and private insurance providers, is driving market growth. Moreover, the U.S. is home to several leading orthopedic device manufacturers, including Zimmer Biomet, Stryker, and DePuy Synthes, which ensures early access to cutting-edge technologies and strong distribution networks. Together, these factors position the U.S. as a dominant and fast-evolving market for shoulder arthroplasty.
-2025-to-2035.webp)
China witnesses Rapid Market Growth Backed by Fast Growing Population
China is emerging as one of the fastest-growing markets for shoulder arthroplasty, driven by a rapidly aging population, improved healthcare infrastructure, and increasing awareness of orthopedic surgical solutions. The increasing prevalence of age-related joint conditions such as osteoarthritis and rotator cuff injuries is creating a substantial demand for joint replacement surgeries, including shoulder arthroplasty.
The urbanization of healthcare facilities and expansion of orthopedic departments in tertiary hospitals have improved access to advanced surgical care across major Chinese cities. China’s government has increased investments in healthcare modernization through initiatives such as the Healthy China 2030 plan, which promotes access to specialized care and modern medical technologies. These developments have made shoulder arthroplasty more accessible to the growing middle-class population, who are more willing and financially able to seek high-quality surgical solutions.
Furthermore, there is a growing presence of international and domestic orthopedic implant manufacturers in China, contributing to greater availability of shoulder replacement devices at competitive prices. Local companies are also investing in research and development to produce cost-effective, high-quality implants that cater to the domestic market. This competitive landscape is helping lower the cost of procedures and expand the overall market base.
Growing Aging Population to Drive the Market Growth in Japan
The growing aging population in Japan drives the growth of the shoulder arthroplasty market, which is one of the oldest in the world. With over 28% of Japan’s population aged 65 or older, the burden of degenerative joint diseases such as osteoarthritis, rotator cuff arthropathy, and rheumatoid arthritis is high, fueling demand for shoulder replacement procedures.
The country benefits from a well-developed healthcare system, equipped with advanced medical infrastructure and skilled orthopedic surgeons. Japanese hospitals have widely adopted modern surgical techniques, including reverse shoulder arthroplasty and minimally invasive procedures, which improve outcomes and reduce recovery time. This strong clinical foundation supports consistent procedural volumes and the adoption of new technologies.
Moreover, Japan has a universal health insurance system that covers most of the costs associated with shoulder arthroplasty, making the procedure financially accessible to a large portion of the population. The reimbursement coverage also includes advanced implants and technologies, which encourages patients to undergo surgery rather than delay treatment due to cost concerns.
Category-wise Analysis
Total shoulder arthroplasty (TSA) to Exhibit Leading by Procedure
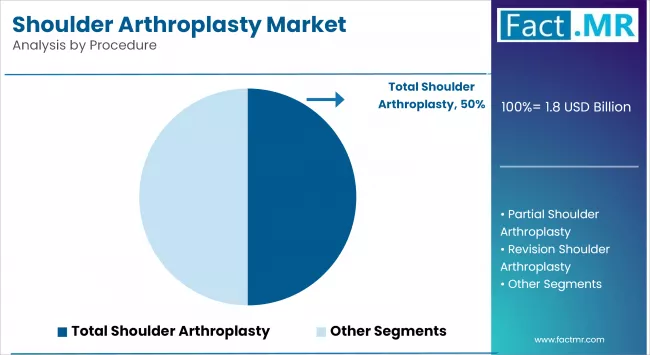
The total shoulder arthroplasty (TSA) segment holds the largest share in the shoulder arthroplasty market. The growth of the market is driven by favorable clinical outcomes, an increasing elderly population with degenerative joint diseases, and wide acceptance by orthopedic surgeons. Moreover, reimbursement coverage in major healthcare markets such as the U.S., Japan, and Europe supports its high adoption rate.
The revision shoulder arthroplasty segment is emerging as the fastest-growing procedure type due to a rising number of primary arthroplasty failures, implant wear, infections, and complications such as loosening or dislocation. As the volume of total and partial shoulder replacements increases globally, the number of revision cases is also expected to rise, especially in aging patients with longer implant life cycles. Advances in revision implant designs, surgical techniques, and diagnostic tools are improving success rates and patient outcomes, further supporting market expansion. Furthermore, increased surgeon expertise in managing complex revision cases is contributing to the segment growth.
Resurfacing to Exhibit Leading by Device
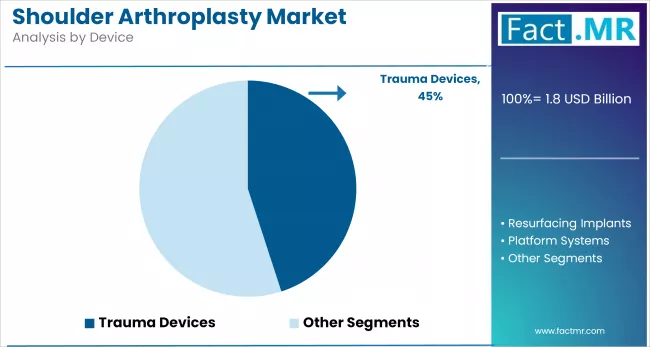
The resurfacing implants segment holds the largest share of the market. The segment growth is driven by its widespread use in partial shoulder arthroplasty and early-stage joint degeneration. These implants are preferred in cases where bone preservation is critical, such as in younger or more active patients.
The advantages of shoulder resurfacing implants include less bone removal, reduced surgical time, and easier future revisions. Their high clinical success rate, combined with increased surgeon familiarity and favorable patient outcomes, has driven their strong market position. Moreover, the growing prevalence of shoulder arthritis and demand for less invasive treatment options are further fueling the demand for resurfacing implants.
Arthritis to Exhibit Leading by Indication
Arthritis holds the largest market share in the self-administered medication segment due to the high global prevalence of osteoarthritis and rheumatoid arthritis. Chronic joint pain and inflammation require long-term, consistent treatment, making self-injection pens and transdermal patches ideal for patient-controlled management. Increased awareness, aging populations, and the need for regular dosing contribute to sustained demand.
The Hill-Sachs defect segment is projected to grow at the fastest rate, driven by an increase in cases of shoulder dislocations among athletes and aging individuals. Minimally invasive and targeted drug delivery options, especially in pain relief and inflammation management, are being increasingly adopted for home use. As sports injuries and orthopedic conditions rise, demand for self-administered therapies tailored for post-dislocation recovery is accelerating.
Hospitals to Exhibit Leading by End-User
The hospitals segment holds the largest market share among end users and continues to dominate the shoulder arthroplasty market. This dominance is driven by hospital access to advanced surgical infrastructure and the presence of experienced orthopedic surgeons. Furthermore, the availability of intensive care units (ICUs), diagnostic imaging, and multidisciplinary teams in hospitals ensures a high standard of care, making them the preferred choice for both patients and surgeons.
The outpatient surgical centers segment is emerging as the fastest-growing end user in the shoulder arthroplasty market. These centers offer a cost-effective, efficient, and patient-friendly alternative to hospital-based surgeries. Moreover, the increasing number of accredited ambulatory surgical centers, particularly in North America and parts of Europe, is contributing to the rapid expansion of this segment.
Competitive Analysis
The shoulder arthroplasty market is becoming increasingly competitive, with a few leading players accounting for a significant share of global revenue. Companies have established strong market positions through comprehensive product portfolios, advanced implant technologies, and well-established relationships with surgeons. Their global distribution networks and regulatory expertise allow them to swiftly introduce innovative solutions and expand into both mature and emerging markets.
Innovation remains a key competitive factor in this market. Leading players invest heavily in research and development to launch advanced implant designs, including reverse shoulder systems, stemless implants, and customized 3D-printed prosthetics. These products offer enhanced joint stability, longer implant life, and improved clinical outcomes, particularly in complex cases like rotator cuff arthropathy or revision surgeries.
Companies are also integrating robotic-assisted surgery and navigation systems to enhance surgical precision, minimize complications, and boost surgeon confidence, thereby further strengthening their competitive edge.
Strategic acquisitions and partnerships play a critical role in shaping the market. For example, Stryker’s acquisition of Wright Medical significantly enhanced its upper extremity portfolio and competitive positioning in shoulder arthroplasty.
Key players in the shoulder arthroplasty industry include ConMed Corporation, DePuy Synthes, Integra Lifesciences Corporation, Limacorporate S.p.A., Smith & Nephew PLC, Wright Medical Group NV, Zimmer Biomet Holdings, Inc., and other notable companies.
Recent Development
- In January 2025, Group FH ORTHO, a designer, manufacturer, and distributor of orthopedic implants and instruments, launched its JARVIS round baseplate for reverse shoulder arthroplasty in the United States. This follows the receipt of FDA clearance for the device in November 2024.
- In February 2024, Smith+Nephew launched its AETOS Shoulder System for both anatomic and reverse total shoulder replacements in the US market. The AETOS system had previously received 510(k) clearance from the US Food and Drug Administration (FDA) in June 2023.
Segmentation of Shoulder Arthroplasty Market
-
By Procedure :
- Partial
- Total
- Revision
-
By Device :
- Resurfacing Implants
- Trauma Devices
- Platform Systems
-
By Indication :
- Arthritis
- Fracture/Dislocation
- Rotator Cuff Tear Arthropathy
- Hill Sachs Defect
-
By End-User :
- Hospitals
- Clinics
- Outpatient Surgical Centers
-
By Region :
- North America
- Latin America
- Western Europe
- Eastern Europe
- East Asia
- South Asia & Pacific
- Middle East & Africa
- Frequently Asked Questions -
What is the Global Shoulder Arthroplasty Market size in 2025?
The shoulder arthroplasty market is valued at USD 1.8 billion in 2025.
Who are the Major Players Operating in the Shoulder Arthroplasty Market?
Prominent players in the market include ConMed Corporation, DePuy Synthes, Integra Lifesciences Corporation, Limacorporate S.p.A., and Smith & Nephew PLC.
What is the Estimated Valuation of the Shoulder Arthroplasty Market by 2035?
The market is expected to reach a valuation of USD 2.7 billion by 2035.
What Value CAGR did the Shoulder Arthroplasty Market Exhibit over the Last Five Years?
The historic growth rate of the shoulder arthroplasty market was 3.1% from 2020-2024.