- Market Value (2025): USD 1.1 Bn
- Estimated Value (2026): USD 1.3 Bn
- Forecast Value (2036): USD 6.7 Bn
- CAGR (2026-2036): 18.0%
What is the Smart Assortment Platforms Market forecast to be worth by 2036?
USD 1.3 billion in 2026 to USD 6.7 billion by 2036 at an 18.0% CAGR.
- The Smart Assortment Platforms Market reached USD 1.1 billion in 2025.
- Demand is projected to increase from USD 1.3 billion in 2026 to USD 6.7 billion by 2036.
- The market is forecast to record an 18.0% CAGR from 2026 to 2036 while retail planners move assortments closer to live demand.
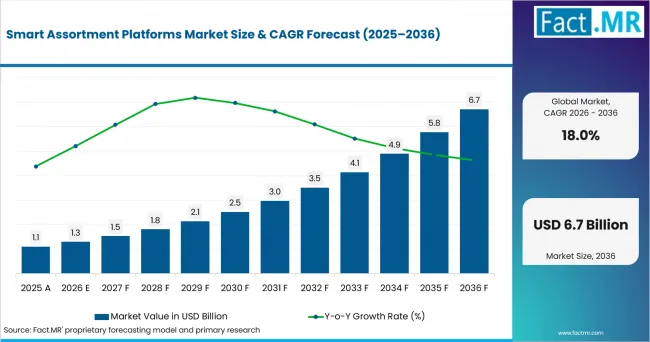
Smart Assortment Platforms Market Value Analysis | Source: Fact.MR
What are the defining numbers behind Smart Assortment Platforms Market growth?
USD 5.4 billion absolute opportunity by 2036, led by cloud deployment, software platforms and enterprise retail planning teams.
- Demand Drivers in the Market
- Category managers need item-level forecasts that link customer choice with store capacity, since assortment errors raise markdown exposure and reduce shelf productivity.
- Merchandise planners need cloud workflows that shorten range reviews and keep regional store clusters aligned with channel demand. Eurostat reported in December 2025 that 20.0% of EU enterprises with at least 10 employees used AI technologies in 2025.
- Retail operations teams need replenishment signals that reflect current product availability while reducing manual spreadsheet work across stores and online channels.
- Digital commerce teams need assortment logic that adapts to search, loyalty and basket data so online shelves stay relevant between planning cycles.
- Finance teams need clearer margin and inventory views when product ranges shift across price bands, categories and store formats.
- Key Segments Analyzed
- By Offering: Software platform at 42.0% share in 2026, supported by a single planning environment for range building and execution.
- By Deployment: Cloud at 52.0% share in 2026, owing to easier rollout across distributed store estates and regional planning teams.
- By Capability: Forecasting at 39.0% share in 2026 because demand prediction precedes allocation, store clustering and inventory decisions.
- By Customer: Large enterprise at 37.0% share in 2026, led by retailers with many categories, stores and digital channels to coordinate.
- Analyst Opinion at Fact.MR
- Shambhu Nath Jha, Principal Consultant at Fact.MR, states, “Assortment planning has become an operating problem beyond a seasonal buying exercise. Retailers are expected to favor platforms that connect item forecasts with real execution limits. Suppliers that combine planning science, clean integrations and planner-friendly workflows have a clearer path to account expansion.”
- Strategic Implications
- Platform vendors should connect assortment, allocation and replenishment logic so customers avoid rebuilding the same product hierarchy in separate tools.
- Retail CIOs should check POS, ERP and product-attribute readiness before migration, since weak input data slows platform value realization.
- Category teams should require explainable recommendations, particularly where an algorithm removes slow-moving items or shifts space between brands.
- Implementation partners should build repeatable templates for fashion, grocery and specialty retail because each format uses different selling calendars.
Germany is projected to post a 20.6% CAGR through 2036, supported by enterprise cloud use and AI planning. South Korea is forecast to advance at 19.9% as online and mobile retail volumes expand. The USA is expected to record 19.1% through retail sales scale. The UK is anticipated to reach 18.6% while online spending stays high. Japan is estimated to reach 15.1% as retailers balance sales value with cautious spending.
How does the Smart Assortment Platforms Market break down by segment?
Cloud leads Deployment at 52.0%; Software platform leads Offering at 42.0%.
Which Offering dominates?
Software platform at 42.0% share in 2026.
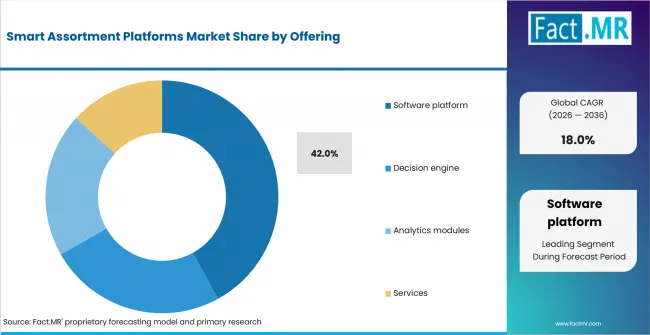
Smart Assortment Platforms Market Analysis By Offering | Source: Fact.MR
Software platforms lead because retail teams want assortment, forecast and execution decisions in one workspace. A platform model reduces handoffs between category review and replenishment while showing why a product is added or removed.
The value is clearest when sales patterns move faster than review calendars. Retailers compare scenarios before buying teams commit inventory, especially where decisions depend on customer and store-level data.
What leads the Deployment segment?
Cloud at 52.0% share in 2026.
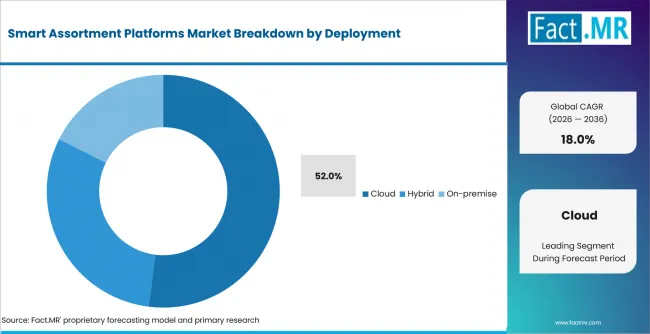
Smart Assortment Platforms Market Analysis By Deployment | Source: Fact.MR
Cloud deployment leads because retail planning teams are spread across headquarters, regional offices and stores. Centralized updates help teams compare scenarios without manual file chains and reduce separate planning infrastructure.
How does Capability shape demand?
Forecasting at 39.0% share in 2026.
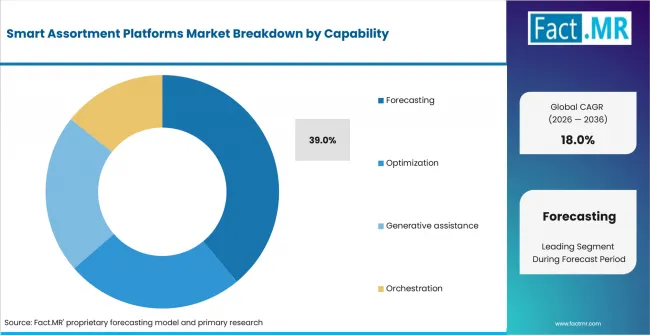
Smart Assortment Platforms Market Analysis By Capability | Source: Fact.MR
Forecasting leads because range decisions begin with expected item and store demand. A weak forecast can overstock low-potential stores or remove products that still attract loyal customers.
Smart assortment platforms use historical sales, product attributes and channel behavior to make those choices easier to explain. They connect with adjacent artificial intelligence supply chain systems where demand signals influence buying, allocation and replenishment workflows across a retailer.
What supports Large enterprise within Customer?
Large enterprise at 37.0% share in 2026.
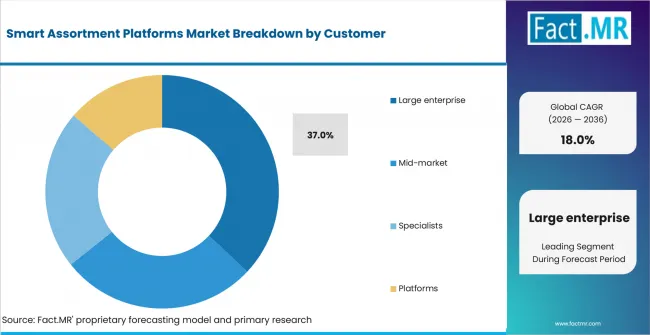
Smart Assortment Platforms Market Analysis By Customer | Source: Fact.MR
Large enterprises lead because they manage more stores, categories and supplier negotiations than smaller retail accounts. Their planning errors carry higher markdown exposure, and dedicated data teams help deployments move beyond pilots.
These customers usually ask for integration depth before expansion. Connections to ERP, POS and product systems keep assortment decisions aligned with inventory records.
What is accelerating Smart Assortment Platforms Market adoption, and what is holding it back?
Demand is expected to rise through retail data fragmentation and inventory exposure. Growth is constrained by integration cost, data quality and planning change management.
Drivers Impact Analysis
| DRIVER | (~) % IMPACT ON CAGR | GEOGRAPHIC RELEVANCE | IMPACT TIMELINE |
|---|---|---|---|
| SKU and store-cluster complexity | +2.0% | Global | Short term (<= 2 years) |
| Cloud planning migration | +1.5% | North America, Europe, East Asia | Medium term (2-4 years) |
| AI-assisted category review | +1.2% | Global | Medium term (2-4 years) |
| Omnichannel inventory pressure | +1.0% | North America, East Asia | Long term (>= 4 years) |
Source: Fact.MR analysis. Updated Aug 27, 2026
- SKU and store-cluster complexity: Retailers use assortment platforms to manage product variety across formats, regions and digital shelves without relying on disconnected spreadsheets.
- Cloud planning migration: Cloud systems let category teams update plans across countries and store clusters without waiting for local file consolidation.
- Omnichannel inventory pressure: Stores and online channels compete for the same stock pool, so assortment decisions need to reflect fulfillment limits and selling speed.
Opportunity Impact Analysis
| OPPORTUNITY | (~) % IMPACT ON CAGR | GEOGRAPHIC RELEVANCE | IMPACT TIMELINE |
|---|---|---|---|
| Generative assistance for planners | +1.1% | Global | Short term (<= 2 years) |
| Retail data harmonization services | +0.8% | Western Europe, North America | Medium term (2-4 years) |
| Mid-market cloud rollout | +0.7% | USA, UK, South Korea | Medium term (2-4 years) |
Source: Fact.MR analysis. Updated Aug 27, 2026
- Generative assistance for planners: Natural-language tools can reduce the time category teams spend finding assortment rules or rebuilding standard planning scenarios.
- Retail data harmonization services: Services revenue can expand where retailers need product attributes, store clusters and promotion data cleaned before rollout.
- Mid-market cloud rollout: Smaller retail chains can adopt lighter platform modules when the implementation path avoids heavy customization and long data projects.
Restraints Impact Analysis
| RESTRAINT | (~) % IMPACT ON CAGR | GEOGRAPHIC RELEVANCE | IMPACT TIMELINE |
|---|---|---|---|
| ERP and POS integration cost | -0.6% | Global | Short term (<= 2 years) |
| Weak product attribute data | -0.5% | Global | Medium term (2-4 years) |
| Planner adoption risk | -0.4% | Mature retail markets | Medium term (2-4 years) |
Source: Fact.MR analysis. Updated Aug 27, 2026
- ERP and POS integration cost: Retailers can delay broader rollout when product, price and inventory records conflict across systems.
- Weak product attribute data: Product size, color, brand and pack details need consistent naming before automated assortment recommendations are trusted.
- Planner adoption risk: Buyers and category managers may resist recommendations when the tool gives unclear tradeoff explanations.
Which countries are scaling the Smart Assortment Platforms Market through 2036?
The country comparison spans 5.5 percentage points between Germany and Japan across the forecast period.
- Germany remains 0.7 percentage point above South Korea as cloud services and enterprise AI use support retail planning modernization.
- South Korea remains 0.8 percentage point above the USA through high online-retail activity and mobile shopping intensity.
- The USA remains 0.5 percentage point above the UK as retail sales scale and e-commerce penetration create larger assortment data pools.
- The UK remains 3.5 percentage points above Japan as online spending retains a high share of retail sales.
- Japan closes the displayed range while large retail turnover and cautious household spending keep assortment tools focused on inventory discipline.
Comparable CAGRs create different entry conditions due to channel mix, cloud readiness and planning culture. Full report coverage includes North America, Latin America, Western Europe, Eastern Europe, East Asia, South Asia & Pacific, Middle East & Africa.
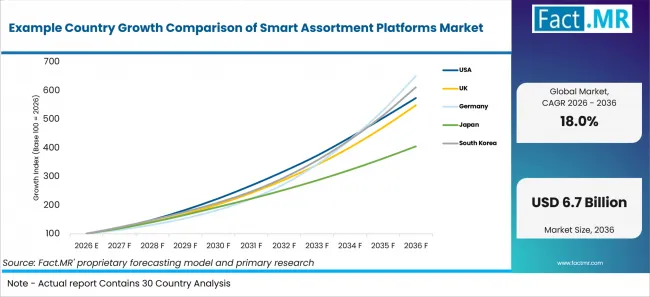
Example Country Growth Comparison Of Smart Assortment Platforms Market | Source: Fact.MR
| Country | CAGR (2026-2036) |
|---|---|
| Germany | 20.6% |
| South Korea | 19.9% |
| USA | 19.1% |
| UK | 18.6% |
| Japan | 15.1% |
Source: Fact.MR analysis. Updated Aug 27, 2026
What supports Germany adoption?
20.6% CAGR, supported by cloud retail systems and AI planning use.
German retailers are moving assortment work into cloud planning environments as store, product and channel records become easier to centralize. Destatis reported in November 2025 that 54% of German enterprises with at least 10 employees purchased cloud computing services. The ifo Institute reported in June 2026 that 54.5% of German companies used AI in May 2026. A 20.6% CAGR reflects that mix of cloud readiness and AI use, especially among chains trying to localize assortments while keeping manual review cycles tighter.
How is South Korea scaling demand?
19.9% CAGR, led by online retail scale and mobile shopping intensity.
South Korea’s retail channel mix gives assortment tools frequent transaction signals from mobile and online baskets. The Ministry of Data and Statistics reported in August 2026 that online shopping transaction value reached 24.6067 trillion won in June 2026, up 10.7% from June 2025. MOTIR reported in July 2026 that sales at 26 major retailers rose 9.5% year on year in June 2026. The 19.9% CAGR reflects retailer need to compare fast-moving digital ranges with store formats where category mix changes by banner.
What supports USA adoption?
19.1% CAGR, supported by large retail sales pools and e-commerce scale.
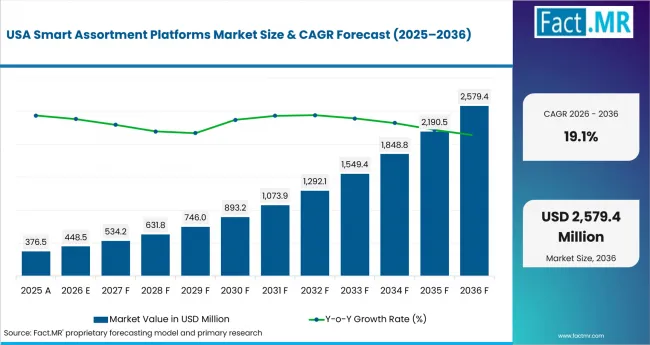
Smart Assortment Platforms Market Country Value Analysis | Source: Fact.MR
U.S. retailers have a large data base for assortment platforms because national chains manage broad store networks and online catalogs together. The U.S. Census Bureau reported in July 2026 that advance U.S. retail and food services sales were USD 768.6 billion in June 2026. In May 2026, the Bureau reported seasonally adjusted first-quarter 2026 retail e-commerce sales of USD 326.7 billion, accounting for 16.9% of total retail sales. A 19.1% CAGR reflects the scale of decisions tied to local item mix, demand forecasting and inventory allocation.
What supports the United Kingdom’s growth?
18.6% CAGR, backed by online spending and structured retail statistics.
The United Kingdom has a high online-retail share, so assortment planning must connect digital range breadth with store-level capacity. ONS reported in July 2026 that online spending values rose 11.7% in the second quarter of 2026 compared with the second quarter of 2025. In the same release, ONS initially estimated that the proportion of online sales rose from 28.9% in May to 29.4% in June 2026, the highest proportion since April 2021. The 18.6% CAGR reflects the need to test product range changes before category teams commit stock across web and stores.
How does Japan perform?
15.1% CAGR, led by retail scale and cautious inventory discipline.
Japan’s retail base is large enough for assortment platforms, yet deployment tends to emphasize inventory discipline and local proof. Japan’s Statistics Dashboard reported in August 2026 that nominal retail sales reached JPY 13,034 billion in June 2026. The Cabinet Office reported in July 2026 that the seasonally adjusted Consumer Confidence Index rose 1.1 points from the previous month to 34.9. The 15.1% CAGR reflects careful rollout where category teams need clear evidence before reducing or expanding store-level ranges.
Who leads the Smart Assortment Platforms Market?
RELEX Solutions operates through its unified retail planning and merchandising platform, including category-management capabilities. In February 2025, RELEX introduced RELEX Space for Category Management, which integrates assortment and space planning and supports automated planogram updates. Blue Yonder provides assortment planning alongside allocation and replenishment capabilities within its broader retail-planning portfolio. SymphonyAI applies AI across merchandising and assortment optimization, while Oracle and SAP provide assortment-planning capabilities within their broader retail software portfolios.
Nextail focuses on fashion merchandise planning and execution, using AI and machine learning across demand forecasting, allocation, replenishment and inventory optimization. Across these platforms, forecasting capabilities, data integration, planner workflows and explainability provide relevant points of differentiation for retailers evaluating merchandising and assortment-planning solutions.
Which companies are the key providers?
Key companies include RELEX Solutions; Blue Yonder; SymphonyAI; Oracle; Nextail; SAP.
- RELEX Solutions
- Blue Yonder
- SymphonyAI
- Oracle
- Nextail
- SAP
Bibliography
- RELEX Solutions. (2025, February 17). RELEX Solutions unveils new category management capabilities.
- Brox, J. (2025, January 24). Reimagine inventory planning: Aligning allocation and replenishment across the supply chain. Blue Yonder.
- SAP News. (2026, January 8). SAP builds AI into the core of retail at NRF 2026.
- Eurostat. (2025, December 11). 20% of EU enterprises use AI technologies.
- U.S. Census Bureau. (2026, July 16). Advance monthly sales for retail and food services.
- U.S. Census Bureau. (2026, May 18). Quarterly retail e-commerce sales.
- Office for National Statistics. (2026, July 24). Retail sales, Great Britain: June 2026.
- Federal Statistical Office (Destatis). (2025, November 24). Enterprises using cloud computing services.
- ifo Institute. (2026, June 5). More than half of companies in Germany use artificial intelligence.
- Ministry of Data and Statistics. (2026, August 3). Online shopping in June 2026.
- Ministry of Trade, Industry and Resources. (2026, July 29). Major retailer sales up 7.3% in first half of 2026 and 9.5% in June 2026.
- Statistics Bureau, Ministry of Internal Affairs and Communications. (2026, August 17). Retail sales value (Nominal) [Statistics Dashboard].
- Economic and Social Research Institute. (2026, July 30). Consumer Confidence Survey: July 2026. Cabinet Office, Government of Japan.
This Report Answers
- The report explains where smart assortment platforms are used by offering, deployment, capability and customer type.
- Segment analysis identifies the 2026 share positions and the reasons retailers prioritize them.
- Country analysis examines the listed markets and retail channels supporting deployment.
- Competitive analysis reviews current providers across assortment planning and AI-assisted merchandising.
- Application analysis assesses how forecasting and planner workflows influence retail purchase decisions.
What does the Smart Assortment Platforms Market cover?
The Smart Assortment Platforms Market covers software used to decide which products appear in stores, online shelves and local range plans. It combines forecasts and inventory constraints before execution.
The assessment is adjacent to audience measurement where shopper signals improve category decisions, and it also links with recommendation software when online shelves rely on personalized product ranking.
What is included in the scope?
The scope includes licensed, subscription and cloud-hosted assortment platforms. It covers forecasting, decision engines, analytics modules and related services.
Included workflows also connect with live commerce analytics where selling data changes range decisions, and with seasonal peak logistics planning where holiday or event demand shapes product availability.
Retailers may also connect assortment outputs to store replenishment route optimization when stock moves between stores and distribution centers after range decisions are approved.
What is excluded from the scope?
The scope excludes ERP, POS, promotion-only tools and warehouse systems sold without assortment planning functions. Manual consulting projects are excluded when they lack repeatable software workflows.
It also excludes infrastructure-only tools covered under frictionless retail infrastructure unless the product includes assortment logic. Broader store technology grouped with alternative retailing technologies is outside scope when it has no role in range planning decisions.
How Was the Analysis Built?
- Primary Research: Primary research includes discussions with software vendors, planners, category managers, merchandisers and retail technology buyers. These conversations examine adoption priorities and implementation barriers.
- Desk Research: Desk research covers government statistics, company announcements, official retail data and technology documentation. All evidence used in the analysis is documented in the bibliography.
- Market Sizing and Forecasting: Market estimates combine historical performance, retail software spending, cloud adoption, segment shares, country growth and implementation activity.
- Data Validation and Update Cycle: Findings are validated by comparing interviews with public data, company activity, retail indicators and adoption shifts.
Segmentation
What is the report’s scope and coverage?
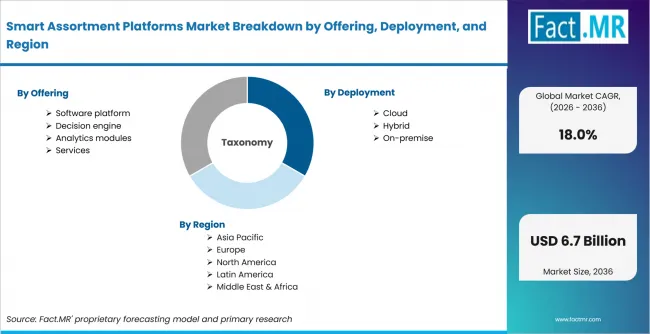
Smart Assortment Platforms Market Breakdown By Offering, Deployment, And Region | Source: Fact.MR
| Attribute | Details |
|---|---|
| Quantitative Units | USD billion in 2026 to USD billion by 2036 at an CAGR |
| Market Definition | Software platforms used by retail planning teams to decide product range, store cluster assortment, digital shelf mix and item-level recommendations. |
| Offering | Software platform; Decision engine; Analytics modules; Services |
| Deployment | Cloud; Hybrid; On-premise |
| Capability | Forecasting; Optimization; Generative assistance; Orchestration |
| Customer | Large enterprise; Mid-market; Specialists |
| Regions Covered | North America; Latin America; Western Europe; Eastern Europe; East Asia; South Asia & Pacific; Middle East & Africa |
| Countries Covered | United States; United Kingdom; Germany; Japan; South Korea |
| Companies Profiled | RELEX Solutions; Blue Yonder; SymphonyAI; Oracle; Nextail; SAP |
| Forecast Period | 2026 to 2036 |
| Approach | Hybrid top-down and bottom-up approach using retail software revenue, assortment planning intensity, cloud adoption, country demand indicators and provider portfolio review. |
Source: Fact.MR analysis. Updated Aug 27, 2026
How is the market segmented?
-
By Offering:
- Software platform
- Decision engine
- Analytics modules
- Services
-
By Deployment:
- Cloud
- Hybrid
- On-premise
-
By Capability:
- Forecasting
- Optimization
- Generative assistance
- Orchestration
-
By Customer:
- Large enterprise
- Mid-market
- Specialists
-
By Region:
- North America
- Latin America
- Western Europe
- Eastern Europe
- East Asia
- South Asia & Pacific
- Middle East & Africa
Frequently Asked Questions
How big is the smart assortment platforms market in 2026?
What is the CAGR of the smart assortment platforms market from 2026 to 2036?
Which offering leads the smart assortment platforms market?
Which deployment leads the smart assortment platforms market?
Who are the leading companies in the smart assortment platforms market?
Who worked on this report


Preview the report firsthand - request a free sample
Free SampleGet the brochure for pricing and purchase details
Download PDF