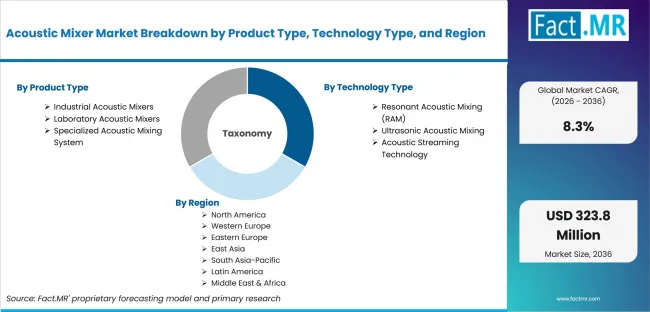
Acoustic Mixer Market Size, Share, Growth and Forecast (2026 - 2036)
The Acoustic Mixer Market is segmented by Product Type, by Technology Type, by Capacity, by Material Type, by End User, and by Region, with forecasts covering the period from 2026 to 2036.
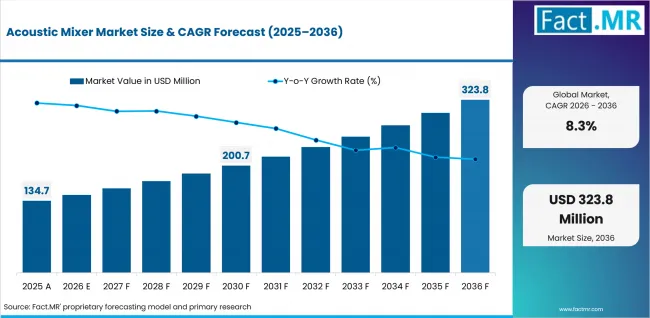
According to market estimates, the global acoustic mixer market stood at USD 134.7 million in 2025. The market is projected to reach around USD 145.9 million in 2026 and is expected to grow to approximately USD 323.8 million by 2036, progressing at a CAGR of 8.3% during the forecast period. Industrial Acoustic Mixers is anticipated to account for nearly 44.70% share by 2026, driven by increasing demand for high-capacity mixing solutions across battery manufacturing and chemical applications.
Acoustic Mixer Market Overview, Growth Outlook, and Forecast by Fact.MR
- In 2025, the global Acoustic Mixer market was valued at approximately USD 134.7 million.
- Based on Fact MR analysis, demand for acoustic mixers is estimated to grow to around USD 145.9 million in 2026 and USD 323.8 million by 2036.
- The market is projected to expand at a CAGR of 8.3% during the forecast period.
Summary of the Acoustic Mixer Market
- Market Snapshot
- In 2025, the global acoustic mixer market was valued at approximately USD 134.7 million.
- The market is estimated to reach around USD 145.9 million in 2026 and is projected to attain nearly USD 323.8 million by 2036.
- The acoustic mixer market is expected to expand at a CAGR of 8.3% during the forecast period.
- The market is anticipated to create an absolute dollar opportunity of approximately USD 177.9 million between 2026 and 2036.
- In terms of product type, Industrial Acoustic Mixers holds the largest share of approximately 44.70% in 2026, driven by increasing demand for high-capacity mixing solutions in battery manufacturing and chemical processing.
- Based on technology type, Resonant Acoustic Mixing (RAM) represents approximately 61.80% share in 2026, driven by its superior efficiency in powder and slurry mixing, reduced cleaning requirements, and scalability across laboratory to industrial applications compared to ultrasonic or acoustic streaming technologies.
- Demand and Growth Drivers
- The market is growing rapidly due to growing interest in high performance battery materials such as in electric vehicles (EVs) and energy storage.
- Resonant acoustic mixing provides an even distribution of nano-materials, conductive additives and binders, which contribute to battery longevity and performance.
- The transition towards dry electrode processing and solventless manufacturing is also speeding up the use of acoustic mixing technology.
- Product and Segment View
- Ultrasonic Acoustic Mixing holds a 27.40% share, driven by its effectiveness in liquid and fine particle mixing, offering precise control and repeatability for applications such as battery slurry preparation, along with growing demand for non‑contact mixing in sensitive materials.
- Pharmaceutical & Biotechnology Companies accounts for a 34.80% share, supported by increasing R&D activities and production of complex drug formulations, and the need for contamination‑free, along with the growing adoption of acoustic mixing for dry powder blending and wet granulation processes.
- Slurry & Paste Mixing commands a 31.40% share, owing to its critical role in high‑viscosity material processing for battery electrodes, and advanced composites, enabling uniform dispersion and deagglomeration while maintaining material integrity, essential for energy storage and additive manufacturing applications
- Resonant Acoustic Mixing (RAM) represents a 61.80% share, driven by its superior efficiency in mixing powders, slurries, and pastes without moving parts or blades, reducing cleaning time and cross‑contamination risk, making it the most versatile method for laboratory to industrial scale across pharmaceuticals, batteries, and chemicals.
- Geography and Competitive Outlook
- North America has the largest acoustic mixer market in the world, supported by its growth rate and deployment of technology such as 'In-Situ Process Control', 'Advanced Manufacturing' and "Resodyn Acoustic Mixers".
- Europe has the second largest Acoustic Mixer Market and continues to grow at a steady rate. The growth of the market is attributed to the rise in application of sustainable manufacturing practices and a focus on high-accuracy process control in the pharmaceutical market, which has resulted in an increasing number of applications that do not use solvents or energy to produce products.
- Asia has the highest anticipated growth rate for Acoustic Mixers over the next few years, driven by the expected growth of battery manufacturing, the pharmaceutical market and the production of advanced materials. Moreover, the competing landscape is very fragmented, with few businesses manufacturing direct acoustic mixers.
- The global Acoustic Mixer market includes key players such as Resodyn Acoustic Mixers, Inc., Montana Mixers, Zhengzhou Abrasive and Grinding Co Ltd., PCCA, Eirich, and others.
- Analyst Opinion
- Shambhu Nath Jha, Principal Consultant at Fact.MR, says, “Acoustic mixers are seeing a steady growth in the global market with industries growing more interested in high precision material processing, formulation cycles and sustainable manufacturing practices. Advanced applications, like battery materials, pharmaceutical formulations and mechanochemistry are playing a major part in the uptake.
Acoustic Mixer Market — At a Glance
| Metric | Value |
|---|---|
| Market Value 2025 | USD 134.7 million |
| Market Value 2026 | USD 145.9 million |
| Market Value 2036 | USD 323.8 million |
| Absolute Dollar Opportunity | USD 177.9 million |
| CAGR | 8.30% |
| Growth Multiple | 2.4x |
| Key Demand Theme | Growing demand for contamination‑free, high‑efficiency mixing in pharmaceutical and battery manufacturing; rising adoption of resonant acoustic mixing for powder and slurry processing without moving parts; and increasing need for scalable acoustic mixing solutions from laboratory R&D to industrial production. |
| Leading Product Type | Industrial Acoustic Mixers |
| Product Type Share | 44.70% |
| Leading Capacity | 20-100 Liters |
| Capacity Share | 28.60% |
| Leading Material Type | Powder Mixing |
| Material Type Share | 46.90% |
| Leading End User | Pharmaceutical & Biotechnology Companies |
| End User Share | 34.80% |
| Leading Technology Type | Resonant Acoustic Mixing (RAM) |
| Technology Type Share | 61.80% |
| Key Growth Regions | Asia Pacific, Europe, North America |
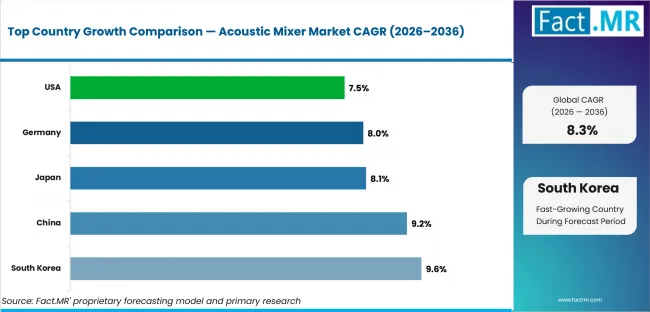
| Fastest Growing Countries | South Korea (9.6%), China (9.2%), Japan (8.1%), Germany (8.0%), USA (7.5%) |
| Key Companies | Resodyn Acoustic Mixers, Inc., Montana Mixers, Zhengzhou Abrasive and Grinding Co Ltd., PCCA, Eirich, and others. |
| Product Type Segmentation | Laboratory Acoustic Mixers, Industrial Acoustic Mixers, Specialized Acoustic Mixing System |
| Technology Type Segmentation | Resonant Acoustic Mixing (RAM), Ultrasonic Acoustic Mixing, Acoustic Streaming Technology |
| Capacity Segmentation | Below 5 Liters, 5-20 Liters, 20-100 Liters, 100-500 Liters, 500-1,000 Liters, and Above 1,000 Liters |
| Material Type Segmentation | Powder Mixing, Liquid Mixing, Slurry & Paste Mixing |
| End User Segmentation | Pharmaceutical & Biotechnology Companies, Battery Manufacturers, Chemical Companies, Additive Manufacturing Companies, Research Organizations |
| Region Segmentation | North America, Western Europe, Eastern Europe, East Asia, South Asia-Pacific, Latin America, and Middle East & Africa |
Key Growth Drivers, Constraints, and Opportunities
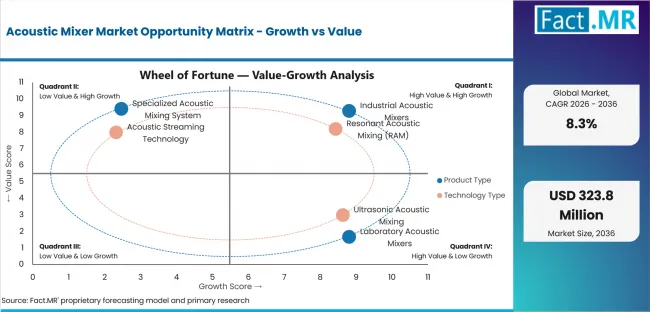
Key Factors Driving Growth
- The acoustic mixer has gained in popularity due to an increased manufacturer focus on uniformity of mixed materials, eliminating contamination from the mixing process during production, and enhancing quality of finished product through outgoing technology that improves overall efficiency of blending and final product quality.
- As pharmaceutical development, battery manufacture and advanced material development have all gained popularity, many manufacturers are using some form of an acoustic mixing technology to create stable, efficient processes and allow for real-time control of the production process via an acoustic mix system.
- Advanced acoustic control architectures or acoustic-based software defined frequency modulated (FM) system controls have enabled the design of higher performance mixing systems based upon acoustic mix systems; they have been preferred due to increased safety, greater accuracy in providing a homogenous blend of the components being mixed.
| Growth Driver | Demand Impact | Time Horizon | Key Impact Area | Fact.MR Insight |
|---|---|---|---|---|
| Increasing demand for contamination free, high‑uniformity mixing in pharmaceutical and battery production | High | Short–Mid Term | Adoption acceleration | Rising focus on drug quality, regulatory compliance, and battery performance consistency is significantly increasing demand for acoustic mixers |
| Expansion of applications in battery manufacturing, advanced materials, and additive manufacturing | High | Short–Mid Term | Product innovation & scaling | Growing adoption of electric vehicles and energy storage systems is driving large‑scale integration of acoustic mixing technologies across industrial platforms |
| Rising focus on mixing efficiency, scalability, and real‑time process control | High | Mid Term | Performance enhancement | Increasing emphasis on uniform powder blending, slurry deagglomeration, and batch reproducibility is boosting deployment of resonant and ultrasonic acoustic mixers |
| Advancements in acoustic frequency control, sensors, and software‑defined mixing architectures | High | Mid–Long Term | Technology advancement | Continuous improvements in frequency modulation, real‑time monitoring, and automated process control are improving mixing precision, scalability, and energy efficiency |
Key Market Constraints
- The total cost to produce a mixing system is substantially higher due to the additional costs associated with the integration and development of state-of-the-art acoustic mixers, as well as the comprehensive cost associated with developing frequency control software and designing the physical features associated with an acoustic mixer.
- End user and manufacturer awareness and education levels are severely lacking regarding the true benefits associated with using an acoustic mixing technology, which has created a barrier to acceptance and thus developing an acceptance of acoustic mixers within non-high-value markets such as pharmaceuticals and battery production.
- The stringent regulation placed on all activities related to making a pharmaceutical product or battery safe for consumption, along with continuing global evolution of regulatory standards surrounding process validation and having an approved Good Manufacturing Practice (GMP) Validation Certification could prolong or hinder the ability to have an acoustic mixer validated, as regulatory entities may delay or disallow validations of certain elements of the acoustic mixer through testing and/or certification processes.
Key Opportunity Areas
- Non-contaminating processing methods, and scalable performance attributes, there is an abundance of accessible technologies for acoustic mixing across all categories of pharmaceuticals, batteries, chemicals, and additive manufacturing.
- Consumer as well as industrial preferences are constantly changing as we move towards using cleaner, more efficient, and flexible production methodologies and this will provide multiple opportunities for producing premium drug products; or the manufacturing of electric vehicle batteries; or advancing materials-related projects.
- Manufacturers and end-users' capacity to realize next-generation acoustic mixing solutions is rapidly increasing due to major improvements made to the controls of acoustic frequencies, process monitoring in real-time, and software-defined mixing architectures.
Segment-wise Analysis of the Acoustic Mixer Market
- Industrial Acoustic Mixers holds a 44.70% share in the product type segment, driven by its essential role as the most widely adopted category in battery manufacturing and chemical processing, with growing demand for high‑capacity mixing, along with increasing need for consistent slurry preparation and scalable production in mass‑market and industrial applications.
- Powder Mixing accounts for a 46.90% share in the material type segment, supported by the increasing need for uniform blending, contamination‑free processing, and deagglomeration in pharmaceutical, battery, enabling precise material properties and batch reproducibility, while maintaining scalability and efficiency compared to other material types such as liquid or slurry mixing.
- Resonant Acoustic Mixing (RAM) commands a 61.80% share in the technology type segment, driven by its superior efficiency with powders, slurries, and pastes, and enabling mass adoption of advanced acoustic mixing solutions without compromising material integrity or requiring moving parts.
The global Acoustic Mixer market is segmented by product type, technology type, capacity, material type, end user, and region.
Which Product Type Segment Dominates the Market?
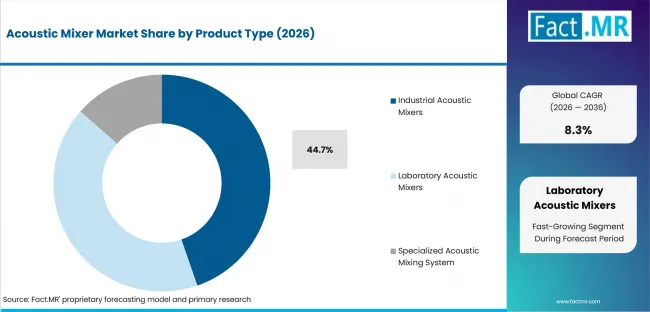
Industrial Acoustic Mixers dominate the market holding more than 44.7% of market share and are projected to retain the same dominance in the future. Their versatility and ability to provide high capacity mixing, ensure slurry uniformity and scalability make them popular for battery manufacturing, chemical processing and industrial scale applications.
Which Technology Type Segment Dominates the Market?
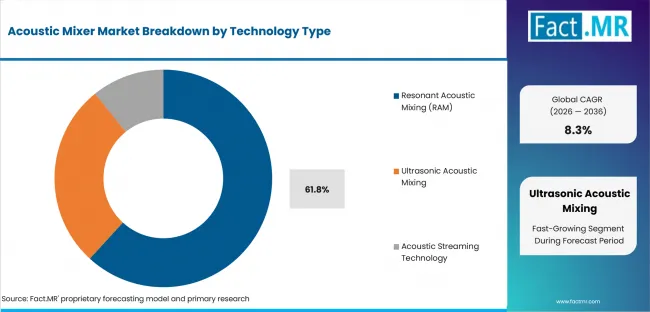
The market share of resonant acoustic mixing (RAM) is expected to stay dominated since RAM accounts for over 61.8% of the total market. Numerous industries use RAM including pharmaceuticals, batteries, and chemicals, primarily because of RAM's effectiveness at delivering highly efficient powder/slurry mixing, contamination-free processing, and seamless scale up from lab to industrial scale.
Which Material Type Segment Dominates the Market?
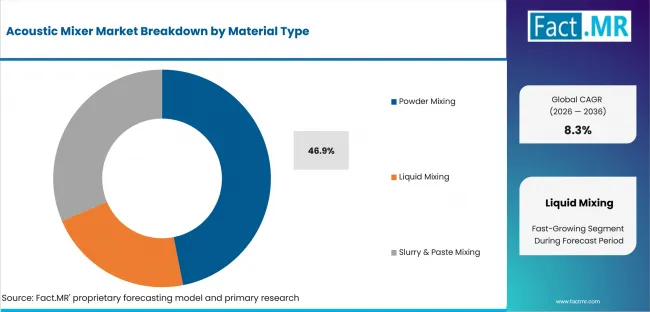
The Powder Mixing sector has captured 46.9% of the market, and continues to dominate as it is heavily utilized in various industries including medicine, batteries and chemicals due to its capacity to create consistent mixes, process without introducing any impurities, and provide a means for effectively breaking up clumped together dry powders.
Which End User Segment Dominates the Market?
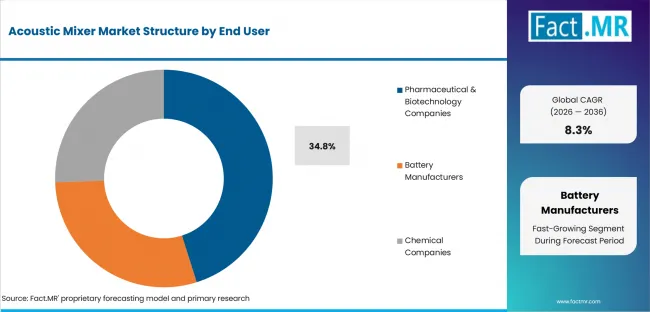
Pharmaceutical and Biotech firms represent more than 34.8% of the overall marketplace and are likely to continue to be the top players in this field for some time. They are used extensively for drug formulation, research and development, and commercial production because of their capacity to perform contamination-free mixing as well as to provide regulatory compliance and consistent quality control of the manufacturing process when working with powdered and slurry products.
Regional Outlook Across Key Markets
The market analysis covers key global regions, including South Asia and Pacific, Middle East & Africa, North America, Latin America, Western Europe, and Eastern Europe. It is segmented geographically, with specific market dynamics for each region. The full report provides a detailed market attractiveness analysis.
.webp)
CAGR Table
| Country | CAGR (%) |
|---|---|
| U.S.A. | 7.5% |
| Germany | 8.0% |
| China | 9.2% |
| Japan | 8.1% |
| South Korea | 9.6% |
| U.K. | 9.4% |
| France | 9.0% |
Source: Fact.MR (FMR) analysis, based on proprietary forecasting model and primary research.
North America – The Acoustic Mixer Hub
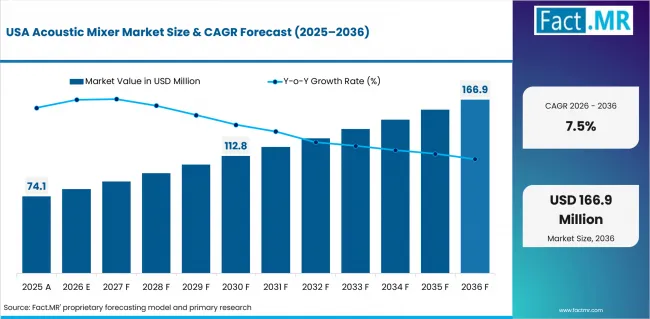
The use of acoustic mixers is growing in popularity as they are becoming the standard for improving both uniformity of mixing, contamination-free processing, batch-to-batch consistency, and are helping to support scale up production among pharmaceutical, battery, and chemical manufacturers. Other applications of acoustic mixers include powder blending, de-agglomeration of slurries, liquid dispersion, and real-time control of acoustic frequency and amplitude.
- U.S.: Demand for acoustic mixers in the U.S. is projected to grow at a CAGR of 7.5%, supported by increasing adoption of advanced pharmaceutical manufacturing and growing utilization of resonant acoustic mixing and ultrasonic acoustic mixing systems in pharmaceutical & biotechnology companies and battery manufacturing facilities.
Western Europe – A Key Growth Region for Acoustic Mixers
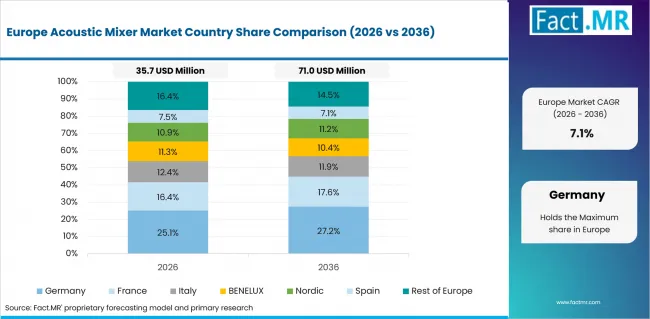
Strict pharmaceutical and chemical manufacturing laws, the increasing use of continuous manufacturing techniques and processes that comply with manufacturing standards have resulted in these systems being adopted in Western Europe. Furthermore, the adoption of these systems has been driven by the need from premium pharmaceutical and battery manufacturers, who are utilizing advanced mixing techniques with resonant and ultrasonic acoustic mixers.
- Germany: Demand for acoustic mixers in Germany is projected to grow at a CAGR of 8.0%, supported by the presence of leading pharmaceutical and chemical companies, strong R&D investments in acoustic mixing and software‑controlled frequency modulation technologies.
East Asia – The Engine of Acoustic Mixer Innovation
The expansion of battery manufacturers is accelerating the rate of development for Acoustic Mixers in the East Asian region. In addition, robust local production capabilities along with Government support of the Pharmaceutical and Electric Vehicle Supply Chain have created a supportive business environment for regional development.
- China: Demand for acoustic mixers in China is projected to grow at a CAGR of 9.2%, supported by the world's largest electric vehicle battery market, and rising deployment of resonant and ultrasonic acoustic mixing systems across local manufacturers such as CATL, BYD, and major pharmaceutical companies.
South Asia & Pacific – The Emerging Powerhouse for Acoustic Mixer Adoption
The acoustic mixer market is growing quickly in the South Asia Pacific region due to the increase in production of pharmaceuticals and batteries; higher investment in advanced mixing technology; increasing demand for contamination-free, highly uniform processing; and government programs that promote local production of electric vehicle batteries and generics.
- India: Demand for acoustic mixers in India is projected to grow at a CAGR of 9.2%, supported by the country's rapidly growing pharmaceutical manufacturing and electric vehicle battery production market, and increasing adoption of resonant and ultrasonic acoustic mixing systems across local pharmaceutical and battery manufacturers.
Latin America – The Untapped Opportunity for Acoustic Mixers
The Latin American market will develop rapidly due to recent improvements and changes in the Latin American markets. There has been an increase in the need for better mixing with fewer contaminants in pharmaceuticals and batteries. Additionally, there has been a shift towards using higher quality processes and manufacturing reproduceable batches. Acoustic mixers will also gain acceptance from generic pharmaceutical companies, electric vehicle battery manufacturers, and chemical processing companies.
- Brazil: Demand for acoustic mixers in Brazil is projected to grow at a steady 9.5% CAGR through 2036, supported by the country's large and growing pharmaceutical and battery manufacturing industry, rising local production of generic drugs and EV batteries, and resonant acoustic mixing technologies for both R&D and commercial use.
Middle East & Africa – The Rising Market for Acoustic Mixers
Market for Acoustic Mixers in MEA will continue to grow due to rising investment in infrastructure for pharmaceutical/chemical/battery production, an even greater need for contamination-free, efficient mixing processes, advances in resonant and ultrasonic acoustic mixers, and growth in volume of generic drugs produced and the number of electric vehicle batteries manufactured in this region.
- KSA: Demand for acoustic mixers in Saudi Arabia is projected to grow at around 9.1% CAGR through 2036, supported by the country's Vision 2030 initiatives promoting industrial diversification, and modernization of pharmaceutical and battery manufacturing infrastructure.
Fact.MR analysis provides a comprehensive regional outlook across North America, Latin America, Western Europe, Eastern Europe, East Asia, South Asia & Pacific, and the Middle East & Africa. It offers detailed country-wise insights, highlighting growth trends, demand patterns, and adoption across key industries in both developed and emerging markets.
Competitive Benchmarking and Company Positioning
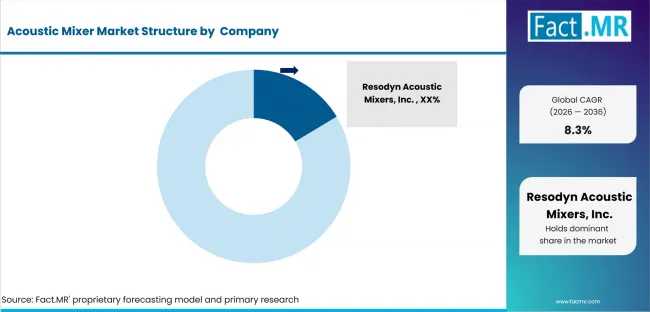
Leading Companies Shaping the Acoustic Mixer Market
Numerous enterprise level organizations are in the acoustic mixer market, making it a moderately fragmented sector in which top businesses, including Resodyn Acoustic Mixers, Inc., Montana Mixers, Zhengzhou Abrasive and Grinding Co Ltd., and PCCA, combine to make up approximately 45-50% of the overall market size. The acoustic mixer marketplace growth rates will continue to increase due to electricity‑committed EV battery markets, increased required regulatory compliance for GMP and pharmaceutical manufacturing standards within these manufacturers' products, and increased demand by end users for better mixing uniformity and contamination‑free processing across various types of acoustic mixing systems, such as resonant acoustic mixing, ultrasonic acoustic mixing, and acoustic streaming technology.
Key Players of the Acoustic Mixer Market
- Resodyn Acoustic Mixers, Inc.
- Montana Mixers
- Zhengzhou Abrasive and Grinding Co Ltd.
- PCCA
- Eirich
- Hosokawa Micron B.V.
Recent Industry Developments
- Resonant Acoustic Mixing Enables Dry Electrode Processing for Lithium-Ion Batteries (2026), A key technology enabling shift is Resonant Acoustic Mixing (RAM) an advanced method for battery powder mixing that delivers superior homogeneity, faster processing times, and improved material performance. (Resodyn) [1]
- All-In-One Resonant Acoustic Processor (2025): ResonantAcoustic technology was developed for commercial use (in the 1990’s and early 2000’s), mixing was the target application. (Resonant) [2]
- New Applications in Pharmaceuticals (2025): Resodyn hosted a technical webinar showcasing how RAM technology can speed up drug formulation and scale-up, achieving unmatched repeatability. (Resodyn) [3]
- Expanded Capabilities in Product Line (2025): Resodyne highlights its bladeless "Montana Mixer," which can accelerate up to 100 Gs, reducing mixing times by 10 to 100 times compared to conventional methods. (Resodyn) [4]
- Graham Corporation Acquires FlackTek (2026): The acquisition establishes advanced mixing as a third core platform for Graham, complementing its existing strengths in vacuum, heat transfer, and turbomachinery. The goal is to offer more comprehensive solutions across defense, energy, and space markets. (Graham) [5]
Sources and Research References
- [1] “Resonant Acoustic Mixing Enables Dry Electrode Processing for Lithium-Ion Batteries”, 2026
- [2] “All-In-One ResonantAcoustic Processor”, 2025
- [3] “Resodyn hosted a technical webinar showcasing how RAM technology”, 2025
- [4] “Expanded Capabilities in Product Line”, 2025
- [5] “Graham Corporation Acquires FlackTek”, 2026
Acoustic Mixer Market Definition
The acoustic mixer market is a part of the industrial mixing industry focusing on the latest mixing technologies that integrate resonant or ultrasonic acoustic energy, mechanical vibration and process control to achieve better mixing uniformity, efficiency and overall material processing performance. It also offers solutions like resonant acoustic mixing (RAM), ultrasonic acoustic mixing, and acoustic streaming technology for powder mixing, liquid blending, slurry & paste processing and more.
Acoustic Mixer Market Inclusions
The acoustic mixer market is focused on advanced mixing technologies and components designed to enhance mixing uniformity, efficiency and material processing performance. It consists of systems like resonant acoustic mixing, ultrasonic acoustic mixing and the acoustic streaming technology. Such solutions are developed based on state-of-the-art systems for generation of acoustic energy, vibration control systems, and process control architectures.
Acoustic Mixer MarketExclusions
Traditional mechanical mixing equipment and simple blending devices with no acoustic energy generation, resonant frequency control or software-based process optimization are not considered to be acoustic mixer products. This market does not include traditional mixers, which include propeller agitators, magnetic stirrers, high-shear mixers and static mixers.
Acoustic Mixer Market Research Methodology
- Primary Research
- This report does not cover any of the standard mixing systems that are not acoustic, resonant, or ultrasonic. Mechanical mixers that do not include acoustic energy control, frequency modulation or real-time process optimization are not included in the scope of the study.
- Desk Research
- This analysis is based on secondary research that is carried out after reviewing the industry reports, publications of acoustic mixer manufacturers, website of the suppliers, technical product catalogs and all other relevant sources on the acoustic mixing systems. The data gathered are from trusted sources such as chemical and pharmaceutical trade literature, publications of mixing equipment and well-known market research sources.
- Market-Sizing and Forecasting
- The size of the global acoustic mixer market has been estimated from the top-down and bottom-up methods. The bottom-up approach starts with the advanced acoustic mixing technologies resonant acoustic mixing, ultrasonic acoustic mixing, and solutions based on acoustic streaming and then examines the share of these technologies in the overall market for industrial mixing equipment.
- Data Validation and Update Cycle
- A systematic cross-checking of the data obtained from industry related reports, filings from mixer manufacturers, databases of suppliers, technical journals, and other industry secondary data sources made available to the public, was used to validate the data pertaining to this acoustic mixer market.
Scope of Analysis

| Parameter | Details |
|---|---|
| Quantitative Units | USD 134.7 million in 2025 to USD 323.8 million in 2036, at a CAGR of 8.3% |
| Market Definition | The Acoustic Mixer Market comprises advanced industrial mixing systems that integrate acoustic energy generators, frequency control units, sensors, and process control software to enhance mixing uniformity, efficiency, and material processing performance. These systems include resonant acoustic mixing (RAM), ultrasonic acoustic mixing, and acoustic streaming technology. |
| Regions Covered | North America, Latin America, Western Europe, Eastern Europe, East Asia, South Asia & Pacific, Middle East & Africa |
| Countries Covered | USA, China, Germany, UK, Japan, India, Brazil, KSA, and 30+ countries |
| Key Companies | Resodyn Acoustic Mixers, Inc., Montana Mixers, Zhengzhou Abrasive and Grinding Co Ltd., PCCA |
| Forecast Period | 2026 to 2036 |
| Approach | Hybrid demand-side and top-down methodology based on increasing adoption of acoustic mixing in pharmaceutical and battery manufacturing, growing penetration of resonant and ultrasonic mixing technologies, rising integration of software-controlled frequency modulation, and expanding demand for contamination‑free processing, batch reproducibility, and real‑time mixing optimization. |
Analysis by Product Type, by Technology Type, by Capacity, by Material Type, by End User, and by Region
-
Acoustic Mixer Market By Product Type
- Laboratory Acoustic Mixers
- Benchtop Acoustic Mixers
- Research-scale Acoustic Mixers
- Pilot-scale Acoustic Mixers
- Industrial Acoustic Mixers
- Batch Acoustic Mixers
- Continuous Acoustic Mixers
- Large-volume Production Acoustic Mixers
- Specialized Acoustic Mixing System
- Vacuum Acoustic Mixers
- Inert Gas Acoustic Mixers
- Integrated Mixing & Dispensing Systems
- Laboratory Acoustic Mixers
-
Acoustic Mixer Market By Technology Type
- Resonant Acoustic Mixing (RAM)
- Single-axis Resonant Systems
- Multi-axis Resonant Systems
- High-G Force Resonant Systems
- Ultrasonic Acoustic Mixing
- Ultrasonic Liquid Mixing Systems
- Ultrasonic Dispersion Systems
- Ultrasonic Emulsification Systems
- Acoustic Streaming Technology
- Surface Acoustic Wave (SAW) Mixers
- Bulk Acoustic Wave (BAW) Mixers
-
Acoustic Mixer Market By Capacity
- Below 5 Liters
- 5–20 Liters
- 20–100 Liters
- 100–500 Liters
- 500–1,000 Liters
- Above 1,000 Liters
-
Acoustic Mixer Market By Material Type
- Powder Mixing
- Fine Powders
- Metal Powders
- Composite Powders
- Liquid Mixing
- Low-viscosity Liquids
- High-viscosity Liquids
- Solvent-based Formulations
- Slurry & Paste Mixing
- Battery Slurries
- Ceramic Slurries
- Functional Pastes
- Powder Mixing
-
Acoustic Mixer Market By End User
- Pharmaceutical & Biotechnology Companies
- Drug Manufacturers
- CDMOs/CMOs
- Biotech Firms
- Battery Manufacturers
- EV Battery Producers
- Energy Storage Companies
- Battery Material Suppliers
- Chemical Companies
- Specialty Chemical Producers
- Advanced Material Companies
- Catalyst Manufacturers
- Additive Manufacturing Companies
- Metal AM Companies
- Polymer AM Companies
- Service Bureaus
- Research Organizations
- Universities
- Government Laboratories
- Industrial R&D Centers
- Pharmaceutical & Biotechnology Companies
-
Acoustic Mixer Market By Region
- North America
- USA
- Canada
- Mexico
- Latin America
- Brazil
- Chile
- Rest of LATAM
- East Asia
- China
- Japan
- South Korea
- Western Europe
- Germany
- Italy
- France
- U.K.
- Spain
- BENELUX
- Nordic
- of W. Europe
- Eastern Europe
- Russia
- Hungary
- Poland
- Balkan & Baltics
- Rest of E. Europe
- Middle East and Africa
- Kingdom of Saudi Arabia
- United Arab Emirates
- South Africa
- Rest of Middle East and Africa
- North America
- Frequently Asked Questions -
How large is the demand for Acoustic Mixer in the global market in 2025?
Demand for Acoustic Mixer in the global market is estimated to be valued at USD 134.7 million in 2025.
What will be the market size of Acoustic Mixer in the global market by 2036?
The market size for Acoustic Mixer is projected to reach USD 323.8 million by 2036.
What is the expected demand growth for Acoustic Mixer in the global market between 2026 and 2036?
Demand for Acoustic Mixer in the global market is expected to grow at a CAGR of 8.3% between 2026 and 2036.
Which product type segment is expected to dominate the Acoustic Mixer market?
Industrial Acoustic Mixers is expected to dominate the market, accounting for a 44.70% share in 2026, driven by its widespread use in battery manufacturing, chemical processing, and industrial scale applications for high‑capacity mixing and consistent slurry preparation, broad adoption across battery manufacturers and chemical companies, and its compatibility with resonant and ultrasonic acoustic mixing technologies for powder blending, liquid dispersion, and slurry deagglomeration.
How significant is the growth outlook for the USA in this market?
USA is expected to grow at a CAGR of 7.2% through 2036, supported by increasing adoption of advanced pharmaceutical manufacturing and electric vehicle battery production, rising regulatory focus on GMP and quality standards, and the presence of leading acoustic mixer manufacturers investing in resonant acoustic mixing, and software‑controlled frequency modulation product lines.
Which company is identified as a leading player in the Acoustic Mixer Market?
Resodyn Acoustic Mixers, Inc. is identified as a leading player in the market, supported by its strong portfolio of advanced acoustic mixing systems including resonant acoustic mixing for powder and slurry processing, ultrasonic acoustic mixing for liquid dispersion, and specialized acoustic mixing systems for high‑viscosity paste and battery electrode applications.
Table of Content
- Acoustic Mixer Market – Executive Summary
- Market Overview
- Market Definition & Introduction
- Market Taxonomy & Research Scope
- Global Acoustic Mixer Market Demand Analysis 2021-2025 and Forecast, 2026–2036
- Historical Market Volume (Units) Analysis, 2021-2025
- Current and Future Market Volume (Units) Projections, 2026–2036
- Y-o-Y Growth Trend Analysis
- Global Acoustic Mixer Market - Pricing Analysis
- Product Category and Country-Level Pricing Analysis
- Region Average Pricing Analysis Benchmark
- Price Trends and Forecasts
- Historical price trends
- Future price forecasts
- Factors Influencing Pricing
- Competitive Pricing Strategies
- Cost Structure Analysis
- Global Acoustic Mixer Market Demand (in Value or Size in US$ Mn) Analysis 2021-2025 and Forecast, 2026–2036
- Historical Market Value (US$ Mn) Analysis, 2021-2025
- Current and Future Market Value (US$ Mn) Projections, 2026–2036
- Y-o-Y Growth Trend Analysis
- Absolute $ Opportunity Analysis
- Market Background and Foundational Data Points
- Share of acoustic mixing technologies in the total industrial mixing equipment market (%)
- Annual growth rate of advanced material processing technologies adoption (%)
- Penetration rate of high-precision powder mixing technologies in pharmaceutical manufacturing (%)
- Adoption rate of solvent-free and dry processing technologies in chemical and pharma industries (%)
- Share of high-performance battery material processing using advanced mixing systems (%)
- Growth rate of global lithium-ion battery production (%)
- Integration rate of advanced mixing systems in R&D laboratories (units per lab)
- Share of pharmaceutical formulations requiring ultra-uniform low-dose blending (%)
- Growth in demand for high-purity and contamination-free mixing technologies (%)
- Average batch processing time reduction achieved using acoustic mixers (%)
- Adoption rate of non-contact / bladeless mixing technologies (%)
- Share of mechanochemistry-based processing in total chemical synthesis (%)
- Growth in demand for nano-material dispersion and uniform particle distribution (%)
- Percentage of processes requiring rapid formulation screening and high-throughput mixing (%)
- Growth rate of continuous and automated material processing technologies adoption globally (%)
- Acoustic Mixer Market Opportunity Assessment
- Total Available Market (US$ Mn)
- Serviceable Addressable Market (US$ Mn)
- Serviceable Obtainable Market (US$ Mn)
- Porter’s Five Forces and PESTEL Analysis
- Investment Feasibility Analysis
- Macro-Economic Factors & Forecast Factors - Relevance & Impact
- Industry Value and Supply Chain Analysis
- List of Key Channel Partners
- Profit Margin & Operating Margin at Each Node of Supply Chain.
- Notes on Value Added at Each Node in the Value Chain
- Factors Influencing Value Chain
- Market Dynamics
- Drivers
- Restraints
- Opportunity Analysis
- Key Regulations & Certifications
- Acoustic Mixer Market Analysis 2021-2025 and Forecast 2026–2036, By Product Type
- Introduction / Key Findings
- Historical Market Size (US$ Mn) & Volume (Units) Trend Analysis By Product Type, 2021-2025
- Current and Future Market Size (US$ Mn) & Volume (Units) Analysis and Forecast By Product Type, 2026-2036
- Laboratory Acoustic Mixers
- Benchtop Acoustic Mixers
- Research-scale Acoustic Mixers
- Pilot-scale Acoustic Mixers
- Industrial Acoustic Mixers
- Batch Acoustic Mixers
- Continuous Acoustic Mixers
- Large-volume Production Acoustic Mixers
- Specialized Acoustic Mixing System
- Vacuum Acoustic Mixers
- Inert Gas Acoustic Mixers
- Integrated Mixing & Dispensing Systems
- Laboratory Acoustic Mixers
- Market Attractiveness Analysis By Product Type
- Acoustic Mixer Market Analysis 2021-2025 and Forecast 2026–2036, By Capacity
- Introduction / Key Findings
- Historical Market Size (US$ Mn) & Volume (Units) Trend Analysis By Capacity, 2021-2025
- Current and Future Market Size (US$ Mn) & Volume (Units) Analysis and Forecast By Capacity, 2026-2036
- Below 5 Liters
- 5–20 Liters
- 20–100 Liters
- 100–500 Liters
- 500–1,000 Liters
- Above 1,000 Liters
- Market Attractiveness Analysis By Capacity
- Acoustic Mixer Market Analysis 2021-2025 and Forecast 2026–2036, By Material Type
- Introduction / Key Findings
- Historical Market Size (US$ Mn) & Volume (Units) Trend Analysis By Material Type, 2021-2025
- Current and Future Market Size (US$ Mn) & Volume (Units) Analysis and Forecast By Material Type, 2026-2036
- Powder Mixing
- Fine Powders
- Metal Powders
- Composite Powders
- Liquid Mixing
- Low-viscosity Liquids
- High-viscosity Liquids
- Solvent-based Formulations
- Slurry & Paste Mixing
- Battery Slurries
- Ceramic Slurries
- Functional Pastes
- Powder Mixing
- Market Attractiveness Analysis By Material Type
- Acoustic Mixer Market Analysis 2021-2025 and Forecast 2026–2036, By End User
- Introduction / Key Findings
- Historical Market Size (US$ Mn) & Volume (Units) Trend Analysis By End User, 2021-2025
- Current and Future Market Size (US$ Mn) & Volume (Units) Analysis and Forecast By End User, 2026-2036
- Pharmaceutical & Biotechnology Companies
- Drug Manufacturers
- CDMOs/CMOs
- Biotech Firms
- Battery Manufacturers
- EV Battery Producers
- Energy Storage Companies
- Battery Material Suppliers
- Chemical Companies
- Specialty Chemical Producers
- Advanced Material Companies
- Catalyst Manufacturers
- Additive Manufacturing Companies
- Metal AM Companies
- Polymer AM Companies
- Service Bureaus
- Research Organizations
- Universities
- Government Laboratories
- Industrial R&D Centers
- Pharmaceutical & Biotechnology Companies
- Market Attractiveness Analysis By End User
- Acoustic Mixer Market Analysis 2021-2025 and Forecast 2026–2036, By Technology Type
- Introduction / Key Findings
- Historical Market Size (US$ Mn) & Volume (Units) Trend Analysis By Technology Type, 2021-2025
- Current and Future Market Size (US$ Mn) & Volume (Units) Analysis and Forecast By Technology Type, 2026-2036
- Resonant Acoustic Mixing (RAM)
- Single-axis Resonant Systems
- Multi-axis Resonant Systems
- High-G Force Resonant Systems
- Ultrasonic Acoustic Mixing
- Ultrasonic Liquid Mixing Systems
- Ultrasonic Dispersion Systems
- Ultrasonic Emulsification Systems
- Acoustic Streaming Technology
- Surface Acoustic Wave (SAW) Mixers
- Bulk Acoustic Wave (BAW) Mixers
- Resonant Acoustic Mixing (RAM)
- Market Attractiveness Analysis By Technology Type
- Global Acoustic Mixer Market Analysis and Forecast, by Region
- Introduction / Key Findings
- Historical Market Size (US$ Mn) & Volume (Units) Trend Analysis by Region, 2021-2025
- Current and Future Market Size (US$ Mn) & Volume (Units) Analysis and Forecast by Region, 2026-2036
- North America
- Latin America
- Western Europe
- Eastern Europe
- East Asia
- South Asia & Pacific
- Middle East & Africa
- Market Attractiveness Analysis by Region
- North America Acoustic Mixer Market Analysis and Forecast
- Introduction / Key Findings
- Pricing Analysis
- Historical Market Size (US$ Mn) & Volume (Units) Trend Analysis by Market Taxonomy, 2021-2025
- Current and Future Market Size (US$ Mn) and Volume (Units) Analysis & Forecast by Market Taxonomy, 2026-2036
- By Country
- United States
- Canada
- Mexico
- By Taxonomy
- Market Attractiveness Analysis By Country & Taxonomy
- Market Trends
- Key Market Participants – Intensity Mapping
- Drivers and Restraints - Impact Analysis
- Latin America Acoustic Mixer Market Analysis and Forecast
- Introduction / Key Findings
- Pricing Analysis
- Historical Market Size (US$ Mn) & Volume (Units) Trend Analysis by Market Taxonomy, 2021-2025
- Current and Future Market Size (US$ Mn) and Volume (Units) Analysis & Forecast by Market Taxonomy, 2026-2036
- By Country
- Brazil
- Chile
- Rest of LATAM
- By Taxonomy
- Market Attractiveness Analysis By Country & Taxonomy
- Market Trends
- Key Market Participants – Intensity Mapping
- Drivers and Restraints - Impact Analysis
- Western Europe Acoustic Mixer Market Analysis and Forecast
- Introduction / Key Findings
- Pricing Analysis
- Historical Market Size (US$ Mn) & Volume (Units) Trend Analysis by Market Taxonomy, 2021-2025
- Current and Future Market Size (US$ Mn) and Volume (Units) Analysis & Forecast by Market Taxonomy, 2026-2036
- By Country
- Germany
- Italy
- France
- United Kingdom
- Spain
- BENELUX
- Nordics
- Rest of Western Europe
- By Taxonomy
- Market Attractiveness Analysis By Country & Taxonomy
- Market Trends
- Key Market Participants – Intensity Mapping
- Drivers and Restraints - Impact Analysis
- Eastern Europe Acoustic Mixer Market Analysis and Forecast
- Introduction / Key Findings
- Pricing Analysis
- Historical Market Size (US$ Mn) & Volume (Units) Trend Analysis by Market Taxonomy, 2021-2025
- Current and Future Market Size (US$ Mn) and Volume (Units) Analysis & Forecast by Market Taxonomy, 2026-2036
- By Country
- Russia
- Hungary
- Poland
- Balkan & Baltics
- Rest of Eastern Europe
- By Taxonomy
- Market Attractiveness Analysis By Country & Taxonomy
- Market Trends
- Key Market Participants – Intensity Mapping
- Drivers and Restraints - Impact Analysis
- East Asia Acoustic Mixer Market Analysis and Forecast
- Introduction / Key Findings
- Pricing Analysis
- Historical Market Size (US$ Mn) & Volume (Units) Trend Analysis by Market Taxonomy, 2021-2025
- Current and Future Market Size (US$ Mn) and Volume (Units) Analysis & Forecast by Market Taxonomy, 2026-2036
- By Country
- China
- Japan
- South Korea
- By Taxonomy
- Market Attractiveness Analysis By Country & Taxonomy
- Market Trends
- Key Market Participants – Intensity Mapping
- Drivers and Restraints - Impact Analysis
- South Asia & Pacific Acoustic Mixer Market Analysis and Forecast
- Introduction / Key Findings
- Pricing Analysis
- Historical Market Size (US$ Mn) & Volume (Units) Trend Analysis by Market Taxonomy, 2021-2025
- Current and Future Market Size (US$ Mn) and Volume (Units) Analysis & Forecast by Market Taxonomy, 2026-2036
- By Country
- India
- ASEAN
- Australia & New Zealand
- Rest of South Asia & Pacific
- By Taxonomy
- Market Attractiveness Analysis By Country & Taxonomy
- Market Trends
- Key Market Participants – Intensity Mapping
- Drivers and Restraints - Impact Analysis
- Middle East & Africa Acoustic Mixer Market Analysis and Forecast
- Introduction / Key Findings
- Pricing Analysis
- Historical Market Size (US$ Mn) & Volume (Units) Trend Analysis by Market Taxonomy, 2021-2025
- Current and Future Market Size (US$ Mn) and Volume (Units) Analysis & Forecast by Market Taxonomy, 2026-2036
- By Country
- Kingdom of Saudi Arabia
- Other GCC Countries
- Turkiye
- South Africa
- Other African Union
- By Taxonomy
- Market Attractiveness Analysis By Country & Taxonomy
- Market Trends
- Key Market Participants – Intensity Mapping
- Drivers and Restraints - Impact Analysis
- Country-level Acoustic Mixer Market Analysis and Forecast
- Introduction
- Market Value Proportion Analysis, By Key Countries
- Global Vs. Country Growth Comparison
- United States Acoustic Mixer Market Analysis
- Market Size (US$ Mn) & Volume (Units) Analysis by Market Taxonomy, 2021–2036
- By Material Type
- By Capacity
- By End User
- By Product Type
- By Technology Type
- United States Acoustic Mixer Market Analysis
-
-
- Canada Acoustic Mixer Market Analysis
- Mexico Acoustic Mixer Market Analysis
- Brazil Acoustic Mixer Market Analysis
- Chile Acoustic Mixer Market Analysis
- Germany Acoustic Mixer Market Analysis
- France Acoustic Mixer Market Analysis
- Italy Acoustic Mixer Market Analysis
- Spain Acoustic Mixer Market Analysis
- United Kingdom Acoustic Mixer Market Analysis
- BENELUX Acoustic Mixer Market Analysis
- Nordics Acoustic Mixer Market Analysis
- Poland Acoustic Mixer Market Analysis
- Russia Acoustic Mixer Market Analysis
- Hungary Acoustic Mixer Market Analysis
- Balkan & Baltics Acoustic Mixer Market Analysis
- China Acoustic Mixer Market Analysis
- Japan Acoustic Mixer Market Analysis
- South Korea Acoustic Mixer Market Analysis
- India Acoustic Mixer Market Analysis
- ASEAN Acoustic Mixer Market Analysis
- ANZ Acoustic Mixer Market Analysis
- KSA Acoustic Mixer Market Analysis
- Other GCC Countries Acoustic Mixer Market Analysis
- South Africa Acoustic Mixer Market Analysis
- Turkiye Acoustic Mixer Market Analysis
-
- Acoustic Mixer Market Structure Analysis
- Market Analysis by Tier of Companies
- Market Concentration
- Market Share Analysis of Top Players
- Market Space for New Brands and Dollar Opportunity
- Market Presence Analysis
- Regional Footprint of Players
- Product Footprint by Players
- Acoustic Mixer Competition Analysis
- Competition Dashboard
- Pricing Analysis by Competition
- Competition Benchmarking
- Competition Deep Dive
- Resodyn Acoustic Mixers, Inc.
- Overview
- Product Portfolio
- Sales Footprint
- Key Developments
- SWOT Analysis
- Strategy Overview
- Key Financials
- Montana Mixers
- Zhengzhou Abrasive and Grinding Co Ltd.
- PCCA
- Eirich
- Hosokawa Micron B.V.
- Other Prominent Players
- Resodyn Acoustic Mixers, Inc.
- Primary insights
- Assumptions & Acronyms Used
- Research Methodology & Data Forms
List Of Table
- Table 1: Global Market Value (USD Mn) Forecast by Region, 2021 to 2036
- Table 2: Global Market Volume (Units) Forecast by Region, 2021 to 2036
- Table 3: Global Market Value (USD Mn) Forecast by Product Type, 2021 to 2036
- Table 4: Global Market Volume (Units) Forecast by Product Type, 2021 to 2036
- Table 5: Global Market Value (USD Mn) Forecast by Capacity, 2021 to 2036
- Table 6: Global Market Volume (Units) Forecast by Capacity, 2021 to 2036
- Table 7: Global Market Value (USD Mn) Forecast by Material Type, 2021 to 2036
- Table 8: Global Market Volume (Units) Forecast by Material Type, 2021 to 2036
- Table 9: Global Market Value (USD Mn) Forecast by End User, 2021 to 2036
- Table 10: Global Market Volume (Units) Forecast by End User, 2021 to 2036
- Table 11: Global Market Value (USD Mn) Forecast by Technology Type, 2021 to 2036
- Table 12: Global Market Volume (Units) Forecast by Technology Type, 2021 to 2036
- Table 13: North America Market Value (USD Mn) Forecast by Country, 2021 to 2036
- Table 14: North America Market Volume (Units) Forecast by Country, 2021 to 2036
- Table 15: North America Market Value (USD Mn) Forecast by Product Type, 2021 to 2036
- Table 16: North America Market Volume (Units) Forecast by Product Type, 2021 to 2036
- Table 17: North America Market Value (USD Mn) Forecast by Capacity, 2021 to 2036
- Table 18: North America Market Volume (Units) Forecast by Capacity, 2021 to 2036
- Table 19: North America Market Value (USD Mn) Forecast by Material Type, 2021 to 2036
- Table 20: North America Market Volume (Units) Forecast by Material Type, 2021 to 2036
- Table 21: North America Market Value (USD Mn) Forecast by End User, 2021 to 2036
- Table 22: North America Market Volume (Units) Forecast by End User, 2021 to 2036
- Table 23: North America Market Value (USD Mn) Forecast by Technology Type, 2021 to 2036
- Table 24: North America Market Volume (Units) Forecast by Technology Type, 2021 to 2036
- Table 25: Latin America Market Value (USD Mn) Forecast by Country, 2021 to 2036
- Table 26: Latin America Market Volume (Units) Forecast by Country, 2021 to 2036
- Table 27: Latin America Market Value (USD Mn) Forecast by Product Type, 2021 to 2036
- Table 28: Latin America Market Volume (Units) Forecast by Product Type, 2021 to 2036
- Table 29: Latin America Market Value (USD Mn) Forecast by Capacity, 2021 to 2036
- Table 30: Latin America Market Volume (Units) Forecast by Capacity, 2021 to 2036
- Table 31: Latin America Market Value (USD Mn) Forecast by Material Type, 2021 to 2036
- Table 32: Latin America Market Volume (Units) Forecast by Material Type, 2021 to 2036
- Table 33: Latin America Market Value (USD Mn) Forecast by End User, 2021 to 2036
- Table 34: Latin America Market Volume (Units) Forecast by End User, 2021 to 2036
- Table 35: Latin America Market Value (USD Mn) Forecast by Technology Type, 2021 to 2036
- Table 36: Latin America Market Volume (Units) Forecast by Technology Type, 2021 to 2036
- Table 37: Western Europe Market Value (USD Mn) Forecast by Country, 2021 to 2036
- Table 38: Western Europe Market Volume (Units) Forecast by Country, 2021 to 2036
- Table 39: Western Europe Market Value (USD Mn) Forecast by Product Type, 2021 to 2036
- Table 40: Western Europe Market Volume (Units) Forecast by Product Type, 2021 to 2036
- Table 41: Western Europe Market Value (USD Mn) Forecast by Capacity, 2021 to 2036
- Table 42: Western Europe Market Volume (Units) Forecast by Capacity, 2021 to 2036
- Table 43: Western Europe Market Value (USD Mn) Forecast by Material Type, 2021 to 2036
- Table 44: Western Europe Market Volume (Units) Forecast by Material Type, 2021 to 2036
- Table 45: Western Europe Market Value (USD Mn) Forecast by End User, 2021 to 2036
- Table 46: Western Europe Market Volume (Units) Forecast by End User, 2021 to 2036
- Table 47: Western Europe Market Value (USD Mn) Forecast by Technology Type, 2021 to 2036
- Table 48: Western Europe Market Volume (Units) Forecast by Technology Type, 2021 to 2036
- Table 49: Eastern Europe Market Value (USD Mn) Forecast by Country, 2021 to 2036
- Table 50: Eastern Europe Market Volume (Units) Forecast by Country, 2021 to 2036
- Table 51: Eastern Europe Market Value (USD Mn) Forecast by Product Type, 2021 to 2036
- Table 52: Eastern Europe Market Volume (Units) Forecast by Product Type, 2021 to 2036
- Table 53: Eastern Europe Market Value (USD Mn) Forecast by Capacity, 2021 to 2036
- Table 54: Eastern Europe Market Volume (Units) Forecast by Capacity, 2021 to 2036
- Table 55: Eastern Europe Market Value (USD Mn) Forecast by Material Type, 2021 to 2036
- Table 56: Eastern Europe Market Volume (Units) Forecast by Material Type, 2021 to 2036
- Table 57: Eastern Europe Market Value (USD Mn) Forecast by End User, 2021 to 2036
- Table 58: Eastern Europe Market Volume (Units) Forecast by End User, 2021 to 2036
- Table 59: Eastern Europe Market Value (USD Mn) Forecast by Technology Type, 2021 to 2036
- Table 60: Eastern Europe Market Volume (Units) Forecast by Technology Type, 2021 to 2036
- Table 61: East Asia Market Value (USD Mn) Forecast by Country, 2021 to 2036
- Table 62: East Asia Market Volume (Units) Forecast by Country, 2021 to 2036
- Table 63: East Asia Market Value (USD Mn) Forecast by Product Type, 2021 to 2036
- Table 64: East Asia Market Volume (Units) Forecast by Product Type, 2021 to 2036
- Table 65: East Asia Market Value (USD Mn) Forecast by Capacity, 2021 to 2036
- Table 66: East Asia Market Volume (Units) Forecast by Capacity, 2021 to 2036
- Table 67: East Asia Market Value (USD Mn) Forecast by Material Type, 2021 to 2036
- Table 68: East Asia Market Volume (Units) Forecast by Material Type, 2021 to 2036
- Table 69: East Asia Market Value (USD Mn) Forecast by End User, 2021 to 2036
- Table 70: East Asia Market Volume (Units) Forecast by End User, 2021 to 2036
- Table 71: East Asia Market Value (USD Mn) Forecast by Technology Type, 2021 to 2036
- Table 72: East Asia Market Volume (Units) Forecast by Technology Type, 2021 to 2036
- Table 73: South Asia and Pacific Market Value (USD Mn) Forecast by Country, 2021 to 2036
- Table 74: South Asia and Pacific Market Volume (Units) Forecast by Country, 2021 to 2036
- Table 75: South Asia and Pacific Market Value (USD Mn) Forecast by Product Type, 2021 to 2036
- Table 76: South Asia and Pacific Market Volume (Units) Forecast by Product Type, 2021 to 2036
- Table 77: South Asia and Pacific Market Value (USD Mn) Forecast by Capacity, 2021 to 2036
- Table 78: South Asia and Pacific Market Volume (Units) Forecast by Capacity, 2021 to 2036
- Table 79: South Asia and Pacific Market Value (USD Mn) Forecast by Material Type, 2021 to 2036
- Table 80: South Asia and Pacific Market Volume (Units) Forecast by Material Type, 2021 to 2036
- Table 81: South Asia and Pacific Market Value (USD Mn) Forecast by End User, 2021 to 2036
- Table 82: South Asia and Pacific Market Volume (Units) Forecast by End User, 2021 to 2036
- Table 83: South Asia and Pacific Market Value (USD Mn) Forecast by Technology Type, 2021 to 2036
- Table 84: South Asia and Pacific Market Volume (Units) Forecast by Technology Type, 2021 to 2036
- Table 85: Middle East & Africa Market Value (USD Mn) Forecast by Country, 2021 to 2036
- Table 86: Middle East & Africa Market Volume (Units) Forecast by Country, 2021 to 2036
- Table 87: Middle East & Africa Market Value (USD Mn) Forecast by Product Type, 2021 to 2036
- Table 88: Middle East & Africa Market Volume (Units) Forecast by Product Type, 2021 to 2036
- Table 89: Middle East & Africa Market Value (USD Mn) Forecast by Capacity, 2021 to 2036
- Table 90: Middle East & Africa Market Volume (Units) Forecast by Capacity, 2021 to 2036
- Table 91: Middle East & Africa Market Value (USD Mn) Forecast by Material Type, 2021 to 2036
- Table 92: Middle East & Africa Market Volume (Units) Forecast by Material Type, 2021 to 2036
- Table 93: Middle East & Africa Market Value (USD Mn) Forecast by End User, 2021 to 2036
- Table 94: Middle East & Africa Market Volume (Units) Forecast by End User, 2021 to 2036
- Table 95: Middle East & Africa Market Value (USD Mn) Forecast by Technology Type, 2021 to 2036
- Table 96: Middle East & Africa Market Volume (Units) Forecast by Technology Type, 2021 to 2036
List Of Figures
- Figure 1: Global Market Volume (Units) Forecast 2021–2036
- Figure 2: Global Market Pricing Analysis
- Figure 3: Global Market Value (USD Mn) Forecast 2021–2036
- Figure 4: Global Market Value Share and BPS Analysis by Product Type, 2026 and 2036
- Figure 5: Global Market Y-o-Y Growth Comparison by Product Type, 2026 to 2036
- Figure 6: Global Market Attractiveness Analysis by Product Type
- Figure 7: Global Market Value Share and BPS Analysis by Capacity, 2026 and 2036
- Figure 8: Global Market Y-o-Y Growth Comparison by Capacity, 2026 to 2036
- Figure 9: Global Market Attractiveness Analysis by Capacity
- Figure 10: Global Market Value Share and BPS Analysis by Material Type, 2026 and 2036
- Figure 11: Global Market Y-o-Y Growth Comparison by Material Type, 2026 to 2036
- Figure 12: Global Market Attractiveness Analysis by Material Type
- Figure 13: Global Market Value Share and BPS Analysis by End User, 2026 and 2036
- Figure 14: Global Market Y-o-Y Growth Comparison by End User, 2026 to 2036
- Figure 15: Global Market Attractiveness Analysis by End User
- Figure 16: Global Market Value Share and BPS Analysis by Technology Type, 2026 and 2036
- Figure 17: Global Market Y-o-Y Growth Comparison by Technology Type, 2026 to 2036
- Figure 18: Global Market Attractiveness Analysis by Technology Type
- Figure 19: Global Market Value (USD Mn) Share and BPS Analysis by Region, 2026 and 2036
- Figure 20: Global Market Y-o-Y Growth Comparison by Region, 2026 to 2036
- Figure 21: Global Market Attractiveness Analysis by Region
- Figure 22: North America Market Incremental $ Opportunity, 2026 to 2036
- Figure 23: Latin America Market Incremental $ Opportunity, 2026 to 2036
- Figure 24: Western Europe Market Incremental $ Opportunity, 2026 to 2036
- Figure 25: Eastern Europe Market Incremental $ Opportunity, 2026 to 2036
- Figure 26: East Asia Market Incremental $ Opportunity, 2026 to 2036
- Figure 27: South Asia and Pacific Market Incremental $ Opportunity, 2026 to 2036
- Figure 28: Middle East & Africa Market Incremental $ Opportunity, 2026 to 2036
- Figure 29: North America Market Value Share and BPS Analysis by Country, 2026 and 2036
- Figure 30: North America Market Value Share and BPS Analysis by Product Type, 2026 and 2036
- Figure 31: North America Market Y-o-Y Growth Comparison by Product Type, 2026 to 2036
- Figure 32: North America Market Attractiveness Analysis by Product Type
- Figure 33: North America Market Value Share and BPS Analysis by Capacity, 2026 and 2036
- Figure 34: North America Market Y-o-Y Growth Comparison by Capacity, 2026 to 2036
- Figure 35: North America Market Attractiveness Analysis by Capacity
- Figure 36: North America Market Value Share and BPS Analysis by Material Type, 2026 and 2036
- Figure 37: North America Market Y-o-Y Growth Comparison by Material Type, 2026 to 2036
- Figure 38: North America Market Attractiveness Analysis by Material Type
- Figure 39: North America Market Value Share and BPS Analysis by End User, 2026 and 2036
- Figure 40: North America Market Y-o-Y Growth Comparison by End User, 2026 to 2036
- Figure 41: North America Market Attractiveness Analysis by End User
- Figure 42: North America Market Value Share and BPS Analysis by Technology Type, 2026 and 2036
- Figure 43: North America Market Y-o-Y Growth Comparison by Technology Type, 2026 to 2036
- Figure 44: North America Market Attractiveness Analysis by Technology Type
- Figure 45: Latin America Market Value Share and BPS Analysis by Country, 2026 and 2036
- Figure 46: Latin America Market Value Share and BPS Analysis by Product Type, 2026 and 2036
- Figure 47: Latin America Market Y-o-Y Growth Comparison by Product Type, 2026 to 2036
- Figure 48: Latin America Market Attractiveness Analysis by Product Type
- Figure 49: Latin America Market Value Share and BPS Analysis by Capacity, 2026 and 2036
- Figure 50: Latin America Market Y-o-Y Growth Comparison by Capacity, 2026 to 2036
- Figure 51: Latin America Market Attractiveness Analysis by Capacity
- Figure 52: Latin America Market Value Share and BPS Analysis by Material Type, 2026 and 2036
- Figure 53: Latin America Market Y-o-Y Growth Comparison by Material Type, 2026 to 2036
- Figure 54: Latin America Market Attractiveness Analysis by Material Type
- Figure 55: Latin America Market Value Share and BPS Analysis by End User, 2026 and 2036
- Figure 56: Latin America Market Y-o-Y Growth Comparison by End User, 2026 to 2036
- Figure 57: Latin America Market Attractiveness Analysis by End User
- Figure 58: Latin America Market Value Share and BPS Analysis by Technology Type, 2026 and 2036
- Figure 59: Latin America Market Y-o-Y Growth Comparison by Technology Type, 2026 to 2036
- Figure 60: Latin America Market Attractiveness Analysis by Technology Type
- Figure 61: Western Europe Market Value Share and BPS Analysis by Country, 2026 and 2036
- Figure 62: Western Europe Market Value Share and BPS Analysis by Product Type, 2026 and 2036
- Figure 63: Western Europe Market Y-o-Y Growth Comparison by Product Type, 2026 to 2036
- Figure 64: Western Europe Market Attractiveness Analysis by Product Type
- Figure 65: Western Europe Market Value Share and BPS Analysis by Capacity, 2026 and 2036
- Figure 66: Western Europe Market Y-o-Y Growth Comparison by Capacity, 2026 to 2036
- Figure 67: Western Europe Market Attractiveness Analysis by Capacity
- Figure 68: Western Europe Market Value Share and BPS Analysis by Material Type, 2026 and 2036
- Figure 69: Western Europe Market Y-o-Y Growth Comparison by Material Type, 2026 to 2036
- Figure 70: Western Europe Market Attractiveness Analysis by Material Type
- Figure 71: Western Europe Market Value Share and BPS Analysis by End User, 2026 and 2036
- Figure 72: Western Europe Market Y-o-Y Growth Comparison by End User, 2026 to 2036
- Figure 73: Western Europe Market Attractiveness Analysis by End User
- Figure 74: Western Europe Market Value Share and BPS Analysis by Technology Type, 2026 and 2036
- Figure 75: Western Europe Market Y-o-Y Growth Comparison by Technology Type, 2026 to 2036
- Figure 76: Western Europe Market Attractiveness Analysis by Technology Type
- Figure 77: Eastern Europe Market Value Share and BPS Analysis by Country, 2026 and 2036
- Figure 78: Eastern Europe Market Value Share and BPS Analysis by Product Type, 2026 and 2036
- Figure 79: Eastern Europe Market Y-o-Y Growth Comparison by Product Type, 2026 to 2036
- Figure 80: Eastern Europe Market Attractiveness Analysis by Product Type
- Figure 81: Eastern Europe Market Value Share and BPS Analysis by Capacity, 2026 and 2036
- Figure 82: Eastern Europe Market Y-o-Y Growth Comparison by Capacity, 2026 to 2036
- Figure 83: Eastern Europe Market Attractiveness Analysis by Capacity
- Figure 84: Eastern Europe Market Value Share and BPS Analysis by Material Type, 2026 and 2036
- Figure 85: Eastern Europe Market Y-o-Y Growth Comparison by Material Type, 2026 to 2036
- Figure 86: Eastern Europe Market Attractiveness Analysis by Material Type
- Figure 87: Eastern Europe Market Value Share and BPS Analysis by End User, 2026 and 2036
- Figure 88: Eastern Europe Market Y-o-Y Growth Comparison by End User, 2026 to 2036
- Figure 89: Eastern Europe Market Attractiveness Analysis by End User
- Figure 90: Eastern Europe Market Value Share and BPS Analysis by Technology Type, 2026 and 2036
- Figure 91: Eastern Europe Market Y-o-Y Growth Comparison by Technology Type, 2026 to 2036
- Figure 92: Eastern Europe Market Attractiveness Analysis by Technology Type
- Figure 93: East Asia Market Value Share and BPS Analysis by Country, 2026 and 2036
- Figure 94: East Asia Market Value Share and BPS Analysis by Product Type, 2026 and 2036
- Figure 95: East Asia Market Y-o-Y Growth Comparison by Product Type, 2026 to 2036
- Figure 96: East Asia Market Attractiveness Analysis by Product Type
- Figure 97: East Asia Market Value Share and BPS Analysis by Capacity, 2026 and 2036
- Figure 98: East Asia Market Y-o-Y Growth Comparison by Capacity, 2026 to 2036
- Figure 99: East Asia Market Attractiveness Analysis by Capacity
- Figure 100: East Asia Market Value Share and BPS Analysis by Material Type, 2026 and 2036
- Figure 101: East Asia Market Y-o-Y Growth Comparison by Material Type, 2026 to 2036
- Figure 102: East Asia Market Attractiveness Analysis by Material Type
- Figure 103: East Asia Market Value Share and BPS Analysis by End User, 2026 and 2036
- Figure 104: East Asia Market Y-o-Y Growth Comparison by End User, 2026 to 2036
- Figure 105: East Asia Market Attractiveness Analysis by End User
- Figure 106: East Asia Market Value Share and BPS Analysis by Technology Type, 2026 and 2036
- Figure 107: East Asia Market Y-o-Y Growth Comparison by Technology Type, 2026 to 2036
- Figure 108: East Asia Market Attractiveness Analysis by Technology Type
- Figure 109: South Asia and Pacific Market Value Share and BPS Analysis by Country, 2026 and 2036
- Figure 110: South Asia and Pacific Market Value Share and BPS Analysis by Product Type, 2026 and 2036
- Figure 111: South Asia and Pacific Market Y-o-Y Growth Comparison by Product Type, 2026 to 2036
- Figure 112: South Asia and Pacific Market Attractiveness Analysis by Product Type
- Figure 113: South Asia and Pacific Market Value Share and BPS Analysis by Capacity, 2026 and 2036
- Figure 114: South Asia and Pacific Market Y-o-Y Growth Comparison by Capacity, 2026 to 2036
- Figure 115: South Asia and Pacific Market Attractiveness Analysis by Capacity
- Figure 116: South Asia and Pacific Market Value Share and BPS Analysis by Material Type, 2026 and 2036
- Figure 117: South Asia and Pacific Market Y-o-Y Growth Comparison by Material Type, 2026 to 2036
- Figure 118: South Asia and Pacific Market Attractiveness Analysis by Material Type
- Figure 119: South Asia and Pacific Market Value Share and BPS Analysis by End User, 2026 and 2036
- Figure 120: South Asia and Pacific Market Y-o-Y Growth Comparison by End User, 2026 to 2036
- Figure 121: South Asia and Pacific Market Attractiveness Analysis by End User
- Figure 122: South Asia and Pacific Market Value Share and BPS Analysis by Technology Type, 2026 and 2036
- Figure 123: South Asia and Pacific Market Y-o-Y Growth Comparison by Technology Type, 2026 to 2036
- Figure 124: South Asia and Pacific Market Attractiveness Analysis by Technology Type
- Figure 125: Middle East & Africa Market Value Share and BPS Analysis by Country, 2026 and 2036
- Figure 126: Middle East & Africa Market Value Share and BPS Analysis by Product Type, 2026 and 2036
- Figure 127: Middle East & Africa Market Y-o-Y Growth Comparison by Product Type, 2026 to 2036
- Figure 128: Middle East & Africa Market Attractiveness Analysis by Product Type
- Figure 129: Middle East & Africa Market Value Share and BPS Analysis by Capacity, 2026 and 2036
- Figure 130: Middle East & Africa Market Y-o-Y Growth Comparison by Capacity, 2026 to 2036
- Figure 131: Middle East & Africa Market Attractiveness Analysis by Capacity
- Figure 132: Middle East & Africa Market Value Share and BPS Analysis by Material Type, 2026 and 2036
- Figure 133: Middle East & Africa Market Y-o-Y Growth Comparison by Material Type, 2026 to 2036
- Figure 134: Middle East & Africa Market Attractiveness Analysis by Material Type
- Figure 135: Middle East & Africa Market Value Share and BPS Analysis by End User, 2026 and 2036
- Figure 136: Middle East & Africa Market Y-o-Y Growth Comparison by End User, 2026 to 2036
- Figure 137: Middle East & Africa Market Attractiveness Analysis by End User
- Figure 138: Middle East & Africa Market Value Share and BPS Analysis by Technology Type, 2026 and 2036
- Figure 139: Middle East & Africa Market Y-o-Y Growth Comparison by Technology Type, 2026 to 2036
- Figure 140: Middle East & Africa Market Attractiveness Analysis by Technology Type
- Figure 141: Global Market – Tier Structure Analysis
- Figure 142: Global Market – Company Share Analysis