- Market Value (2025): USD 6.0 Bn
- Estimated Value (2026): USD 6.9 Bn
- Forecast Value (2036): USD 27.6 Bn
- CAGR (2026-2036): 14.9%
What is the Dense Power Distribution Market forecast to be worth by 2036?
USD 6.9 billion in 2026 to USD 27.6 billion by 2036 at a 14.9% CAGR.
- The Dense Power Distribution Market reached USD 6.0 billion in 2025.
- Demand is projected to increase from USD 6.9 billion in 2026 to USD 27.6 billion by 2036.
- The market is forecast to record 14.9% CAGR from 2026 to 2036 as AI rack density, repeatable campus construction and the transition toward higher-voltage DC architectures raise the value of every distribution layer between switchgear and compute.
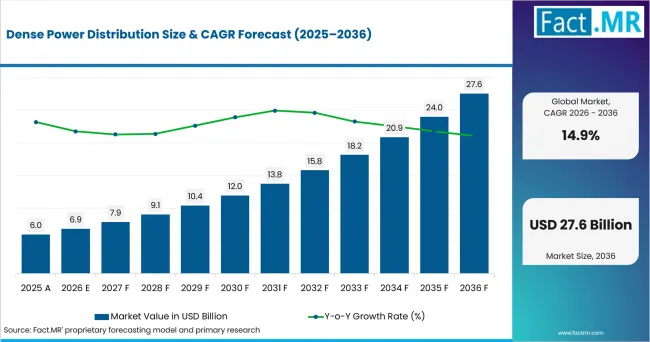
Dense Power Distribution Value Analysis | Source: Fact.MR
What are the defining numbers behind Dense Power Distribution Market growth?
An absolute opportunity of USD 20.7 billion is expected between 2026 and 2036.
- Demand Drivers in the Market
- AI campuses need electrical systems that scale faster than traditional room-by-room builds. Lawrence Berkeley National Laboratory projected U.S. data-center electricity use could rise to 325-580 TWh by 2028.
- Rack power is moving beyond the practical envelope of familiar AC layouts. Vertiv stated in May 2025 that 800 VDC is intended for AI environments scaling beyond 300 kW per rack.
- Capacity-constrained markets are tying new megawatts to efficiency. Singapore's Green Data Centre Roadmap targets at least 300 MW of additional near-term capacity alongside stronger operating standards.
- Key Segments Analyzed
- High-density busway accounts for 31.0% of Distribution Architecture demand in 2026. High-density busway leads because it moves large currents overhead while letting operators add or relocate tap-off points as rack plans change.
- 48 VDC represents 27.0% of the 2026 Voltage Architecture mix. 48 VDC holds the largest 2026 share because it already supports rack-level power shelves and reduces current relative to legacy board voltages without requiring a facility-wide high-voltage DC redesign.
- AI data centers make up 39.0% of End-use demand in 2026. AI data centers dominate because accelerated computing concentrates load and introduces rapid step changes in power draw.
- The 100-250 kW band captures 29.0% of Density Metric demand in 2026. The 100-250 kW per rack band leads as it captures near-term accelerator deployments that exceed conventional enterprise density but remain below the megawatt-scale architectures planned for later systems.
- Analyst Opinion at Fact.MR
- Shambhu Nath Jha, Principal Consultant at Fact.MR, states, "Dense power distribution is becoming a layout and commissioning problem, not only a component sale. Suppliers need to show how busway, protection, conversion and controls behave under fast AI load changes. The strongest positions will belong to vendors that can support today's AC estate while giving operators a credible path to rack-level and high-voltage DC."
- Strategic Implications
- Power vendors should offer migration architectures that preserve useful AC infrastructure while placing conversion closer to compute. Vertiv's 800 VDC roadmap includes centralized rectifiers, DC busway and rack-level DC-DC conversion planned for release in the second half of 2026.
- Switchgear and busway suppliers should design around repeatable capacity blocks. ABB's November 2025 agreement for a 300 MW expansion at Applied Digital's North Dakota campus illustrates demand for scalable medium- and low-voltage systems.
- Operators should procure monitoring and protection with the conductor system instead of adding visibility after energization. This approach improves load balancing, commissioning evidence and change control as rack densities diverge within one hall.
Singapore is projected at 17.8% CAGR through 2036, supported by limited land and power allocations that reward compact, monitored distribution. AI-campus construction supports 16.8% in the USA, while clustered compute programs underpin 16.1% in the UK. The UAE reaches 14.6% as utility and cooling coordination accompanies large facilities; Germany records 11.2% under a stricter efficiency-led approval environment.
How does the Dense Power Distribution Market break down by segment?
Distribution Architecture: High-density busway (31.0%); Voltage Architecture: 48 VDC (27.0%); End-use: AI data centers (39.0%); Density Metric: 100-250 kW (29.0%).
Which Distribution Architecture leads?
High-density busway: 31.0% share in 2026.
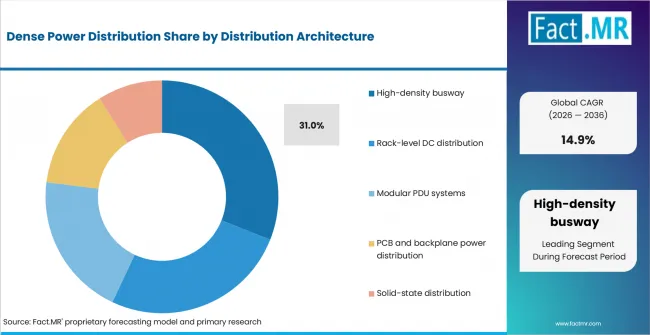
Dense Power Distribution Analysis By Distribution Architecture | Source: Fact.MR
High-density busway leads because it moves large currents overhead while letting operators add or relocate tap-off points as rack plans change. The architecture shortens installation work and preserves access compared with fixed cable bundles.
Why does 48 VDC lead Voltage Architecture?
48 VDC: 27.0% share in 2026.
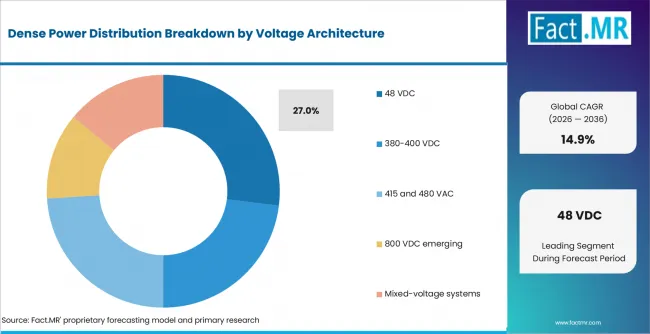
Dense Power Distribution Analysis By Voltage Architecture | Source: Fact.MR
48 VDC holds the largest 2026 share because it already supports rack-level power shelves and reduces current relative to legacy board voltages without requiring a facility-wide high-voltage DC redesign. It gives operators a practical bridge between AC rooms and DC compute.
Which End-use concentrates demand?
AI data centers: 39.0% share in 2026.
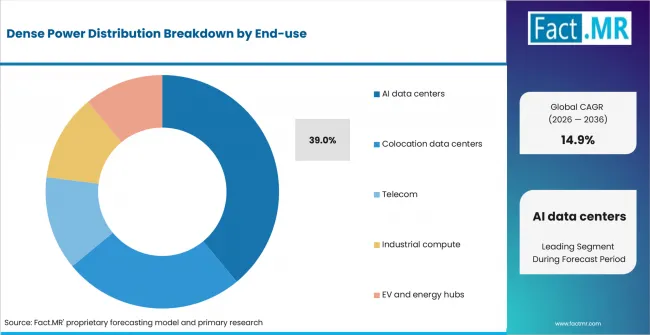
Dense Power Distribution Analysis By End Use | Source: Fact.MR
AI data centers dominate because accelerated computing concentrates load and introduces rapid step changes in power draw. Operators need distribution, protection and monitoring that can be commissioned as one system with the cooling plant.
What makes 100-250 kW per rack the leading Density Metric?
100-250 kW: 29.0% share in 2026.
The 100-250 kW per rack band leads as it captures near-term accelerator deployments that exceed conventional enterprise density but remain below the megawatt-scale architectures planned for later systems. It is the main conversion zone for busway and rack-level DC investment.
What is accelerating Dense Power Distribution Market adoption, and what is holding it back?
Adoption is rising as rack densities outgrow cable-heavy layouts and new AI campuses demand modular electrical blocks. Grid queues, protection coordination and uncertainty around the timing of 800 VDC equipment slow a universal architecture shift.
Drivers Impact Analysis
| DRIVER | (~) % IMPACT ON CAGR | GEOGRAPHIC RELEVANCE | IMPACT TIMELINE |
|---|---|---|---|
| AI rack-density escalation | +2.2% | USA, UK, Singapore, UAE | Short term (<= 2 years) |
| Busway-led modular construction | +1.6% | Global | Medium term (2-4 years) |
| Higher-voltage DC transition | +1.3% | North America, East Asia, Europe | Medium term (2-4 years) |
| Facility-level power monitoring | +0.8% | Global | Long term (>= 4 years) |
Source: Fact.MR analysis. Updated Sep 8, 2026
- AI rack-density escalation: Accelerator clusters increase conductor, protection and conversion requirements per rack, lifting distribution value faster than floor area.
- Busway-led modular construction: Overhead busway and plug-in tap-offs allow phased halls to change rack layouts without rebuilding fixed cable routes.
- Higher-voltage DC transition: Reducing current and conversion stages becomes more valuable as pod power moves from hundreds of kilowatts toward megawatt scale.
Opportunity Impact Analysis
| OPPORTUNITY | (~) % IMPACT ON CAGR | GEOGRAPHIC RELEVANCE | IMPACT TIMELINE |
|---|---|---|---|
| Hybrid AC and DC retrofit zones | +1.3% | USA, UK, Germany | Short term (<= 2 years) |
| Prefabricated power rooms and skids | +1.1% | USA, UAE, Singapore | Medium term (2-4 years) |
| Solid-state protection for fast load steps | +0.7% | Global | Long term (>= 4 years) |
Source: Fact.MR analysis. Updated Sep 8, 2026
- Hybrid AC and DC retrofit zones: Operators can introduce rack-level DC in selected AI pods while retaining upstream AC assets, reducing the risk of a full-site conversion.
- Prefabricated power rooms and skids: Factory-tested assemblies shorten onsite work and give campus developers a repeatable unit for phased capacity.
- Solid-state protection for fast load steps: Faster switching and richer telemetry can support accelerator loads that change more abruptly than conventional server fleets.
Restraints Impact Analysis
| RESTRAINT | (~) % IMPACT ON CAGR | GEOGRAPHIC RELEVANCE | IMPACT TIMELINE |
|---|---|---|---|
| Grid-connection and transformer delays | -1.0% | USA, UK, Germany | Short term (<= 2 years) |
| Protection and grounding redesign | -0.7% | Global | Medium term (2-4 years) |
| Unsettled 800 VDC interoperability | -0.5% | North America, Europe, East Asia | Long term (>= 4 years) |
Source: Fact.MR analysis. Updated Sep 8, 2026
- Grid-connection and transformer delays: Distribution equipment may be ordered in stages, but an unavailable utility service can push the full electrical package to a later phase.
- Protection and grounding redesign: Higher DC voltages require coordinated fault detection, isolation, maintenance practice and safety documentation.
- Unsettled 800 VDC interoperability: Buyers need confidence that rectifiers, busway, converters and backup systems from different suppliers will operate as a tested chain.
Which countries are scaling the Dense Power Distribution Market through 2036?
- Singapore turns capacity scarcity into a premium for smaller electrical footprints and measurable efficiency.
- The USA supplies the broadest project funnel, from phased colocation halls to purpose-built AI factories.
- The UK's growth is concentrated around designated zones where planning and grid coordination can unlock high-density clusters.
- The UAE creates large project tickets, but hot-climate performance raises the value of integrated power and thermal engineering.
- Germany's market rewards loss reduction and metering proof, keeping adoption disciplined even as compute demand rises.
Grid access, site density, voltage standards and facility-efficiency targets shape the country outlook. Beyond the five countries discussed above, coverage extends across North America, Latin America, Western Europe, Eastern Europe, East Asia, South Asia & Pacific, Middle East & Africa.
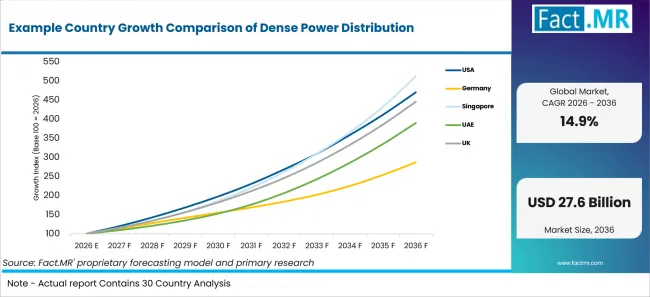
Example Country Growth Comparison Of Dense Power Distribution | Source: Fact.MR
| Country | CAGR (2026-2036) |
|---|---|
| USA | 16.8% |
| Germany | 11.2% |
| Singapore | 17.8% |
| UAE | 14.6% |
| UK | 16.1% |
Source: Fact.MR analysis. Updated Sep 8, 2026
What is changing the USA power chain?
16.8% CAGR, driven by AI campuses and a steep increase in facility electricity demand.
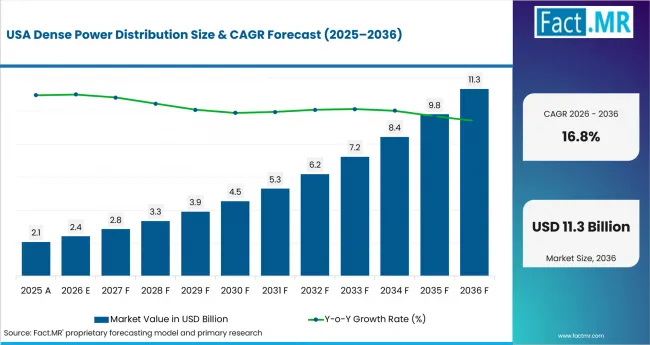
Dense Power Distribution Country Value Analysis | Source: Fact.MR
The USA pairs the largest visible AI campus pipeline with pressure to redesign the power path from utility service to GPU rack. Lawrence Berkeley National Laboratory estimated that data centers used 4.4% of U.S. electricity in 2023 and could reach 6.7% to 12.0% by 2028. Dense distribution spending follows projects that reduce conversion stages, compress electrical rooms and deploy capacity in repeatable blocks.
How does Germany balance density and efficiency?
11.2% CAGR, supported by industrial cloud demand and strict efficiency expectations.
Germany's market is shaped as much by operating discipline as by new megawatts. Federal economic authorities have highlighted rising data-center electricity demand, while new facilities face tighter efficiency and heat-reuse expectations. Buyers therefore scrutinize loss maps, metering and serviceability before adopting higher-density busways or DC sections, producing a measured but durable upgrade cycle.
What is supporting Singapore's 17.8% CAGR through 2036?
17.8% CAGR, supported by capacity allocation under land and energy constraints.
Singapore must extract more computing value from each approved site and each unit of grid capacity. IMDA's Green Data Centre Roadmap identified at least 300 MW of additional near-term capacity and paired growth with an IT energy-efficiency standard. That combination favors monitored busway, compact electrical skids and higher-voltage architectures that release floor area for compute.
Where does the UAE create scale?
14.6% CAGR, linked to large AI facilities, utility coordination and hot-climate design.
The UAE is treating data-center power as a national infrastructure question rather than a room-level equipment purchase. The Ministry of Energy and Infrastructure formed a team in February 2025 to review the sector's energy impact, followed by an AI cooling pilot with Khazna announced in February 2026. Large campuses support centralized distribution, but high ambient temperatures make thermal coordination and redundancy design inseparable from conductor density.
What supports the UK's acceleration?
16.1% CAGR, supported by AI Growth Zones and public-private compute plans.
The UK is creating concentrated demand around AI Growth Zones, where grid access and planning coordination can support clusters of high-density halls. The government's AI Opportunities Action Plan response set an initial 100 MW public-private compute ambition with a path toward 500 MW. Distribution suppliers gain when designs can be repeated across phased halls without locking operators into one voltage path.
Who leads the Dense Power Distribution Market?
Vertiv, Schneider Electric, Eaton, ABB, Delta Electronics and Legrand.
Vertiv leads the architecture discussion through busway, rack power distribution, DC power and an announced 800 VDC portfolio. Its advantage is the ability to pair power conversion and distribution with cooling and lifecycle service for AI deployments.
Schneider Electric brings low-voltage distribution, busway, UPS, prefabricated modules and EcoStruxure monitoring. The company is positioned where customers want one engineering route from switchgear to rack and a consistent operations layer across sites.
Eaton competes through switchgear, busway, rack PDUs, UPS and Brightlayer monitoring. ABB is pushing medium-voltage and solid-state designs for large AI factories, including projects that shift portions of the critical power path upstream.
Delta Electronics and Legrand add strong conversion and rack-distribution portfolios. Delta is relevant where DC power shelves and thermal systems are co-designed, while Legrand participates through busway, cabinets and intelligent rack power.
Competitive advantage depends on fault-domain design, commissioning speed and a practical migration story. Product breadth matters only when components are tested together at the intended load step and redundancy level.
Which companies are the key providers?
Key companies include Vertiv; Schneider Electric; Eaton; ABB; Delta Electronics; Legrand.
- Vertiv
- Schneider Electric
- Eaton
- ABB
- Delta Electronics
- Legrand
Bibliography
- Lawrence Berkeley National Laboratory. (2024, December 20). 2024 United States Data Center Energy Usage Report.
- Infocomm Media Development Authority. (2024). Green Data Centre Roadmap.
- Infocomm Media Development Authority. (2025). SS 715:2025 Energy efficiency of data centre IT equipment.
- Department for Science, Innovation and Technology. (2025, January 13). AI Opportunities Action Plan: Government response.
- Department for Science, Innovation and Technology. (2025). Delivering AI Growth Zones.
- Federal Ministry for Economic Affairs and Energy, Germany. (2025). Energy efficiency and data-centre demand briefing.
- Ministry of Energy and Infrastructure, United Arab Emirates. (2025, February 3). National team reviews energy impact of data centers.
- Ministry of Energy and Infrastructure, United Arab Emirates. (2026, February 4). AI-enabled cooling pilot with Khazna Data Centers.
- Vertiv. (2025, May 19). Vertiv accelerates AI infrastructure evolution in alignment with NVIDIA 800 VDC power architecture announcement.
- ABB. (2025, November 13). ABB expands power technology partnership with Applied Digital for AI-ready data centers.
- ABB. (2025, October 13). ABB to develop next-generation AI data centers with NVIDIA.
This Report Answers
- The report explains how dense power distribution demand is distributed across Distribution Architecture, Voltage Architecture, End-use and Density Metric.
- Segment analysis identifies the 2026 leaders and explains their purchase logic: Distribution Architecture: High-density busway at 31.0%; Voltage Architecture: 48 VDC at 27.0%; End-use: AI data centers at 39.0%; Density Metric: 100-250 kW at 29.0%.
- Country analysis connects the USA, Germany, Singapore, UAE and UK to differences in grid access, site density, voltage standards and facility-efficiency targets.
- Competitive analysis reviews current positions for Vertiv, Schneider Electric, Eaton, ABB, Delta Electronics and Legrand.
- Application analysis tests AI rack-density escalation against the limiting effect of grid-connection and transformer delays.
What does the Dense Power Distribution Market cover?
High-current electrical distribution systems that deliver and control power from facility switchgear or conversion stages to dense compute racks, industrial compute clusters and other concentrated loads.
Adjacent Fact.MR coverage includes DC power distribution, DC distribution networks, and busbar trunking systems, which clarify neighboring demand pools without being counted in this market.
What is included in the scope?
The scope includes high-density busway, rack-level DC systems, modular power distribution units, PCB or backplane distribution assemblies and solid-state distribution sold for concentrated computing and energy loads. Associated protection, metering and control are included when packaged with the distribution system.
The boundary also considers critical power and cooling and data centers where those markets influence purchase timing but remain separately valued.
Coverage spans 48 VDC, 380-400 VDC, 415/480 VAC, mixed-voltage and emerging 800 VDC architectures. It assesses equipment supplied to AI and colocation data centers, telecom facilities, industrial compute sites and high-density EV or energy hubs.
What is excluded from the scope?
The scope excludes utility transmission, general building wiring, commodity cables and stand-alone transformers. UPS revenue is excluded when the unit is sold without an integrated dense-distribution function.
Server power supplies, semiconductor voltage regulators and cooling equipment are outside the value base unless bundled into a priced distribution assembly. Conventional low-density branch circuits are not counted.
How Was the Analysis Built?
The analysis draws on 120+ sources, 35+ company portfolios, 25+ countries, and more than 20 industry interviews.
- Primary Research: Interviews cover manufacturers, technology developers, integrators, channel partners, end users and subject-matter experts relevant to this market. Discussions test purchase triggers, specification tradeoffs, implementation barriers, supplier positioning and the conditions required for wider commercial adoption.
- Desk Research: Research covers government statistics, regulatory publications, standards, company announcements, technical studies, trade information and industry associations. Published claims used in the analysis are documented in the bibliography.
- Market Sizing and Forecasting: The model combines project electrical capacity, rack-density bands, architecture attach rates, equipment value per delivered kilowatt and retrofit turnover. Forecasting tests AI campus schedules, voltage migration, busway penetration, grid delays and country-specific efficiency requirements.
- Data Validation and Update Cycle: Findings are triangulated across interviews, public evidence, company activity, policy changes, trade patterns and implementation signals. Updates review product launches, capacity shifts, partnerships, approvals, procurement behavior and material changes in commercial adoption.
Segmentation
What is the report's scope and coverage?
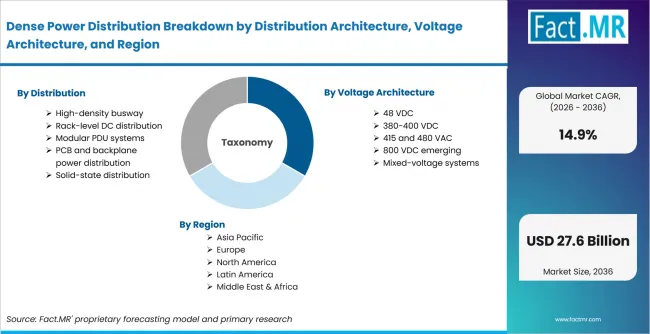
Dense Power Distribution Breakdown By Distribution Architecture, Voltage Architecture, And Region | Source: Fact.MR
| Attribute | Details |
|---|---|
| Quantitative Units | USD Billion |
| Market Definition | High-current electrical distribution systems that deliver and control power from facility switchgear or conversion stages to dense compute racks, industrial compute clusters and other concentrated loads. |
| Distribution Architecture | High-density busway; Rack-level DC distribution; Modular PDU systems; PCB and backplane power distribution; Solid-state distribution |
| Voltage Architecture | 48 VDC; 380-400 VDC; 415 and 480 VAC; 800 VDC emerging; Mixed-voltage systems |
| End-use | AI data centers; Colocation data centers; Telecom; Industrial compute; EV and energy hubs |
| Density Metric | <50 kW and rack; 50-100 kW; 100-250 kW; 250-500 kW; >500 kW |
| Regions Covered | North America; Latin America; Western Europe; Eastern Europe; East Asia; South Asia & Pacific; Middle East & Africa |
| Countries Covered | USA; Germany; Singapore; UAE; UK |
| Key Companies | Vertiv; Schneider Electric; Eaton; ABB; Delta Electronics; Legrand |
| Forecast Period | 2026 to 2036 |
| Approach | The model combines project electrical capacity, rack-density bands, architecture attach rates, equipment value per delivered kilowatt and retrofit turnover. Forecasting tests AI campus schedules, voltage migration, busway penetration, grid delays and country-specific efficiency requirements. |
Source: Fact.MR analysis. Updated Sep 8, 2026
How is the market segmented?
-
By Distribution Architecture
- High-density busway
- Rack-level DC distribution
- Modular PDU systems
- PCB and backplane power distribution
- Solid-state distribution
-
By Voltage Architecture
- 48 VDC
- 380-400 VDC
- 415 and 480 VAC
- 800 VDC emerging
- Mixed-voltage systems
-
By End-use
- AI data centers
- Colocation data centers
- Telecom
- Industrial compute
- EV and energy hubs
-
By Density Metric
- <50 kW and rack
- 50-100 kW
- 100-250 kW
- 250-500 kW
- >500 kW
-
By Region
- North America
- Latin America
- Western Europe
- Eastern Europe
- East Asia
- South Asia & Pacific
- Middle East & Africa
Frequently Asked Questions
How big is the dense power distribution market in 2026?
What is the CAGR of the dense power distribution market from 2026 to 2036?
What is the projected dense power distribution market size by 2036?
Which distribution architecture leads the dense power distribution market?
Which voltage architecture leads the dense power distribution market?
Which end-use leads the dense power distribution market?
Which density metric leads the dense power distribution market?
What is the principal growth driver for the dense power distribution market?
What is the main restraint on dense power distribution adoption?
Who are the leading companies in the dense power distribution market?
Who worked on this report


Preview the report firsthand - request a free sample
Free SampleGet the brochure for pricing and purchase details
Download PDF