- Market Value (2025): USD 100.8 Mn
- Estimated Value (2026): USD 130 Mn
- Forecast Value (2036): USD 1659 Mn
- CAGR (2026-2036): 29.0%
What is the Graphene Spoilage Sensors Market forecast to be worth by 2036?
USD 130 million in 2026 to USD 1,659 million by 2036 at a 29.0% CAGR.
- The graphene spoilage sensors market was valued at USD 100.8 million in 2025.
- Demand is projected to increase from USD 130 million in 2026 to USD 1659 million by 2036.
- The market is forecast to record a 29.0% CAGR from 2026 to 2036 as fresh-food processors and retailers test thinner freshness indicators.
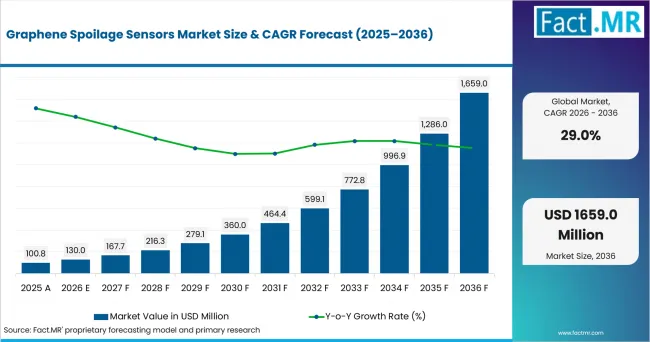
Graphene Spoilage Sensors Market Value Analysis | Source: Fact.MR
What are the defining numbers behind Graphene Spoilage Sensors Market growth?
USD 1,529 million absolute opportunity is expected between 2026 and 2036.
- Demand Drivers in the Market
- Meat and seafood processors need pack-level indicators that detect ammonia, amines and hydrogen sulfide before visual spoilage becomes clear.
- Fresh produce distributors need ethylene and humidity sensing on flexible labels so shipment checks move closer to each tray or carton.
- Retail quality teams need readable freshness signals that support date-code decisions without opening chilled packs or damaging product presentation.
- Label converters need conductive inks and coated electrodes that fit print lines while keeping sensor material loading low.
- Key Segments Analyzed
- By Analyte: Ammonia-amines are expected to hold 26.0% share in 2026 owing to their relevance in protein spoilage.
- By Sensor Format: Printed label is projected to account for 34.0% share in 2026 since it matches existing label-converting equipment.
- By Food Type: Meat-seafood is anticipated to represent 46.0% share in 2026 due to higher shrink risk in chilled protein chains.
- By Readout: Colorimetric-assisted is estimated to capture 33.0% share in 2026 since visual checks remain practical for store staff.
- Analyst Opinion at Fact.MR
- Shambhu Nath Jha, Principal Consultant at Fact.MR, states, "Graphene spoilage sensors are drawing attention as they turn hidden freshness loss into a visible or electronic signal. Adoption is expected to start where waste, returns and quality claims carry a direct cost. Suppliers should pair stable graphene materials with food-contact documentation and simple readout rules."
- Strategic Implications
- Graphene material suppliers should document dispersion quality, surface chemistry and batch repeatability for food-packaging trials.
- Label converters should test ink adhesion and sensor response after refrigeration, moisture exposure and normal pack handling.
- Food processors should compare sensor cost against shrink reduction and customer complaint handling.
- Retailers should define how staff read and act on sensor signals before scaling shelf-level pilots.
The USA is projected to record 34.4% CAGR through 2036 due to chilled protein volume and retail food spending. Germany is forecast to post 32.0% CAGR with meat processing and packaging know-how supporting controlled label trials. Japan is anticipated to advance at 30.7% CAGR supported by seafood exports and electronics capability. South Korea is estimated to hold 26.8% CAGR through fisheries output and export quality programs. The UK is expected to reach 21.0% CAGR with salmon and shellfish chains creating targeted use cases.
How does the Graphene Spoilage Sensors Market break down by segment?
Printed label leads Sensor Format at 34.0%; Meat-seafood leads Food Type at 46.0%.
Which Analyte segment leads?
Ammonia-amines hold 26.0% share in 2026.
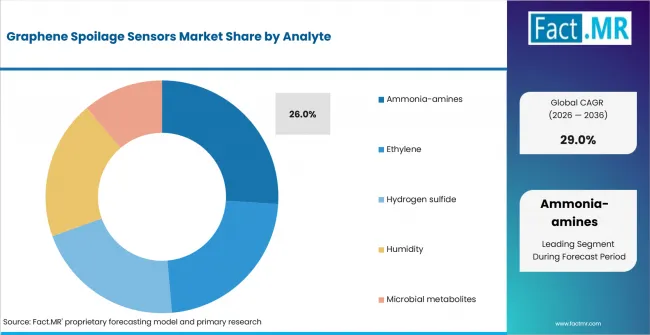
Graphene Spoilage Sensors Market Analysis By Analyte | Source: Fact.MR
Ammonia-amines lead analyte demand due to nitrogen compounds released by chilled meat and seafood. Functionalized graphene surfaces change electrical response when exposed to these gases.
Hydrogen sulfide and microbial metabolites remain relevant for seafood and prepared-food use cases. Ethylene and humidity support produce monitoring when pack type and product value justify the test.
What leads the Sensor Format segment?
Printed label accounts for 34.0% share in 2026.
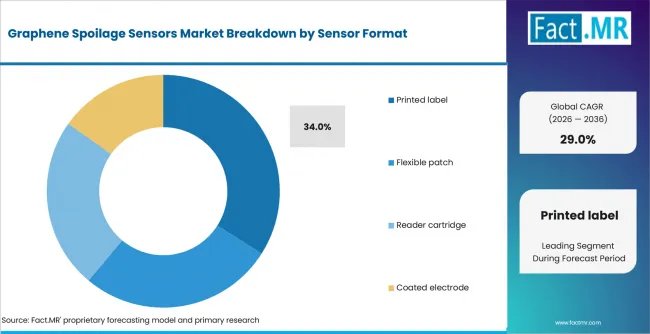
Graphene Spoilage Sensors Market Analysis By Sensor Format | Source: Fact.MR
Printed labels lead since they fit the commercial route familiar to food packaging users. A label carries graphene ink, a color layer or a simple electrode near existing date-marking workflows.
Flexible patches support higher-sensitivity tests where labels need closer contact with the pack atmosphere. Reader cartridges and coated electrodes suit logistics use where staff already operate handheld readers.
How does Food Type shape demand?
Meat-seafood represents 46.0% share in 2026.
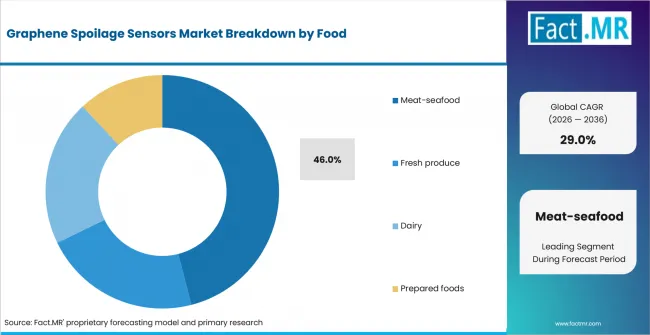
Graphene Spoilage Sensors Market Analysis By Food | Source: Fact.MR
Meat-seafood leads due to costly spoilage risk in chilled distribution. USDA NASS reported in May 2026 that U.S. commercial red meat production was 4,455.8 million pounds in April 2026.
Fresh produce uses ethylene and humidity indicators for ripening control. Dairy and prepared foods are more sensitive to pack format and food-contact documentation, so adoption is expected to move through narrower trials first.
What supports Colorimetric-assisted Readout?
Colorimetric-assisted readout captures 33.0% share in 2026.
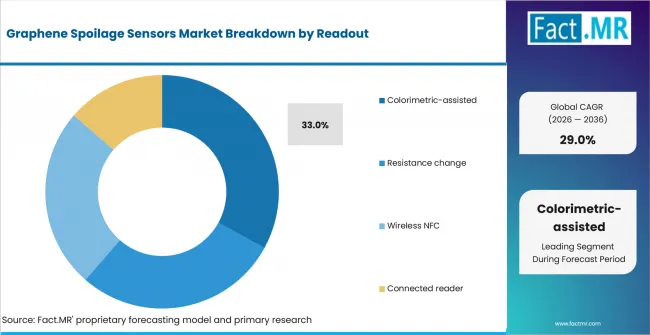
Graphene Spoilage Sensors Market Analysis By Readout | Source: Fact.MR
Colorimetric-assisted readout leads since visible changes are easier to interpret than raw electrical signals. Graphene layers support the sensing function while a color element clarifies the result.
Resistance-change and wireless NFC formats provide stronger traceability when logistics teams need digital records. Connected readers suit higher-value packs where recurring shrink or export checks justify more equipment.
What is accelerating Graphene Spoilage Sensors Market adoption, and what is holding it back?
Demand is expected to rise through food-waste pressure and printed-sensor progress. Adoption is constrained by food-contact review, signal validation and added label cost.
| DRIVER | (~) % IMPACT ON CAGR | GEOGRAPHIC RELEVANCE | IMPACT TIMELINE |
|---|---|---|---|
| Protein spoilage monitoring in chilled chains | +2.4% | North America, East Asia | Short term (<= 2 years) |
| Printed label compatibility for converters | +1.8% | Global | Medium term (2-4 years) |
| Retail food-waste reduction programs | +1.5% | Europe, North America | Medium term (2-4 years) |
| Digital freshness records for export packs | +1.1% | East Asia, Europe | Long term (>= 4 years) |
Source: Fact.MR analysis. Updated Aug 22, 2026
- Protein spoilage monitoring: Chilled meat and seafood chains need faster evidence when pack atmosphere begins to change. Ammonia-amines and hydrogen sulfide sensors address that loss point directly.
- Printed label compatibility: Converter-friendly sensor formats reduce the process change needed for pilots. Graphene inks and coated electrodes are therefore tested first on labels and patches.
- Retail food-waste reduction: Food waste targets push retailers to distinguish safe product from spoiled product more accurately. Freshness indicators support markdown and stock-rotation decisions.
- Digital freshness records: Export packs need stronger evidence when seafood and chilled foods travel through several handoffs. NFC and connected readers link sensor signals with shipment records.
| OPPORTUNITY | (~) % IMPACT ON CAGR | GEOGRAPHIC RELEVANCE | IMPACT TIMELINE |
|---|---|---|---|
| Low-cost printed graphene labels for meat packs | +1.7% | North America, Europe | Short term (<= 2 years) |
| Wireless freshness records for export seafood | +1.3% | Japan, South Korea, UK | Medium term (2-4 years) |
| Multi-analyte patches for produce and prepared foods | +0.9% | Global | Long term (>= 4 years) |
Source: Fact.MR analysis. Updated Aug 22, 2026
- Low-cost printed labels: Suppliers gain adoption by keeping the sensor inside normal label-converting steps. Printed formats lower the barrier for trials across meat and seafood packs.
- Wireless export records: NFC readout creates a route for freshness evidence during cold-chain handoffs. Seafood exporters use those records when product value justifies scanning.
- Multi-analyte patches: Combined gas and humidity sensing is expected to widen use beyond meat. Produce and prepared-food packs need stable response across different atmospheres.
| RESTRAINT | (~) % IMPACT ON CAGR | GEOGRAPHIC RELEVANCE | IMPACT TIMELINE |
|---|---|---|---|
| Food-contact approval and migration testing | -0.8% | Europe, North America | Short term (<= 2 years) |
| False positive and calibration risk | -0.6% | Global | Medium term (2-4 years) |
| Added unit cost on disposable packs | -0.5% | Global | Long term (>= 4 years) |
Source: Fact.MR analysis. Updated Aug 22, 2026
- Food-contact approval: Sensor suppliers need documentation before graphene layers are placed near food packaging. This slows movement from laboratory response to retail use.
- False positive risk: Spoilage signals shift with humidity, temperature and pack atmosphere. Processors therefore need validation rules for each food type and pack design.
- Added unit cost: Disposable labels face strict price comparison against conventional date codes. Adoption is expected to move first into packs where loss reduction is measurable.
Which countries are scaling the Graphene Spoilage Sensors Market through 2036?
- The country comparison spans 13.4 percentage points across the five profiled markets.
- The USA remains 2.4 percentage points above Germany through protein processing scale and retail food spending.
- Germany remains 1.3 percentage points above Japan through meat output and packaging know-how.
- Japan remains 3.9 percentage points above South Korea through seafood exports and electronics capability.
- South Korea remains 5.8 percentage points above the UK through seafood exports and connected packaging workflows.
- The UK closes the displayed range while seafood use cases remain narrower and label-cost scrutiny stays high.
Comparable CAGRs are expected to create different entry conditions through protein volume, export exposure, retail waste programs and sensor-readout infrastructure. Full report coverage includes North America, Latin America, Western Europe, Eastern Europe, East Asia, South Asia & Pacific, Middle East & Africa.
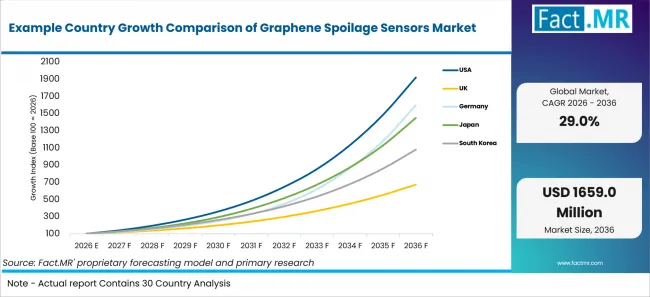
Example Country Growth Comparison Of Graphene Spoilage Sensors Market | Source: Fact.MR
| Country | CAGR (2026-2036) |
|---|---|
| USA | 34.4% |
| Germany | 32.0% |
| Japan | 30.7% |
| South Korea | 26.8% |
| UK | 21.0% |
Source: Fact.MR analysis. Updated Aug 22, 2026
What supports USA adoption?
34.4% CAGR through 2036, supported by chilled protein volume and retail food spending.
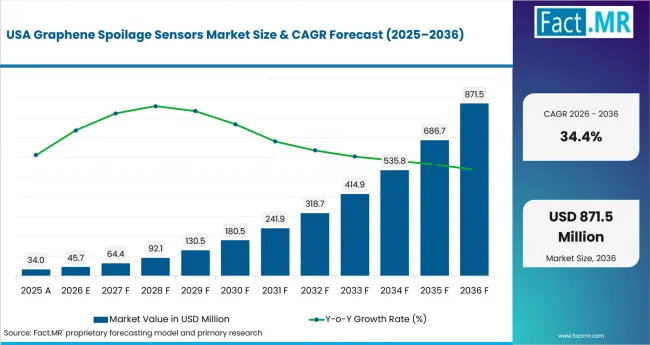
Graphene Spoilage Sensors Market Country Value Analysis | Source: Fact.MR
The USA’s growth is supported by large chilled-protein volumes and a broad food retail market. USDA NASS reported 53.8 billion pounds of red meat production in 2025, while USDA ERS reported inflation-adjusted food spending of USD 2.51 trillion in 2025. Graphene freshness labels are expected to support meat, seafood and prepared-food applications where pack-level indicators can complement traceability records.
What supports Germany adoption?
32.0% CAGR through 2036, reinforced by meat processing and packaging-converter capability.
Germany’s growth reflects substantial meat processing and an established packaging-conversion base. Destatis reported that commercial slaughterhouses produced just under 3.4 million tonnes of meat in the first half of 2025, while BZL reported average fish, crustacean and mollusc consumption of 15.2 kilograms per person in 2025. Printed labels and coated electrodes can fit existing converter networks and spoilage-reduction programs.
How is Japan scaling demand?
30.7% CAGR through 2036, led by seafood exports and electronics capability.
Japan’s growth is supported by strong seafood activity and advanced electronics expertise. MAFF reported that fishery-product exports reached JPY 423.1 billion in 2025, up 17.2% year over year, while total fisheries and aquaculture production reached 3.6348 million tonnes in 2024. Retailers are expected to test non-destructive freshness labels and resistance-change or NFC-enabled sensors in premium chilled foods.
What supports South Korea adoption?
26.8% CAGR through 2036, driven by fisheries output and export quality assurance.
South Korea’s growth is supported by rising fisheries output and expanding seafood exports. The Ministry of Data and Statistics reported preliminary fishery production of 3.935 million tonnes in 2025, up 8.7% year over year, while the Ministry of Oceans and Fisheries reported preliminary seafood exports of USD 3.33 billion, up 9.7%. Connected packaging using printed indicators, NFC and reader systems can support export logistics and chilled-product monitoring.
How is the UK developing demand?
21.0% CAGR through 2036, backed by salmon, shellfish and label confidence needs.
The UK’s growth reflects strong salmon production, seafood handling activity and familiarity with consumer-facing food labels. The Scottish Government reported Atlantic salmon production of 192,000 tonnes in 2024, up 27% from 2023, while the Marine Management Organisation reported that the total quantity of landings by UK vessels increased 7% year over year in December 2025. Graphene and sensor engineering capabilities can support printed freshness indicators and label electronics.
Who leads the Graphene Spoilage Sensors Market?
Graphenea’s November 2025 collaboration with Melexis provides a route to evaluate graphene transducers with integrated semiconductor readout electronics.
Paragraf Limited competes through graphene-based electronic devices and GFET sensors. Its 2025 GFET Discovery Kit and INTRATOMICS memorandum demonstrate a focus on molecular sensing, sensor functionalization and system integration.
LayerLogic, Chang Robotics (GO-Eco) and Grolltex Inc. remain relevant as graphene-material or device suppliers. Primary-source evidence reviewed for this report does not establish these companies as commercial food-spoilage-sensor vendors.
Which companies are the key providers?
Key companies include Graphenea, LayerLogic, Paragraf Limited, Chang Robotics (GO-Eco) and Grolltex Inc.
- Graphenea
- LayerLogic
- Paragraf Limited
- Chang Robotics (GO-Eco)
- Grolltex Inc.
How is the market segmented?
-
By Analyte
- Ammonia-amines
- Ethylene
- Hydrogen sulfide
- Humidity
- Microbial metabolites
-
By Sensor Format
- Printed label
- Flexible patch
- Reader cartridge
- Coated electrode
-
By Food Type
- Meat-seafood
- Fresh produce
- Dairy
- Prepared foods
-
By Readout
- Colorimetric-assisted
- Resistance change
- Wireless NFC
- Connected reader
-
By Region
- North America
- Latin America
- Western Europe
- Eastern Europe
- East Asia
- South Asia & Pacific
- Middle East & Africa
Bibliography
- U.S. Department of Agriculture, National Agricultural Statistics Service. (2026, April 22). Livestock Slaughter 2025 Summary.
- U.S. Department of Agriculture, National Agricultural Statistics Service. (2026, May 21). Livestock Slaughter.
- Statistisches Bundesamt. (2025, August 7). Fleischproduktion im 1. Halbjahr 2025: mehr Schweinefleisch und weniger Rindfleisch.
- Bundesinformationszentrum Landwirtschaft. (2026, May 22). Wie viel Fisch essen die Menschen in Deutschland?
- Statistics Bureau of Japan. (2026, January 23). Japan 2025.
- Ministry of Data and Statistics. (2026, February 27). Preliminary results of the Fishery Production Survey in 2025.
- Ministry of Data and Statistics. (2026, June 2). Consumer Price Index in May 2026.
- Scottish Government. (2025, October 28). Scottish Fish Farm Production Survey 2024.
- Marine Management Organisation. (2026, January 30). Monthly Sea Fisheries Statistics December 2025.
This Report Answers
- The report explains where graphene spoilage sensors are used across analyte, sensor format, food type and readout method.
- Segment analysis identifies the leading subsegments and the operational reasons processors prioritize them.
- Country analysis examines the listed markets and the food-chain mechanisms supporting sensor adoption.
- Competitive analysis reviews material, GFET, ink and device providers relevant to spoilage-sensor development.
- Application analysis assesses how shelf loss, label cost and reader simplicity influence purchase decisions.
What does the Graphene Spoilage Sensors Market cover?
The market covers sensor materials and formats used to detect spoilage signals in food packaging. It connects upstream graphene materials with food-packaging formats that turn freshness changes into visual or electronic signals.
The assessment includes 2D materials graphene where thin conductive layers support sensing. It also includes graphene electrodes used in resistance-change formats.
Food packaging adoption overlaps with AI packaging sensors when freshness signals are paired with software checks. Broader intelligent packaging is relevant only when the pack communicates freshness or spoilage status.
What is included in the scope?
The scope includes labels, flexible patches, reader cartridges and coated electrodes for fresh food packaging. It includes conductive inks and functionalized layers where graphene has a defined sensing role.
The analysis covers nano-enabled packaging when the nanomaterial provides spoilage response. It also covers biosensor spoilage labels used for meat, seafood, produce, dairy and prepared foods.
Wireless use cases include NFC packaging when freshness information is read by a device. Graphene VOC sensors inform gas-sensing routes only when the signal is tied to food spoilage.
What is excluded from the scope?
The scope excludes time-temperature indicators without graphene, conventional date labels and food testing instruments used away from the package. It excludes raw graphene without a sensing route and laboratory assays that do not support pack-level monitoring.
General smart packaging is excluded when it only provides authentication or brand engagement. RFID systems are also excluded when they track logistics without detecting a freshness or spoilage-related signal.
How Was the Analysis Built?
The analysis draws on public statistics, official releases, company review, source validation and the forecast series.
- Primary Research: Primary research includes discussions with developers, label converters, food processors and procurement teams. These conversations examine sensor cost, packaging fit and acceptance barriers.
- Desk Research: Desk research covers government statistics, regulator pages, company announcements, technical portfolios and food production data. Sources used in the analysis are documented in the bibliography.
- Market Sizing and Forecasting: Market estimates combine historical values, country adoption, food-chain demand, segment shares, provider activity and market barriers.
- Data Validation and Update Cycle: Findings are validated against public data, company activity, regulations and food-sector indicators. Updates review product launches, partnerships and adoption signals.
Segmentation
What is the report’s scope and coverage?
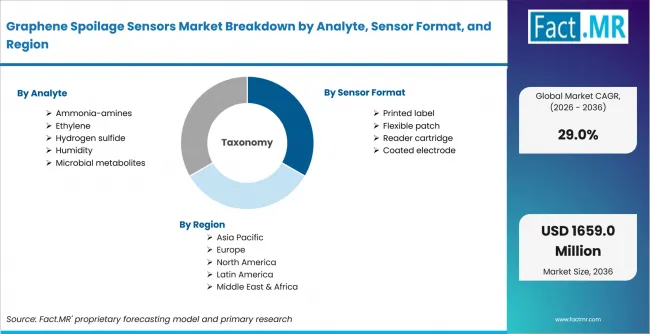
Graphene Spoilage Sensors Market Breakdown By Analyte, Sensor Format, And Region | Source: Fact.MR
| Attribute | Details |
|---|---|
| Quantitative Units | USD million in 2026 to USD million by 2036 at a CAGR. |
| Market Definition | Graphene-based spoilage sensors used in food packaging to detect gases, metabolites, humidity or freshness changes through labels, patches, electrodes or readers. |
| Analyte | Ammonia-amines; Ethylene; Hydrogen sulfide; Humidity; Microbial metabolites |
| Sensor Format | Printed label; Flexible patch; Reader cartridge; Coated electrode |
| Food Type | Meat-seafood; Fresh produce; Dairy; Prepared foods |
| Readout | Colorimetric-assisted; Resistance change; Wireless NFC; Connected reader |
| Regions Covered | North America; Latin America; Western Europe; Eastern Europe; East Asia; South Asia & Pacific; Middle East & Africa |
| Countries Covered | USA; UK; Germany; Japan; South Korea |
| Key Companies Profiled | Graphenea; LayerLogic; Paragraf Limited; Chang Robotics (GO-Eco); Grolltex Inc. |
| Forecast Period | 2026 to 2036 |
| Approach | Hybrid top-down and bottom-up approach using food-packaging use cases, analyte requirements, sensor-format adoption, country growth and provider portfolio review. |
Source: Fact.MR analysis. Updated Aug 22, 2026
Frequently Asked Questions
How big is the graphene spoilage sensors market in 2026?
What is the CAGR of the graphene spoilage sensors market from 2026 to 2036?
Which analyte leads the graphene spoilage sensors market?
Which sensor format leads the graphene spoilage sensors market?
Printed label accounts for 34.0% of the graphene spoilage sensors market by sensor format in 2026, reflecting its compatibility with existing food-packaging and label-converting workflows.
Who worked on this report


Preview the report firsthand - request a free sample
Free SampleGet the brochure for pricing and purchase details
Download PDF