- Market Value (2025): USD 5.0 Bn
- Estimated Value (2026): USD 5.8 Bn
- Forecast Value (2036): USD 24.9 Bn
- CAGR (2026-2036): 15.7%
What is the HBM 8 Hi Vs 12 Hi Stack Market forecast to be worth by 2036?
USD 5.8 billion in 2026 to USD 24.9 billion by 2036 at 15.7% CAGR.
- The HBM 8 Hi Vs 12 Hi Stack market was valued at USD 5.0 billion in 2025 as accelerator programs placed more weight on high-capacity memory packages.
- Demand is projected to increase from USD 5.8 billion in 2026 to USD 24.9 billion by 2036.
- The market is forecast to record 15.7% CAGR from 2026 to 2036.
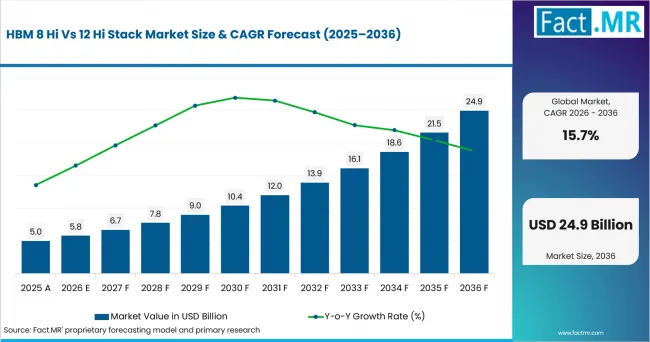
Hbm 8 Hi Vs 12 Hi Stack Market Value Analysis | Source: Fact.MR
What are the defining numbers behind HBM 8 Hi Vs 12 Hi Stack Market growth?
USD 19.1 billion absolute opportunity by 2036.
- Demand Drivers in the Market
- AI accelerators need nearby memory that feeds compute cores without delay. This is expected to support demand for high-bandwidth memory chips across training and inference platforms. The International Energy Agency reported in 2026 that global data center electricity demand grew 17.0% in 2025, while AI-focused data center electricity consumption surged 50.0%, adding pressure for faster accelerator memory inside dense server clusters.
- GPU server builders are expected to favor stack designs that lift memory capacity without widening the board. This keeps package height and cooling requirements central to data center accelerators.
- Chiplet platforms are expected to require shorter memory paths inside the package. Interposers and advanced IC substrates therefore remain part of early stack selection.
- Thermal pressure is expected to shape stack choice before volume orders are placed. Taller HBM packages need stable heat transfer through thermal interface materials and cooling hardware.
- Key Segments Analyzed
- By Stack Configuration: 12-Hi HBM Stack is expected to hold 57.0% share in 2026 as accelerator makers seek higher memory capacity per package.
- By Application: Artificial Intelligence Accelerators are projected to account for 48.0% share in 2026 since model training places the heaviest burden on local memory bandwidth.
- By End-use Industry: Data Centers are anticipated to capture 46.0% share in 2026 as dense GPU clusters absorb the largest HBM volumes.
- By Customer Type: GPU Manufacturers are estimated to represent 43.0% share in 2026 because their platform rules set memory and package specifications.
- By Memory Packaging Technology: Through-Silicon Via Technology is forecast to hold 68.0% share in 2026 as stacked memory depends on reliable vertical interconnects across 3D TSV packages.
- Analyst Opinion at Fact.MR
- Shambhu Nath Jha, Principal Consultant at Fact.MR, states: "HBM stack selection is moving from a memory component choice to a platform qualification choice. AI accelerator makers are expected to weigh package height and thermal path first. Bandwidth and supply assurance then decide server uptime and cost."
- Strategic Implications
- Memory makers should align 12-Hi stack roadmaps with accelerator qualification windows before customers freeze package height and thermal rules.
- Foundries and OSAT partners should coordinate CoWoS and TSV capacity with confirmed accelerator programs across 3D semiconductor packaging.
- Substrate and cooling teams should test warpage and heat flow before server designs are locked. That lowers redesign risk for direct-to-chip cold plates.
South Korea leads at 16.8% CAGR through memory manufacturing scale and HBM process depth. Taiwan follows at 16.2% CAGR through foundry and advanced packaging capacity. The USA reaches 15.6% CAGR through accelerator design and data center procurement. Japan posts 15.0% CAGR through materials and equipment capability. China records 14.3% CAGR. Germany records 13.7% CAGR. Singapore reaches 13.1% CAGR through selective packaging and regional support.
How does the HBM 8 Hi Vs 12 Hi Stack Market break down by segment?
12-Hi HBM Stack is expected to lead Stack Configuration at 57.0% share in 2026. Artificial Intelligence Accelerators are projected to lead Application at 48.0% share in 2026.
What supports 12-Hi HBM Stack leadership?
12-Hi HBM Stack is projected to account for 57.0% share in 2026.
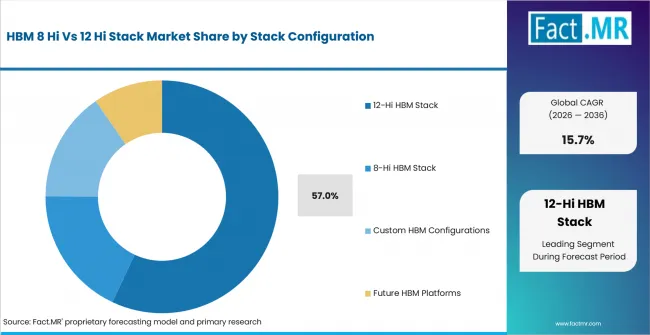
Hbm 8 Hi Vs 12 Hi Stack Market Analysis By Stack Configuration | Source: Fact.MR
Capacity pressure gives 12-Hi stacks a clear advantage in accelerator programs. They allow more memory to be placed near the compute die without expanding the package footprint. 8-Hi stacks remain useful where thermal limits or qualification risk outweigh maximum capacity. Demand therefore moves with HBM stack inspection and thermal release work.
Why do Artificial Intelligence Accelerators lead Application?
Artificial Intelligence Accelerators are expected to hold 48.0% share in 2026.
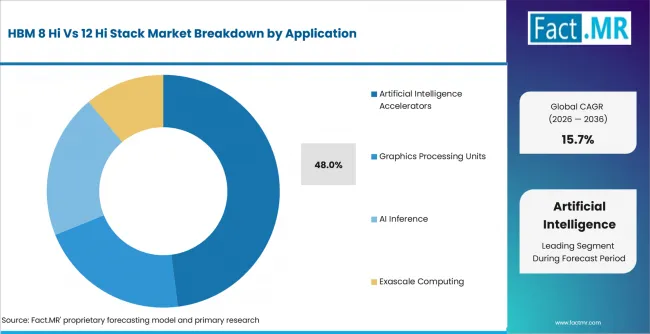
Hbm 8 Hi Vs 12 Hi Stack Market Analysis By Application | Source: Fact.MR
AI accelerators qualify memory with the compute package because bandwidth affects model training and inference throughput. Graphics and networking applications still create demand. Accelerator platforms absorb more HBM because each product generation raises local memory needs before the server reaches the customer. In June 2025, Micron announced that its HBM3E 36GB 12-high product was integrated into AMD Instinct MI350 Series GPUs, which provide 288 GB of HBM3E and up to 8 TB/s bandwidth for AI and HPC workloads.
What supports Data Centers within End-use Industry?
Data Centers are anticipated to represent 46.0% share in 2026.
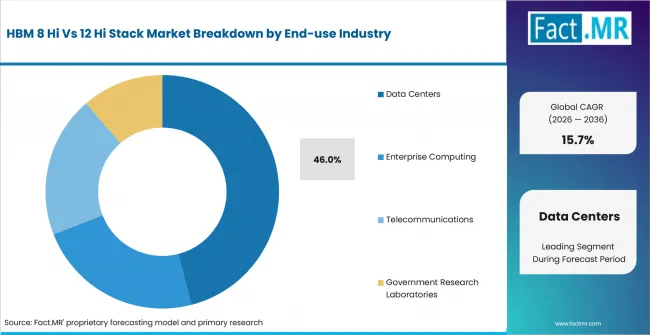
Hbm 8 Hi Vs 12 Hi Stack Market Analysis By End Use Industry | Source: Fact.MR
Data center demand comes from dense GPU clusters that use HBM as part of the accelerator system. Operators judge stack value through throughput and power draw. Maintenance cost becomes part of the same decision. Enterprise and automotive use cases remain more selective across AI server chassis programs.
How do GPU Manufacturers shape Customer Type demand?
GPU Manufacturers are estimated to lead Customer Type with 43.0% share in 2026.
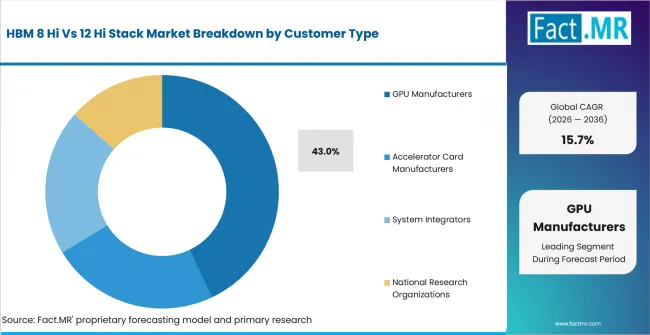
Hbm 8 Hi Vs 12 Hi Stack Market Analysis By Customer Type | Source: Fact.MR
GPU manufacturers define the memory package before server makers place volume orders. Their specifications shape stack height and HBM generation. Interposer layout and cooling path follow those rules. Cloud service providers and system integrators then buy servers around those platform rules.
Why does Through-Silicon Via Technology lead Memory Packaging Technology?
Through-Silicon Via Technology is forecast to hold 68.0% share in 2026.
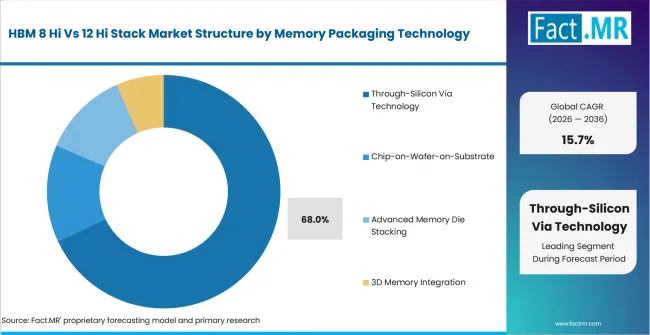
Hbm 8 Hi Vs 12 Hi Stack Market Analysis By Memory Packaging Technology | Source: Fact.MR
TSV technology remains central to HBM because memory dies must connect vertically inside a compact package. Hybrid bonding and silicon interposers add more routes for performance improvement. Even so, TSV quality remains a release condition for tall stack yield and through-glass via interposers adjacency. In April 2025, TSMC said its 9.5-reticle-size CoWoS technology is planned for 2027 volume production and is designed to integrate 12 or more HBM stacks in one package with leading-edge logic.
What is accelerating HBM 8 Hi Vs 12 Hi Stack Market adoption, and what is holding it back?
Demand is expected to rise as sponsors face outsourcing pressure and commercial supply needs. Sterile production limits add capacity pressure. Quality risk and technology-transfer delays remain restraints.
Drivers Impact Analysis
| DRIVER | (~) % IMPACT ON CAGR | GEOGRAPHIC RELEVANCE | IMPACT TIMELINE |
|---|---|---|---|
| Commercial supply outsourcing | +2.0% | USA, Germany, Switzerland | Short term (<= 2 years) |
| Sterile and biologics capacity | +1.7% | USA, Japan, South Korea | Short term (<= 2 years) |
| Technology transfer complexity | +1.3% | Global sponsor networks | Medium term (2-4 years) |
| Long-term capacity agreements | +1.1% | Europe and Asia Pacific | Medium term (2-4 years) |
| Quality and release documentation | +0.9% | Regulated export markets | Long term (>= 4 years) |
Source: Fact.MR analysis. Updated Aug 10, 2026
- Commercial supply outsourcing: Sponsors are expected to outsource production when internal plants are assigned to higher-priority launches or specialized assets.
- Sterile and biologics capacity: Aseptic and biologic production needs are expected to raise demand for partners with validated facilities.
- Technology transfer complexity: CDMOs with clear transfer protocols are expected to reduce handoff risk between development batches and commercial production.
Opportunity Impact Analysis
| OPPORTUNITY | (~) % IMPACT ON CAGR | GEOGRAPHIC RELEVANCE | IMPACT TIMELINE |
|---|---|---|---|
| Integrated development-to-commercial services | +1.4% | USA and Europe | Medium term (2-4 years) |
| Specialized sterile fill-finish | +1.1% | USA, Germany, South Korea | Medium term (2-4 years) |
| Complex biologics and advanced modalities | +0.8% | Switzerland, Japan, China | Long term (>= 4 years) |
| Regional supply chain diversification | +0.6% | India and East Asia | Long term (>= 4 years) |
Source: Fact.MR analysis. Updated Aug 10, 2026
- Integrated development-to-commercial services: Providers that connect formulation and process work with commercial transfer are expected to gain more approval during supplier selection.
- Specialized sterile fill-finish: Demand growth is expected to be sharper where sponsors need validated injectable capacity for biologics and specialty drugs.
- Regional supply chain diversification: Multi-site CDMO networks are expected to gain attention as sponsors look for qualified alternatives beyond a single production site.
Restraints Impact Analysis
Demand is expected to rise through larger AI models and denser accelerator servers. Growth is restrained by packaging capacity and heat removal.
Drivers Impact Analysis
| RESTRAINT | (~) % IMPACT ON CAGR | GEOGRAPHIC RELEVANCE | IMPACT TIMELINE |
|---|---|---|---|
| Quality and compliance risk | -1.1% | Global | Short term (<= 2 years) |
| Capacity booking pressure | -0.9% | Sterile and biologics sites | Short term (<= 2 years) |
| Technology-transfer delays | -0.7% | Cross-border projects | Medium term (2-4 years) |
| Specialized workforce gaps | -0.5% | Developing production hubs |
Source: Fact.MR analysis. Updated Aug 10, 2026
- AI accelerator memory density: Larger model memory loads are expected to increase preference for 12-Hi packages where platforms can manage heat and height.
- Advanced packaging capacity: Interposer availability is expected to decide which accelerator programs move from qualification into volume orders.
- Data center GPU deployment: Server makers are expected to favor HBM packages that improve accelerator throughput without expanding board footprint.
Which countries are scaling the HBM 8 Hi Vs 12 Hi Stack Market fastest?
- The country comparison spans 3.7 percentage points and separates memory centers from packaging and demand centers.
- South Korea remains 0.6 percentage point above Taiwan through memory manufacturing scale and HBM process depth.
- Taiwan remains 0.6 percentage point above the USA through foundry scale and advanced packaging capacity.
- The USA remains 0.6 percentage point above Japan through accelerator design and cloud data center procurement.
- Japan remains 0.7 percentage point above China through materials and process know-how.
- China remains 0.6 percentage point above Germany through domestic AI hardware demand and semiconductor self-sufficiency priorities.
- Germany remains 0.6 percentage point above Singapore through automotive semiconductors and industrial compute demand.
Comparable CAGRs create different entry conditions because each country contributes a different part of the HBM value chain. Full report coverage includes North America; Latin America; Europe; East Asia; South Asia and Pacific; and Middle East and Africa.
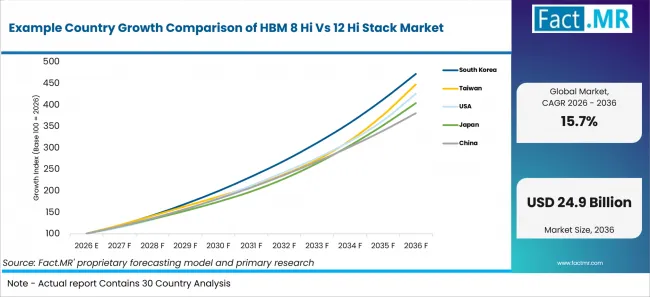
Example Country Growth Comparison Of Hbm 8 Hi Vs 12 Hi Stack Market | Source: Fact.MR
| Country | CAGR (2026-2036) |
|---|---|
| South Korea | 16.8% |
| Taiwan | 16.2% |
| USA | 15.6% |
| Japan | 15.0% |
| China | 14.3% |
| Germany | 13.7% |
| Singapore | 13.1% |
Source: Fact.MR analysis. Updated Aug 10, 2026
What supports South Korea adoption?
16.8% CAGR, supported by memory manufacturing scale and HBM qualification depth.
South Korea leads because local memory suppliers control tall-stack process knowledge. AI customers need stable TSV performance and package-level thermal proof. This gives domestic suppliers a shorter path from samples to volume acceptance. In July 2026, Korea’s Ministry of Trade, Industry and Resources and Ministry of Science and ICT reported that semiconductors and SSDs accounted for 83.7% of Korea’s ICT exports in the first half of 2026, with semiconductor exports up 162.5% year on year as AI and server investment lifted memory demand and prices.
How is Taiwan scaling demand?
Taiwan follows with 16.2% CAGR through foundry scale and advanced packaging capacity.
Taiwan’s role is strongest at the package integration stage. Foundries and packaging partners must place logic dies and HBM stacks inside one qualified module. This supports accelerator programs that depend on CoWoS-style integration.
What is driving USA growth from 2026 to 2036?
The USA is projected to advance at 15.6% CAGR through accelerator design and data center procurement.
The USA shapes demand through chip designers and hyperscale buyers. AI server customers translate those choices into procurement. Their design choices influence which 8-Hi or 12-Hi stacks suppliers must qualify.
How does Japan perform?
Japan posts 15.0% CAGR through materials and process know-how.
Japan’s growth comes from upstream technologies that support tall stack manufacturing. Materials and bonding systems affect yield before customer qualification. This gives Japanese supplier a role even when final assembly occurs elsewhere.
How is China scaling demand?
China records 14.3% CAGR through domestic AI hardware demand and local semiconductor priorities.
China’s demand is shaped by accelerator deployment and local server programs. Buyers are expected to seek HBM-compatible platforms where supply can be secured. Access limits keep qualification choices more selective.
What supports Germany’s growth?
Germany is forecast at 13.7% CAGR through automotive semiconductors and industrial compute demand.
Germany represents a narrower demand base than Asian memory clusters. Adoption is expected to come from automotive AI processors and industrial edge systems. Long product cycles keep approval selective.
What supports Singapore’s growth?
Singapore reaches 13.1% CAGR through packaging support and regional semiconductor services.
Singapore supports demand through engineering and test services. The country is expected to benefit where multinational programs need dependable execution near Asian supply chains. HBM demand remains selective but useful for packaging support. Singapore’s Economic Development Board reported preliminary 2025 manufacturing output of S$479.1 billion, with electronics representing 45.6% of output and S$57.4 billion of manufacturing value added, supporting the country’s role in semiconductor services.
Who leads the HBM 8 Hi Vs 12 Hi Stack Market?
SK hynix, Samsung Electronics, and Micron Technology show the strongest direct relevance, while TSMC and ASE Technology Holding strengthen the packaging side.
SK hynix shipped 12-layer HBM4 samples in March 2025. Samsung introduced HBM3E 12H DRAM in February 2024, while Micron began HBM3E volume production in the same month. TSMC and ASE support advanced packaging and integration for bringing tall HBM stacks closer to logic dies.
Which companies are the key providers?
Key companies include SK hynix Inc.; Samsung Electronics Co., Ltd.; Micron Technology, Inc.; Taiwan Semiconductor Manufacturing Company Limited; and ASE Technology Holding Co., Ltd.
- SK hynix Inc.
- Samsung Electronics Co., Ltd.
- Micron Technology, Inc.
- Taiwan Semiconductor Manufacturing Company Limited
- ASE Technology Holding Co., Ltd.
Bibliography
- ASE Technology Holding Co., Ltd. (2026, May 26). ASE launches automated 310mm panel-level packaging to accelerate AI innovation.
- Micron Technology, Inc. (2024, February 26). Micron commences volume production of industry-leading HBM3E solution to accelerate the growth of AI.
- Samsung Electronics Co., Ltd. (2024, February 27). Samsung develops industry-first 36GB HBM3E 12H DRAM.
- SEMI. (2026, April 7). SEMI reports global semiconductor equipment billings reached $135 billion in 2025, up 15% year-on-year.
- SK hynix Inc. (2025, March 19). SK hynix ships world’s first 12-layer HBM4 samples to customers.
- Taiwan Semiconductor Manufacturing Company Limited. (2025, April). TSMC unveils next-generation A14 process at North America Technology Symposium.
- Micron Technology, Inc. (2025, June 10). Micron ships HBM4 to key customers to power next-gen AI platforms.
- Ministry of Trade, Industry and Resources and Ministry of Science and ICT, Republic of Korea. (2026, July 14). Korea’s ICT exports reach record $253.9 billion in first half of 2026.
- Singapore Economic Development Board. (2026). Manufacturing Performance 2025p.
This Report Answers
- The report explains how 8-Hi and 12-Hi stack choices affect AI accelerator and GPU server qualification.
- Segment analysis covers 12-Hi HBM Stack and Artificial Intelligence Accelerators as the leading 2026 categories.
- Country outlook evaluates South Korea; Taiwan; the USA; Japan; China; Germany; and Singapore across the forecast period.
- Competitive analysis profiles memory suppliers and chip designers. Foundries and OSAT providers complete the qualification view.
- Packaging assessment covers TSV technology and silicon interposers. Hybrid bonding and advanced substrates complete the view with thermal interface materials.
What does the HBM 8 Hi Vs 12 Hi Stack Market cover?
The market covers 8-Hi and 12-Hi HBM stack configurations used in AI accelerators and GPU servers. High-performance computing and automotive AI processors are included where HBM stack choice affects qualification.
What is included in the scope?
The scope includes HBM stack demand tied to TSV-based memory stacking and silicon interposer integration. Hybrid bonding and advanced substrates are included. Foundries and OSAT providers complete the chain.
What is excluded from the scope?
The scope excludes conventional DRAM modules and NAND storage products. Non-HBM memory devices and general server components without HBM integration remain outside coverage.
How Was the Analysis Built?
The analysis draws on 120+ sources, 35+ company portfolios, 25+ countries, and more than 20 interviews.
- Primary Research: Interviews with manufacturers, retailers, salon operators, and experts examine purchase priorities, adoption, approval requirements, and competitive positioning.
- Desk Research: Desk research covers government statistics, regulatory publications, company filings, trade data, technical studies, industry associations, standards, and public policy.
- Market Sizing and Forecasting: Estimates combine historical performance, demand indicators, pricing, segment shares, company participation, country growth, adoption patterns, and barriers to expansion.
- Data Validation and Update Cycle: Findings are validated against public data, company activity, regulatory changes, product launches, recalls, and adoption shifts.
Segmentation
What is the report's scope and coverage?
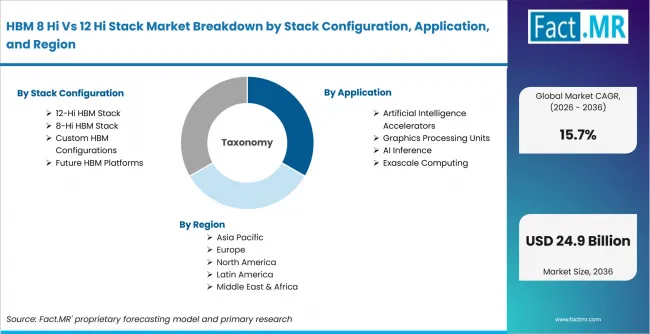
Hbm 8 Hi Vs 12 Hi Stack Market Breakdown By Stack Configuration, Application, And Region | Source: Fact.MR
| Attribute | Details |
|---|---|
| Quantitative Units | USD billion |
| Market Definition | High-bandwidth memory stack configurations used in AI accelerators and advanced semiconductor packages where bandwidth density, package height, TSV reliability, and thermal behavior decide qualification. |
| Stack Configuration | 8-Hi HBM Stack; 12-Hi HBM Stack |
| Application | Artificial Intelligence Accelerators; Graphics Processing Units; High-performance Computing; Automotive AI Processors; Network Processors |
| End-use Industry | Data Centers; Consumer Electronics; Automotive; Telecommunications; Defense and Aerospace |
| Customer Type | GPU Manufacturers; Cloud Service Providers; Semiconductor Foundries; OSAT Providers; AI Server OEMs |
| Memory Packaging Technology | Through-Silicon Via Technology; Silicon Interposers; Hybrid Bonding; Advanced Substrates; Thermal Interface Materials |
| Regions Covered | North America; Latin America; Europe; East Asia; South Asia and Pacific; Middle East and Africa |
| Countries Covered | South Korea; Taiwan; USA; Japan; China; Germany; Singapore |
| Key Companies Profiled | SK hynix Inc.; Samsung Electronics Co., Ltd.; Micron Technology, Inc.; Taiwan Semiconductor Manufacturing Company Limited; ASE Technology Holding Co., Ltd. |
| Forecast Period | 2026 to 2036 |
| Approach | Hybrid top-down and bottom-up approach using HBM stack roadmaps; AI accelerator demand; GPU server capacity; advanced packaging activity; TSV and interposer qualification; data center procurement; thermal management needs; country adoption patterns; and company portfolio review |
Source: Fact.MR analysis. Updated Aug 10, 2026
How is the HBM 8 Hi Vs 12 Hi Stack Market segmented?
-
By Stack Configuration
- 12-Hi HBM Stack
- 12-Hi HBM3E
- 12-Hi Next-generation HBM
- 8-Hi HBM Stack
- HBM3 8-Hi
- HBM3E 8-Hi
- Custom HBM Configurations
- Hybrid Stack Designs
- Application-specific HBM
- Future HBM Platforms
- 16-Hi Development
- High-capacity Memory Roadmaps
- 12-Hi HBM Stack
-
By Application
- Artificial Intelligence Accelerators
- AI Training Clusters
- Large Language Models
- Graphics Processing Units
- High-performance Computing
- Networking Accelerators
- AI Inference
- Edge AI Computing
- Autonomous Vehicle Computing
- Exascale Computing
- Quantum Computing Support
- Next-generation AI Systems
- Artificial Intelligence Accelerators
-
By End-use Industry
- Data Centers
- Hyperscale Cloud Providers
- Supercomputing Centers
- Enterprise Computing
- Research Computing
- Cloud Infrastructure
- Telecommunications
- 5G Infrastructure
- Automotive Electronics
- Government Research Laboratories
- Academic Research
- Defense Computing
- Data Centers
-
By Customer Type
- GPU Manufacturers
- Artificial Intelligence Chip Developers
- High-performance Computing Vendors
- Accelerator Card Manufacturers
- Semiconductor Foundries
- Network Equipment Manufacturers
- System Integrators
- Server Manufacturers
- Automotive Semiconductor Companies
- National Research Organizations
- Research Institutions
- Defense Technology Organizations
- GPU Manufacturers
-
By Memory Packaging Technology
- Through-Silicon Via Technology
- Advanced TSV Integration
- Hybrid Wafer Bonding
- Chip-on-Wafer-on-Substrate
- Micro-bump Interconnect
- Fine-pitch Bonding
- Advanced Memory Die Stacking
- Heterogeneous Integration
- High-density Redistribution Layer
- 3D Memory Integration
- Advanced Hybrid Packaging
- Ultra-high Density Packaging
- Through-Silicon Via Technology
-
By Region
- North America
- Latin America
- Europe
- East Asia
- South Asia and Pacific
- Middle East and Africa
Frequently Asked Questions
How big is the HBM 8 Hi Vs 12 Hi stack market in 2026?
What is the CAGR of the HBM 8 Hi Vs 12 Hi stack market from 2026 to 2036?
The HBM 8 Hi Vs 12 Hi stack market is projected to grow at a CAGR of 15.7% between 2026 and 2036, supported by higher AI accelerator memory density, data center GPU deployment and expanding advanced packaging capacity.
The HBM 8 Hi Vs 12 Hi stack market is projected to grow at a CAGR of 15.7% between 2026 and 2036, supported by higher AI accelerator memory density, data center GPU deployment and expanding advanced packaging capacity.
Artificial Intelligence Accelerators account for 48.0% of the HBM 8 Hi Vs 12 Hi stack market by application in 2026, reflecting their high local-memory requirements for AI training and inference workloads.
Who worked on this report


Preview the report firsthand - request a free sample
Free SampleGet the brochure for pricing and purchase details
Download PDF