- Market Value (2025): USD 11.7 Bn
- Estimated Value (2026): USD 12.5 Bn
- Forecast Value (2036): USD 23.2 Bn
- CAGR (2026-2036): 6.4%
What is the Healthy Fruit and Vegetable Chips Market forecast to be worth by 2036?
USD 12.5 billion in 2026 to USD 23.2 billion by 2036, at 6.4% CAGR.
- Demand is projected to increase from USD 12.5 billion in 2026 to USD 23.2 billion by 2036.
- The market is forecast to record a 6.4% CAGR from 2026 to 2036 as produce-based snacks move into repeat grocery purchases.
- The forecast creates USD 10.7 billion in absolute opportunity between 2026 and 2036.
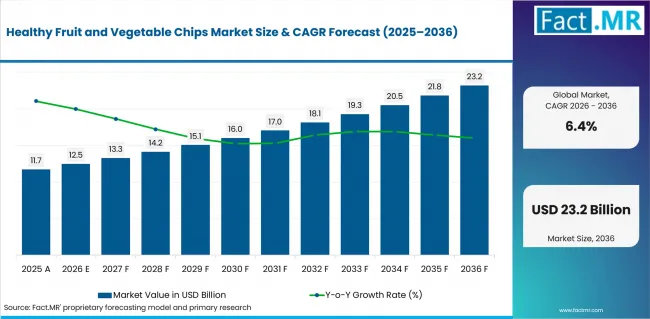
Healthy Fruit And Vegetable Chips Market Value Analysis | Source: Fact.MR
What are the defining numbers behind Healthy Fruit and Vegetable Chips Market growth?
USD 10.7 billion absolute opportunity by 2036, led by Fruit Chips, Baked Chips; and Supermarkets & Hypermarkets.
- Demand Drivers in the Market
- Shoppers want portable snacks that retain a visible connection to fruit, vegetables, roots; or other produce-based ingredients.
- Brands need formats that support health-oriented positioning without sacrificing crunch, flavor, portion control; or shelf stability.
- Retailers need products that can earn repeat purchase across mainstream snack aisles rather than depend only on specialist health-food placement.
- Processors need moisture control and dependable raw-material supply because breakage, texture drift, and inconsistent yield weaken pack economics.
- Key Segments Analyzed
- By Product: Fruit Chips are projected to hold 39.0% share in 2026 because recognizable fruit formats support simple ingredient communication and portable consumption.
- By Processing Method: Baked Chips are anticipated to capture 36.0% share in 2026 as manufacturers balance familiar crispness, scalable throughput, and lower-oil messaging.
- By Distribution Channel: Supermarkets & Hypermarkets are forecast to account for 45.0% share in 2026 because shelf comparison, multi-brand choice, and promotion remain decisive for trial.
- By End User: Household, foodservice, and institutional buyers apply different tests for portion size; price; format; and service reliability.
- By Nature: Ingredient sourcing, organic positioning, sustainability expectations; and price architecture influence how produce-based chip offers are evaluated.
- Analyst Opinion at Fact.MR
- Shambhu Nath Jha, Sr. Consultant at Fact.MR, states: "Healthy fruit and vegetable chips will not earn repeat purchase on a produce image alone. Brands must prove a credible nutrition profile; consistent crunch; stable shelf economics; and dependable raw-material supply. Premium processing is commercially useful only when it controls moisture and breakage without pushing the pack beyond the shopper's value threshold."
- Strategic Implications
- Brands should test nutrition and ingredient communication against the actual recipe, serving size, and market rules before making promotional claims.
- Processors should validate moisture, texture, oil use; breakage; yield; and shelf stability together before moving a premium process to commercial scale.
- Retail teams should compare price per serving, promotional dependence, shelf turnover; and repeat purchase rather than relying on first-trial velocity alone.
- Sourcing teams should qualify produce inputs and pack formats that can maintain sensory quality and supply continuity across seasonal variation.
How does the Healthy Fruit and Vegetable Chips Market break down by segment?
Fruit Chips lead Product at 39.0%, Baked Chips lead Processing Method at 36.0%, and Supermarkets & Hypermarkets lead Distribution Channel at 45.0% in 2026. Packaging and shelf-life requirements also affect the baked chips and snacks markets.
Why do Fruit Chips lead Product?
Fruit Chips hold 39.0% share in 2026.
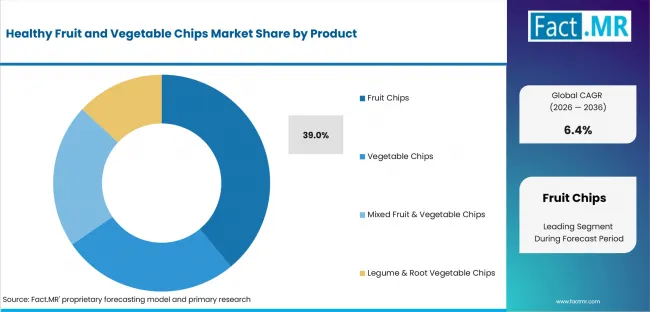
Healthy Fruit And Vegetable Chips Market Analysis By Product | Source: Fact.MR
Fruit chips present a recognizable ingredient and a portable eating format in the same pack. That combination supports simple communication around fruit identity while giving shoppers the crunch and convenience expected from a snack. Commercial performance still depends on moisture control, breakage, flavor concentration; and a pack price that can support repeat purchase.
Vegetable, potato, root; cassava; taro; legume; and mixed-produce formats remain important alternatives within the market boundary. Their value depends on whether the product can preserve a clear produce cue while delivering consistent texture and acceptable shelf economics.
Why do Baked Chips lead Processing Method?
Baked Chips hold 36.0% share in 2026.
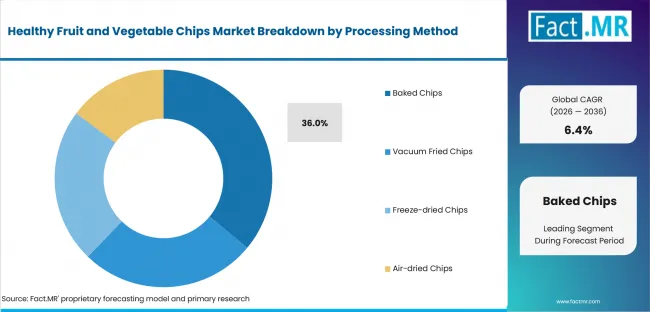
Healthy Fruit And Vegetable Chips Market Analysis By Processing Method | Source: Fact.MR
Baking gives manufacturers a familiar route to crisp texture while supporting lower-oil positioning. The process can be scaled through established snack-production systems, which helps brands balance product consistency with price discipline. The commercial test is whether baking produces an even bite and stable color without increasing breakage or reducing yield.
Other processing routes remain relevant when brands pursue stronger whole-produce cues, differentiated textures, or premium positioning. Those routes must still justify added processing cost through sensory quality; shelf life; and a defensible consumer benefit.
Why do Supermarkets & Hypermarkets lead Distribution Channel?
Supermarkets & Hypermarkets hold 45.0% share in 2026.
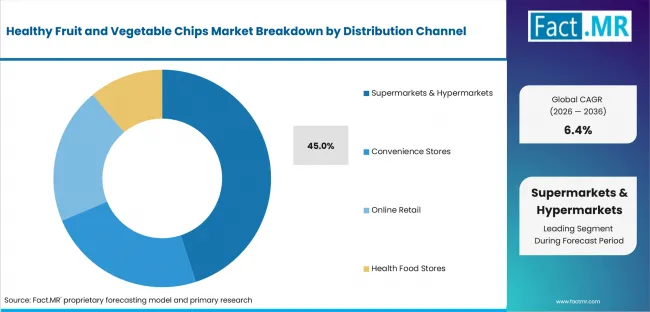
Healthy Fruit And Vegetable Chips Market Analysis By Distribution Channel | Source: Fact.MR
Supermarkets and hypermarkets let shoppers compare ingredient lists, nutrition panels, pack sizes; flavors; and prices at the point of purchase. They also give brands access to promotions and multi-brand shelf sets that can accelerate trial. The same visibility makes weak price-value positioning easy to detect; so sustained listings depend on repeat purchase and dependable supply.
Club stores, convenience outlets, and e-commerce broaden access after a product establishes a clear proposition. Each channel changes the required pack size; price point; replenishment model; and promotional support. Channel economics connect this demand with the potato snack and plant based snacks markets.
How does End User shape demand?
End-user requirements differ across household, foodservice, and institutional buying conditions.
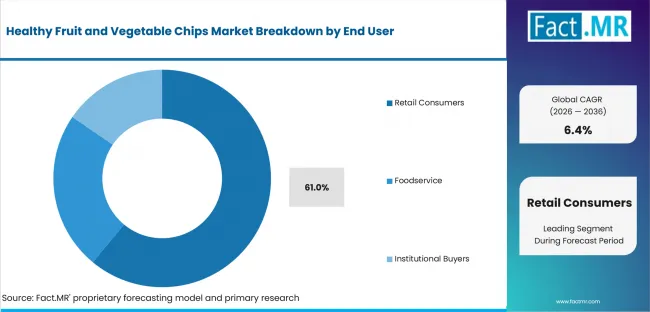
Healthy Fruit And Vegetable Chips Market Analysis By End User | Source: Fact.MR
Households compare taste, nutrition, pack price; and portion convenience inside routine snack purchases. Foodservice and institutional buyers place more weight on case format; breakage; consistency; and service reliability. A supplier therefore needs different pack and fulfillment logic even when the underlying chip formulation remains similar.
How does Nature affect buying decisions?
Nature influences sourcing expectations, documentation, sustainability positioning; and price tolerance.
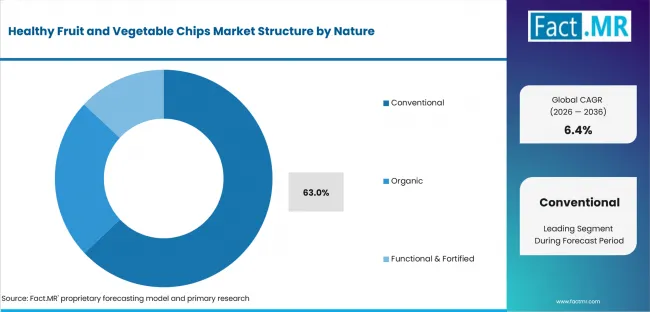
Healthy Fruit And Vegetable Chips Market Analysis By Nature | Source: Fact.MR
Organic and sustainability cues can improve consideration in specialist and mainstream channels, particularly where shoppers inspect ingredient provenance. Premium positioning weakens when the product cannot show a clear sensory or nutrition advantage over lower-priced alternatives. Brands need a nature proposition that can survive both label scrutiny and routine grocery price comparison.
What is accelerating Healthy Fruit and Vegetable Chips Market adoption, and what is holding it back?
Convenient produce-based snacking drives adoption, nutrition-label scrutiny and premium processing costs restrain conversion, and lower-oil or functional formulations create the clearest opportunity.
Drivers Impact Analysis
| DRIVER | QUALITATIVE RELEVANCE | GEOGRAPHIC RELEVANCE | IMPACT TIMELINE |
|---|---|---|---|
| Convenient produce-based snacking | High | USA | Current forecast period |
Source: Fact.MR analysis. Updated Aug 3, 2026
- Produce-based chips reduce preparation and make fruit, vegetable, root; or legume formats easier to consume across work; travel; school; and home occasions. The category gains strength when the product keeps a clear ingredient identity while delivering the crunch and portability expected from a snack. That balance supports recurring purchase rather than one-time health-led trial.
Opportunity Impact Analysis
| OPPORTUNITY | QUALITATIVE RELEVANCE | GEOGRAPHIC RELEVANCE | IMPACT TIMELINE |
|---|---|---|---|
| Lower-oil and functional formulations | High | Germany | Current forecast period |
Source: Fact.MR analysis. Updated Aug 3, 2026
- The clearest opening is to improve the product proposition without weakening snack performance. Lower-oil, whole-produce, and functional formulations can support premium value when they retain crunch; flavor; shelf stability; and simple ingredient communication. Suppliers that solve moisture and breakage at commercial scale can make the nutrition proposition more credible to both retailers and shoppers. Ingredient and processing decisions remain relevant to the functional snacks and better for you snacks markets.
Restraints Impact Analysis
| RESTRAINT | QUALITATIVE RELEVANCE | GEOGRAPHIC RELEVANCE | IMPACT TIMELINE |
|---|---|---|---|
| Nutrition-label scrutiny and premium processing costs | High | UK | Current forecast period |
Source: Fact.MR analysis. Updated Aug 3, 2026
- Health positioning can attract attention, but nutrition labels and promotional rules expose products that carry more oil, salt; sugar; or calories than the shopper expects. Premium processes also raise cost through moisture control; lower throughput; handling loss; or breakage. A product can therefore lose conversion at shelf even when its ingredient story is strong.
Which countries are scaling Healthy Fruit and Vegetable Chips Market fastest?
Canada records 8.3% CAGR, followed by France at 7.5%, South Korea at 6.6%; USA at 6.3%; UK at 6.0%; Germany at 5.7%; and Japan at 5.4% through 2036.
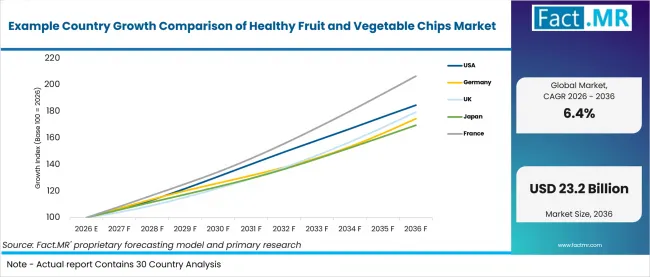
Example Country Growth Comparison Of Healthy Fruit And Vegetable Chips Market | Source: Fact.MR
| COUNTRY | CAGR, 2026 to 2036 |
|---|---|
| USA | 6.3% |
| Germany | 5.7% |
| UK | 6.0% |
| Japan | 5.4% |
| France | 7.5% |
| Canada | 8.3% |
| South Korea | 6.6% |
Source: Fact.MR analysis. Updated Aug 3, 2026
What is shaping USA's outlook through 2036?
6.3% CAGR through 2036, supported by multiple retail routes and national scale potential.
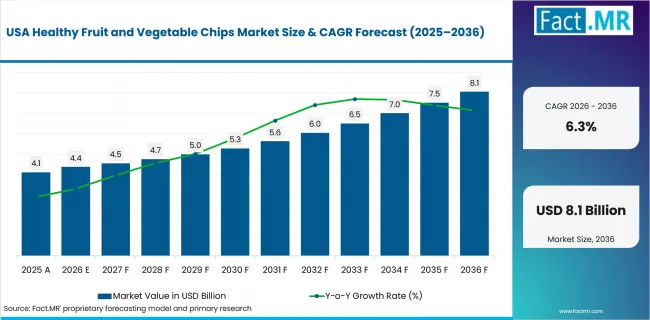
Healthy Fruit And Vegetable Chips Market Country Value Analysis | Source: Fact.MR
USA shoppers buy through national supermarkets, club stores, convenience outlets; and e-commerce; giving brands several routes to scale after a listing is secured. The broad channel base rewards clear ingredient communication and dependable supply; but it also exposes products to direct comparison on price; nutrition; and pack size. Brands need a proposition that can travel across channels without losing texture or value discipline.
What is shaping Germany's outlook through 2036?
5.7% CAGR through 2036, shaped by price discipline, organic expectations; and sustainability scrutiny.
German grocery purchasing combines discounter price pressure with strong organic, ingredient, and sustainability expectations in specialist and mainstream channels. Healthy chips therefore need both a credible sourcing story and a price architecture that can withstand comparison with conventional snacks. Processing or packaging premiums must translate into a visible consumer benefit.
What is shaping the UK's outlook through 2036?
6.0% CAGR through 2036, influenced by retailer category economics and nutrition-profile rules.
UK multiple grocers and online retailers evaluate snack products through category economics as well as nutrient-profile rules that affect placement and promotion. A produce-based image does not protect a product from scrutiny of its complete nutrition panel. Brands that manage recipe, serving size, promotion; and pack price together are better positioned to hold listings. Buyer occasions also influence the low sodium snacks and fruit and vegetable processing markets.
What is shaping Japan's outlook through 2036?
5.4% CAGR through 2036, supported by precise portions, clean presentation; and reliable texture.
Japanese consumers favor precise portions, clean presentation, reliable texture; and flavors adapted to convenience-store and supermarket shopping. This places pressure on breakage control; pack integrity; and consistent seasoning. Compact formats can support frequent purchase; but quality variation becomes visible quickly in tightly presented retail ranges.
What is shaping France's outlook through 2036?
7.5% CAGR through 2036, supported by nutrition cues, provenance; and ingredient-quality comparison.
French retailers increasingly use front-of-pack nutrition cues alongside price, provenance, and ingredient quality when comparing snack products. Healthy fruit and vegetable chips can benefit when the recipe and serving size support the promised positioning. Premium claims remain vulnerable when taste; value; or repeat-purchase performance is weak.
What is shaping Canada's outlook through 2036?
8.3% CAGR through 2036, the highest listed rate in the country comparison.
Canada is forecast to scale faster than the other profiled markets. The commercial test is whether produce-based chips can move from specialist trial into repeat mainstream grocery purchase while maintaining acceptable pack economics. Simple ingredient communication, consistent texture, and dependable availability are central to that conversion.
What is shaping South Korea's outlook through 2036?
6.6% CAGR through 2036, slightly above the global market rate.
South Korea is expected to expand faster than the global market average. Brands need to adapt flavor, portion, and pack architecture without weakening the category's produce-based positioning. Consistent crunch and retail-ready presentation are important when products compete across premium and mainstream snack sets.
Who leads the Healthy Fruit and Vegetable Chips Market?
Competition is divided between scaled food companies and specialist produce-chip brands. PepsiCo, Inc., The Hain Celestial Group; and General Mills; Inc. contribute retailer access; portfolio management; and supply infrastructure. Their commercial advantage depends on using that scale without weakening the category's ingredient and nutrition credibility. Retail execution creates a related demand signal in the fruit vegetable juice and clean label fruit and vegetable powder markets.
Bare Snacks, Rhythm Superfoods, Terra Chips; and Greenday Foods compete through visible produce cues; dehydration expertise; and differentiated formats. Calbee; Sensible Portions; and Tyrells add regional brand strength; texture development; and familiar savory positioning. Competition through 2036 is expected to center on nutrition credibility; crunch; breakage control; pack economics; distribution reach; and supply reliability.
Which companies are the key providers?
Bare Snacks and Sensible Portions are leading companies in the market.
- Bare Snacks
- Sensible Portions
- The Hain Celestial Group
- Calbee, Inc.
- PepsiCo, Inc.
- General Mills
- Inc.
- Rhythm Superfoods
- Tyrells
- Terra Chips
- Greenday Foods
Bibliography
- U.S. Food and Drug Administration. (n.d.). The Nutrition Facts Label.
- World Health Organization. (2026, January 26). Healthy diet.
- European Commission. (n.d.). Nutrition and Health Claims.
- Health Canada. (2026, January 5). Nutrition labelling: Front-of-package nutrition symbol.
- UK Department of Health and Social Care. (2026, January 27). Nutrient profiling model 2018.
- Ministry of Food and Drug Safety, Republic of Korea. (n.d.). Food Labeling System.
This Report Addresses
- What is the Healthy Fruit and Vegetable Chips Market worth in 2026, and what value is forecast for 2036?
- Which demand, nutrition, processing; purchasing; and operating pressures shape the market?
- Why do Fruit Chips, Baked Chips, and Supermarkets & Hypermarkets lead their segments?
- How do country growth rates and retail conditions differ across the profiled markets?
- Which companies are profiled, and what determines competitive credibility?
- What scope boundary, evidence base, segmentation; and methodology support the assessment?
What does the Healthy Fruit and Vegetable Chips Market cover?
Finished packaged fruit, vegetable, potato; root; cassava; taro; legume; and mixed-produce chips positioned within the healthy or better-for-you snack set.
The Healthy Fruit and Vegetable Chips Market covers revenue from finished packaged chips sold through the defined Product, Processing Method, Distribution Channel; End User; Nature; and Region universe. Commercial value is attached to the packaged snack product rather than to raw produce; processing equipment; packaging components; or downstream retail services.
The market differs from general produce and conventional snack spending because the product must combine a fruit, vegetable, root; legume; or mixed-produce base with the chip format and a healthy or better-for-you market position.
What is included in the scope?
Finished packaged produce-based chips sold within the stated product, processing, channel; end-user; nature; and regional framework.
Coverage includes fruit chips and other finished chips based on vegetables, potato, roots; cassava; taro; legumes; or mixed-produce blends. It includes baked products and the wider processing routes; retail channels; end-user categories; nature categories; and regions defined in the report. Revenue is counted at the finished packaged-product level.
What is excluded from the scope?
Raw produce, processing equipment, packaging components; conventional snacks outside the defined boundary; and downstream service revenue are excluded.
The scope excludes unprocessed fruit and vegetables, standalone ingredients, dehydration or baking equipment; packaging sold separately; and retailer or foodservice service markups. Products that do not fit the stated produce-based chip and healthy or better-for-you boundary remain outside the assessment.
How was the analysis built?
- Primary Research
- Primary research includes structured discussions with manufacturers, brand owners, processors; ingredient and packaging suppliers; distributors; retailers; foodservice buyers; institutional procurement teams; and subject-matter specialists. Interviews test product definitions; buying criteria; channel economics; formulation trade-offs; supply constraints; pricing; and adoption conditions. Product-positioning choices also matter in the fruit and vegetable powder and food retail markets.
- Desk Research
- Desk research reviews official nutrition and labeling rules, government dietary guidance, company filings and newsrooms; product documentation; trade and retail evidence; and peer-reviewed processing literature. Evidence is screened for direct relevance to the defined market; company; country; and revenue boundary.
- Market-Sizing and Forecasting
- Market estimates reconcile the 2026 value with product and company revenue indicators, channel sell-through, category availability; price and pack architecture; processing economics; regulatory conditions; and country-level demand through 2036. The model uses a hybrid bottom-up and top-down approach within the stated finished-product boundary.
- Data Validation and Update Cycle
- Findings are cross-checked across source types and tested for consistency with the market values, segment shares, country CAGRs; company coverage; and scope definition. Validation also reviews whether qualitative conclusions follow the stated product; channel; and country logic without adding adjacent revenue.
Segmentation
What is the report’s scope and coverage?
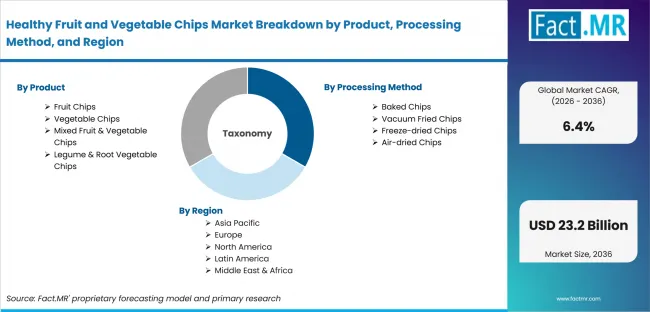
Healthy Fruit And Vegetable Chips Market Breakdown By Product, Processing Method, And Region | Source: Fact.MR
| Attribute | Details |
|---|---|
| Quantitative Units | USD 12.5 Billion in 2026 to USD 23.2 Billion by 2036 at 6.4% CAGR |
| Market Definition | Revenue from finished packaged chips whose material base is fruit, vegetable, potato; root; cassava; taro; legume; or a mixed-produce blend and that are positioned within the healthy or better-for-you snack set. |
| Product | Fruit Chips; additional fruit, vegetable, potato; root; cassava; taro; legume; and mixed-produce formats within the defined market boundary |
| Processing Method | Baked Chips; additional processing routes covered within the defined market boundary |
| Distribution Channel | Supermarkets & Hypermarkets; additional retail and digital routes covered within the defined market boundary |
| End User | End-user categories defined in the full report taxonomy |
| Nature | Nature categories defined in the full report taxonomy |
| Regions Covered | North America; Latin America; Western Europe; Eastern Europe; East Asia; South Asia and Pacific; Middle East and Africa |
| Countries Covered | USA; Germany; UK; Japan; France; Canada; South Korea |
| Key Companies Profiled | Bare Snacks; Sensible Portions; The Hain Celestial Group; Calbee, Inc.; PepsiCo, Inc.; General Mills; Inc.; Rhythm Superfoods; Tyrells; Terra Chips; Greenday Foods |
| Forecast Period | 2026 to 2036 |
| Approach | Hybrid bottom-up and top-down sizing that reconciles product-level revenue, channel availability, company disclosures; trade and regulatory context; processing economics; and country-level demand conditions within the defined market boundary. |
Source: Fact.MR analysis. Updated Aug 3, 2026
How is the market segmented?
-
By Product:
- Fruit Chips
- Apple Chips
- Banana Chips
- Mango Chips
- Vegetable Chips
- Potato Chips
- Beetroot Chips
- Carrot Chips
- Mixed Fruit & Vegetable Chips
- Blend Packs
- Exotic Mixes
- Seasonal Mixes
- Legume & Root Vegetable Chips
- Sweet Potato Chips
- Taro Chips
- Cassava Chips
- Fruit Chips
-
By Processing Method:
- Baked Chips
- Hot Air Baking
- Oven Baking
- Low-fat Baking
- Vacuum Fried Chips
- Low-temperature Frying
- Oil-controlled Frying
- Crispy Texture Processing
- Freeze-dried Chips
- Fruit Freeze-drying
- Vegetable Freeze-drying
- Crunch Preservation
- Air-dried Chips
- Dehydrated Fruit Chips
- Dehydrated Vegetable Chips
- Natural Drying
- Baked Chips
-
By Distribution Channel:
- Supermarkets & Hypermarkets
- Hypermarkets
- Supermarkets
- Modern Grocery Chains
- Convenience Stores
- Neighborhood Stores
- Fuel Station Stores
- Mini Markets
- Online Retail
- E-commerce Platforms
- Brand Websites
- Quick Commerce
- Health Food Stores
- Organic Stores
- Specialty Nutrition Stores
- Wellness Retailers
- Supermarkets & Hypermarkets
-
By End User:
- Retail Consumers
- Adults
- Children
- Health-conscious Consumers
- Foodservice
- Cafés
- Airlines
- Hotels & Restaurants
- Institutional Buyers
- Schools
- Hospitals
- Corporate Cafeterias
- Retail Consumers
-
By Nature:
- Conventional
- Standard Products
- Value Packs
- Mainstream Retail
- Organic
- USDA Organic
- Non-GMO
- Clean-label Products
- Functional & Fortified
- High-fiber Chips
- Protein-enriched Chips
- Vitamin-fortified Chips
- Conventional
-
By Region:
- North America
- Latin America
- Western Europe
- Eastern Europe
- East Asia
- South Asia and Pacific
- Middle East & Africa
Frequently Asked Questions
What is the Healthy Fruit and Vegetable Chips Market worth in 2026?
What is the market forecast to reach by 2036?
What CAGR is projected from 2026 to 2036?
Which Product leads the market?
Which Processing Method leads the market?
Which Distribution Channel leads the market?
Which country records the highest listed CAGR?
How does France perform through 2036?
How does South Korea perform through 2036?
How does the USA perform through 2036?
What is the primary driver in the market?
What is the clearest opportunity in the market?
What is the main restraint in the market?
Who worked on this report


Preview the report firsthand - request a free sample
Free SampleGet the brochure for pricing and purchase details
Download PDF