Human Complement C3 Protein Market Size, Share, Growth and Forecast (2026 - 2036)
The Human Complement C3 Protein Market is segmented by Product Type, Formulation Type, Purity Level, Disease Research Area, Application, End User and Region. Forecast for 2026 to 2036.
Fact.MR is of the opinion that the Human Complement C3 Protein Market is entering a precision immunology expansion phase, where accelerating complement-targeted therapeutic research and rising autoimmune and renal disease investigations are shifting demand toward high-purity recombinant C3 proteins and advanced complement pathway research reagents.
Human Complement C3 Protein Market Overview, Growth Outlook, and Forecast by Fact.MR
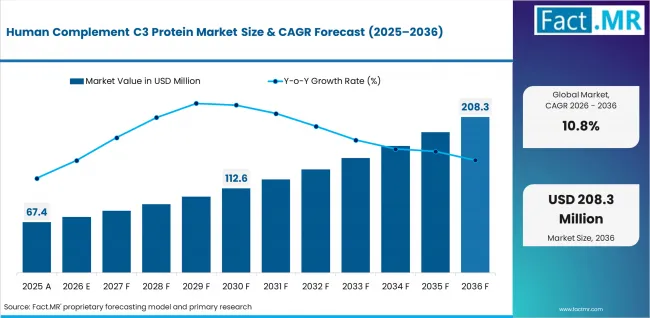
- Global Human Complement C3 Protein Market revenue stood at USD 67.4 Mn in 2025 and is forecast to reach USD 208.3 Mn by 2036.
- At a 10.8% CAGR from 2026 to 2036.
Summary of the Human Complement C3 Protein Market
- Market Snapshot
- Global human complement C3 protein market revenue stood at USD 67.4 Mn in 2025 and is forecast to reach USD 208.3 Mn by 2036.
- At a 10.8% CAGR from 2026 to 2036, this market is set to expand ~2.8x in value, adding USD 134 Mn in absolute opportunity.
- Growth is being driven by increasing adoption of complement pathway research tools across immunology, autoimmune disease, oncology, and infectious disease studies.
- Rising focus on immune system modulation, precision therapeutics, and complement-targeted drug development is accelerating demand for high-purity human complement C3 proteins. Advancements in recombinant protein production, disease biomarker research, and translational immunology are further supporting market expansion globally.
- Demand and Growth Drivers
- Increasing prevalence of autoimmune and inflammatory disorders is driving demand for complement pathway research proteins.
- Growing investment in immunology and precision medicine research is supporting adoption of human complement C3 proteins across academic and pharmaceutical sectors.
- Expansion of complement-targeted therapeutic development programs is accelerating use of purified and recombinant C3 proteins.
- Rising focus on infectious disease research and immune response studies is increasing demand for high-quality research-grade complement proteins.
- Need for solutions that provide:
- High-purity immune pathway research proteins
- Reliable complement activation and biomarker analysis
- Support for therapeutic discovery and translational research
- Enhanced reproducibility in immunology and disease studies
- Product and Segment View
- Native human complement C3 protein holds 34% of product type share in 2025, emerging as the leading segment due to extensive use in immunology and complement pathway studies.
- Recombinant human complement C3 protein accounts for 46% share, while C3 fragments & activated forms represent 20%.
- Lyophilized protein formulations hold 62% share by formulation type, positioning them as the dominant segment driven by improved storage stability and laboratory convenience.
- Liquid protein preparations account for 38% share.
- Research-grade protein holds 48% share by purity level, supported by increasing use in academic and preclinical research applications.
- Ultra-pure protein represents 34% share, while GMP/clinical-grade protein accounts for 18%.
- Autoimmune disorders hold 31% share by disease research area, reflecting strong demand for complement-related inflammation and immune dysfunction studies.
- Renal diseases account for 24% share, while infectious diseases contribute 18%.
- Geography and Competitive Outlook
- Growth is supported across North America, Europe, and Asia Pacific driven by increasing investments in immunology research and complement-based therapeutic development.
- Key growth markets and CAGR include: U.S. 9.8%, Germany 10.1%, U.K. 10.3%, Japan 10.6%, China 11.4%, India 12.2%, and South Korea 12.8%.
- Market expansion is closely tied to:
- Increasing deployment of complement-targeted therapeutic research
- Expansion of autoimmune and inflammatory disease studies
- Rising investment in translational immunology and precision medicine research
- Key companies active in this market include Merck KGaA, Thermo Fisher Scientific, Abcam plc, Creative Biomart, and Complement Technology Inc.
- Analyst Opinion
- Shambhu Nath Jha, Principal Consultant at Fact.MR, says, “The Human Complement C3 Protein Market is no longer defined solely by conventional immunology reagent demand and limited academic research applications. Growth is increasingly driven by expanding complement-targeted therapeutic development, advancements in recombinant protein engineering technologies, rising autoimmune and renal disease research activity, and increasing adoption of high-purity complement proteins in biomarker discovery, drug screening, diagnostic assay development, and precision immunology applications across pharmaceutical, biotechnology, academic research, and clinical diagnostic sectors.
Human Complement C3 Protein Market— At a Glance
| Attribute | Details |
|---|---|
| Market Value 2025 | USD 67.4 Mn |
| Market Value 2036 | USD 208.3 Mn |
| Absolute Dollar Opportunity 2025–2036 | USD 134 Mn |
| Total Growth 2025–2036 | 209.0% |
| CAGR 2026–2036 | 10.8% |
| Growth Multiple | ~2.8x |
| Key Demand Theme | Increasing adoption of complement pathway research and immune-targeted therapeutic development |
| Leading Segment by Product Type (2026) | Recombinant Human Complement C3 Protein |
| Segment Share (2026) | 46% |
| Leading Segment by Formulation Type (2026) | Lyophilized Protein |
| Segment Share (2026) | 62% |
| Leading Segment by Purity Level (2026) | Research-Grade Protein |
| Segment Share (2026) | 48% |
| Leading Segment by Disease Research Area (2026) | Autoimmune Disorders |
| Segment Share (2026) | 31% |
| Leading Segment by Application (2026) | Immunology Research |
| Segment Share (2026) | 36% |
| Leading Segment by End User (2026) | Academic & Research Institutes |
| Segment Share (2026) | 41% |
| Key Growth Regions | North America, Europe, Asia Pacific |
| Country CAGRs | U.S. 9.8%, Germany 10.1%, U.K. 10.3%, Japan 10.6%, China 11.4%, India 12.2%, South Korea 12.8% |
| Top Companies | Merck KGaA, Thermo Fisher Scientific, Abcam, Creative Biomart, Complement Technology |
| Segmentation by Product Type | Native Human Complement C3 Protein, Recombinant Human Complement C3 Protein, C3 Fragments & Activated Forms |
| Segmentation by Formulation Type | Lyophilized Protein, Liquid Protein Preparation |
| Segmentation by Purity Level | Research-Grade Protein, Ultra-Pure Protein, GMP/Clinical-Grade Protein |
| Segmentation by Disease Research Area | Autoimmune Disorders, Renal Diseases, Infectious Diseases, Oncology Research, Neurological & Chronic Inflammatory Disorders |
| Segmentation by Application | Immunology Research, Drug Discovery & Therapeutic Development, Diagnostic & Assay Development, Cell & Molecular Biology Research |
| Segmentation by End User | Academic & Research Institutes, Pharmaceutical & Biotechnology Companies, CROs & CDMOs, Clinical & Diagnostic Laboratories |
| Segmentation by Region | North America, Latin America, Europe, Asia Pacific, Middle East & Africa |
This market is set to expand ~ 2.8x in value, adding USD 134 Mn in absolute opportunity. This represents a precision immunology research expansion rather than a conventional recombinant protein market evolution, driven by increasing complement system research activity, rising prevalence of autoimmune and renal disorders, accelerating development of complement-targeted therapeutics, and growing adoption of high-purity recombinant proteins in drug discovery and biomarker studies.
Growth momentum is expected to remain strong due to expanding investments in immunology and inflammation research, increasing utilization of complement proteins in diagnostic assay development, and rapid advancements in recombinant protein engineering and purification technologies, although factors such as high production costs, complex protein stabilization requirements, limited large-scale manufacturing capabilities, and stringent regulatory and quality validation standards may moderate commercialization potential across certain research and clinical application areas.
Key Growth Drivers, Constraints, and Opportunities
Key Factors Driving Growth
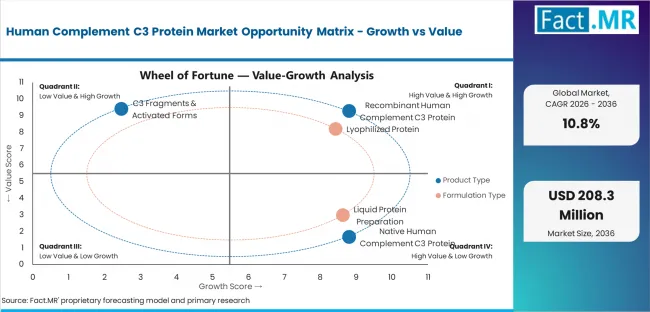
- The rising demand for complement-targeted therapies and precision immunology research is expected to drive the global demand for Human Complement C3 proteins, driven by increased prevalence of autoimmune diseases, renal disorders research, and inflammatory disease studies.
- There will be an increase in demand for high purity complement proteins, novel expression methods, and well-characterized complement proteins compatible with assays with improved stability and functionality.
- Increased adoption of Human Complement C3 proteins in research, assay development, pharmaceutical R&D, biomarker research, and complement therapy research is expected to drive market growth.
| Growth Driver | Demand Impact | Time Horizon | Key Impact Area | Fact.MR Insight |
|---|---|---|---|---|
| Rising demand for complement-targeted therapeutics | High | Short-Mid Term | Precision immunology and drug discovery | Complement pathway modulation research is accelerating demand for C3 proteins |
| Increasing prevalence of autoimmune and renal disorders | High | Short-Mid Term | Disease research expansion | Growing disease burden is supporting broader complement biology investigations |
| Expansion of diagnostic and biomarker research applications | High | Mid-Long Term | Assay development and clinical research | Researchers are integrating C3 proteins into advanced diagnostic and biomarker platforms |
| Advancements in recombinant protein engineering and purification technologies | Medium-High | Mid-Long Term | Protein quality and scalability | Improved production technologies are enhancing reproducibility and commercial viability |
| Growing investment in immunology and inflammation research | Medium | Short-Mid Term | Commercialization and innovation | Strategic research funding is accelerating complement-based therapeutic and assay development |
Key Market Constraints
- Increasing expenses in production and purification of complement proteins, validating their quality, and cold chain logistics facilities are some factors that could act as potential barriers to their commercialization.
- The adoption may be hampered by the problems faced during protein stabilization, batch-to-batch reproducibility, purification processes, and lack of large-scale production capacities.
- Regulatory compliances, difficulties in developing standardization techniques, and insufficient knowledge about complement-based research may impede market expansion.
Key Opportunity Areas
- The increasing demand in immunology research, autoimmune diseases research, nephrology research, biomarker identification research, and complement therapy discovery represents a major opportunity for companies manufacturing Human Complement C3 proteins.
- Opportunities exist through the application of Human Complement C3 proteins in precision medicine research, inflammatory diseases research, companion diagnostic tools, and next generation drug screens.
- The investments made in engineering complement proteins, scaling up expression of complement proteins, and complement biology innovation can result in huge commercial returns.
Segment-wise Analysis of the Human Complement C3 Protein Market
- By 2026, Immunology Research accounts for a 36% market share of the application segment due to increasing complement pathway investigations, rising autoimmune and inflammatory disease research activities, growing utilization of complement proteins in biomarker discovery and immune profiling, and expanding adoption of Human Complement C3 proteins in translational immunology and therapeutic development programs globally.
- Recombinant Human Complement C3 Protein represents a 46% market share of the product type segment by 2026, driven by increasing demand for high-purity and reproducible recombinant proteins, broader applicability across drug discovery and diagnostic assay development, growing investments in recombinant protein engineering technologies, and rising commercialization of standardized complement research reagents worldwide.
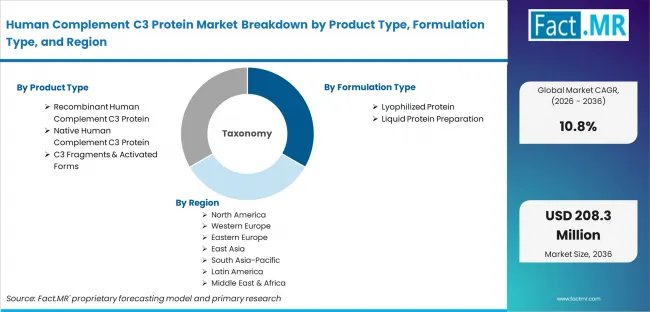
The segmentation of the Human Complement C3 Protein Market includes product type, formulation type, purity level, disease research area, application, end user, and region.
Which Product Type Dominates the Human Complement C3 Protein Market?
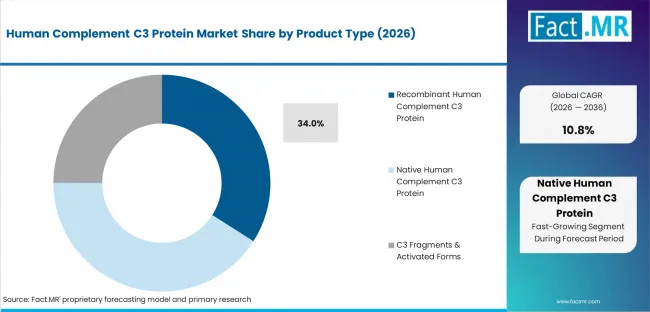
The share of Recombinant Human Complement C3 Protein in the Human Complement C3 Protein market is 46%. This can be attributed to the rise in demand for highly reproducible and high-quality recombinant proteins for immunology research, drug discovery, and diagnostic assay development. The growth of the market is due to technological advancements in recombinant protein engineering technologies, increased usage in complement targeted therapeutic research, and increased application in biomarker discovery and precision immunology.
Which Formulation Type Dominates the Human Complement C3 Protein Market?
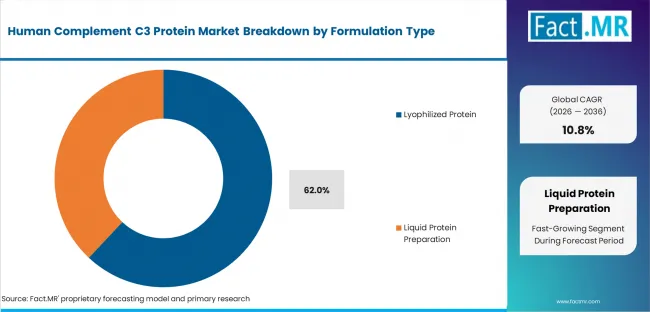
The Lyophilized Protein market is estimated to have a market share of 62% in the Human Complement C3 Protein Market. Superior storage stability, long shelf life, ease of global transportation, and minimal chances of protein degradation make it a favorite among end users. Increasing demand for effective reagent preservation, research activities in various laboratories, and commercialization of high stability recombinant complement proteins will drive market growth.
Which Purity Level Dominates the Human Complement C3 Protein Market?
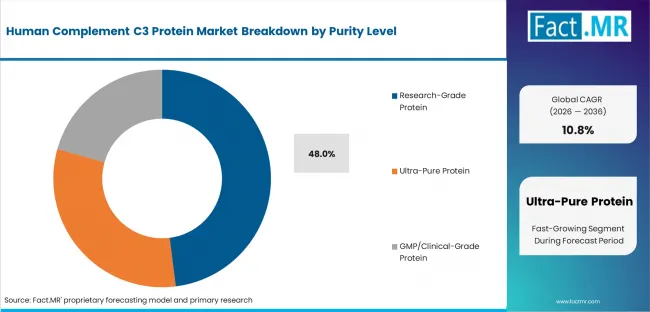
The share of Research Grade Protein in the Human Complement C3 Protein market is 48%. Extensive use in academic research, immunology research, complement pathway investigation, and drug discovery applications are some key factors behind the dominance of this segment. Rising research funding in autoimmune diseases, complement biology research, and increasing demands from biotech and pharma companies for low-cost protein reagents will drive market growth.
Which Disease Research Area Dominates the Human Complement C3 Protein Market?
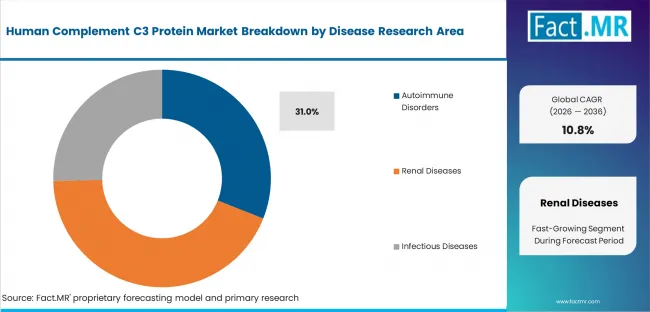
The market for Autoimmune Disorders is expected to account for 31% of the Human Complement C3 Protein market. High prevalence of lupus, rheumatoid arthritis, vasculitis, and other complement mediated inflammatory disorders in the population is the key factor driving the segment. Growing interest in complement targeting therapeutics, complement-based biomarker research, and complement proteins in the field of autoimmune disease diagnostics will propel market growth.
Which Application Dominates the Human Complement C3 Protein Market?
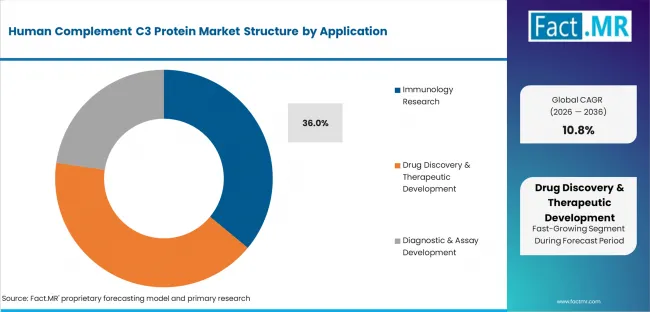
Increasing complement pathway studies, rising number of inflammatory disease studies, and usage of Human Complement C3 proteins in immune response and biomarker discovery is responsible for the 36% share of Immunology Research in the Human Complement C3 Protein market. Market growth can be driven through rising investment in translational immunology programs and therapeutic research and usage of complement proteins in advanced immune profiling technologies.
Regional Outlook Across Key Markets
The market analysis covers key global regions, including South Asia and Pacific, Middle East & Africa, North America, Latin America, Western Europe, and Eastern Europe. It is segmented geographically, with specific market dynamics for each region. The full report provides a detailed market attractiveness analysis.
.webp)
CAGR Table
| Country | CAGR (%) |
|---|---|
| U.S. | 9.8% |
| Germany | 10.1% |
| U.K. | 10.3% |
| Japan | 10.6% |
| China | 11.4% |
| India | 12.2% |
| South Korea | 12.8% |
Source: Fact.MR (FMR) analysis, based on proprietary forecasting model and primary research.
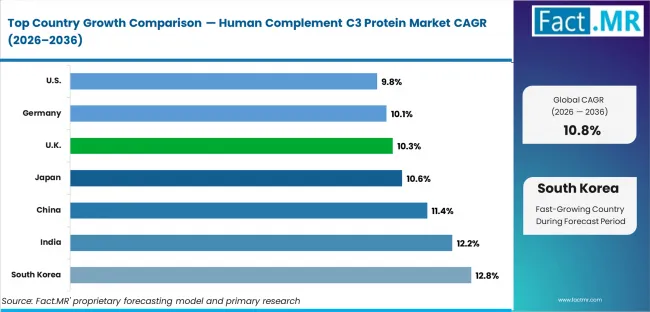
North America: The Global Precision Immunology Innovation Hub
North America represents the leading commercialization and research center for Human Complement C3 proteins, supported by advanced biotechnology ecosystems, strong pharmaceutical R&D investments, and large-scale autoimmune disease research programs. Major industry participants including Thermo Fisher Scientific, Bio-Techne Corporation, and Danaher Corporation (Cytiva/Beckman Coulter) maintain strong competitive positioning through recombinant protein portfolios, immunology assay technologies, and complement research collaborations. Regional demand is further supported by precision medicine initiatives and increasing complement therapeutics development activity.
- U.S.: Demand for Human Complement C3 proteins in the U.S. is projected to rise at 9.8% CAGR through 2036. Growth is supported by expanding complement-targeted therapeutic research and increasing translational immunology funding. In March 2025, the National Institutes of Health expanded autoimmune and inflammation research funding programs supporting complement pathway investigations and biomarker development activities [1]. Additionally, in February 2025, Thermo Fisher Scientific announced continued expansion of recombinant protein manufacturing capabilities and immunology assay solutions for pharmaceutical research applications [2].
Western Europe: The Regulatory and Translational Research Stronghold
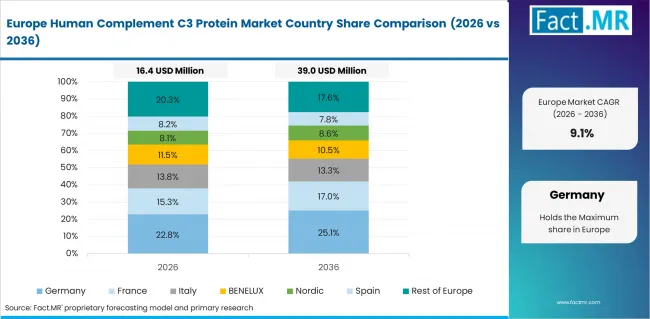
Western Europe remains a major center for complement biology research and clinical immunology innovation, supported by strong regulatory frameworks, public healthcare research funding, and growing autoimmune disease studies. Leading companies including Merck KGaA, Abcam plc, and Sartorius AG maintain strong regional presence through recombinant protein technologies and advanced assay development platforms. Increasing precision medicine adoption and translational immunology collaborations continue to strengthen regional market competitiveness.
- Germany: Demand for Human Complement C3 proteins in Germany is projected to rise at 10.1% CAGR through 2036. Growth is supported by increasing investments in precision medicine and immunology research infrastructure. In February 2025, the German Research Foundation (DFG) expanded grants for inflammatory disease and complement biology studies across university research centers [3]. Additionally, in May 2025, Merck KGaA announced investments in life science production technologies supporting recombinant protein manufacturing and assay development [4].
East Asia: The Fastest-Growing Biopharmaceutical Research Region
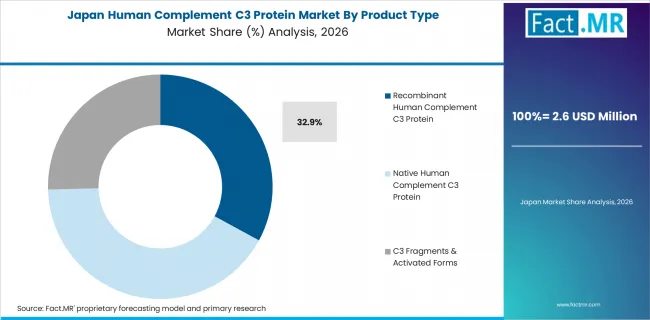
East Asia is emerging as a high-growth center for Human Complement C3 protein demand due to rapid biotechnology expansion, increasing pharmaceutical R&D investments, and growing autoimmune disease research activities. Major players including Sino Biological, ACROBiosystems, and FUJIFILM Irvine Scientific are strengthening regional competitiveness through recombinant protein innovation and advanced biologics manufacturing capabilities.
- Japan: Demand for Human Complement C3 proteins in Japan is projected to rise at 10.6% CAGR through 2036. Growth is supported by strong precision medicine adoption and increasing inflammatory disease research. In January 2025, the Japan Agency for Medical Research and Development expanded funding for immune pathway biomarker and complement research initiatives [5]. Additionally, in March 2025, FUJIFILM Irvine Scientific enhanced biologics and recombinant protein production support capabilities for pharmaceutical research customers [6].
- China: Demand for Human Complement C3 proteins in China is projected to rise at 11.4% CAGR through 2036. Market growth is driven by rapid biotechnology commercialization and increasing domestic recombinant protein production. In April 2025, the Ministry of Science and Technology of China expanded life science and precision medicine funding programs involving immune pathway research [7]. Additionally, in February 2025, Sino Biological strengthened recombinant protein manufacturing and immunology assay development capabilities targeting global research markets [8].
- South Korea: Demand for Human Complement C3 proteins in South Korea is projected to rise at 12.8% CAGR through 2036. Growth is supported by increasing biologics R&D investments and government-backed biotechnology innovation programs. In March 2025, the Ministry of Health and Welfare expanded funding support for precision immunology and inflammatory disease research initiatives [9]. Additionally, in May 2025, Celltrion strengthened biologics research infrastructure and advanced therapeutic development capabilities [10].
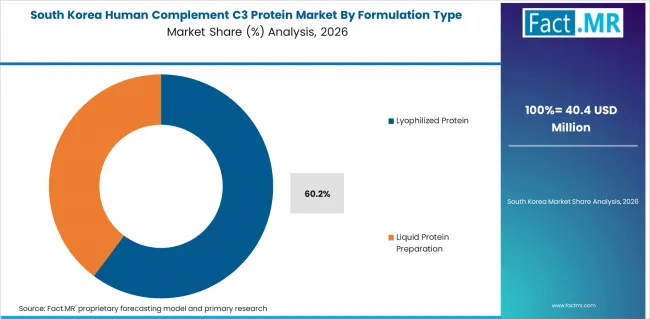
Fact.MR’s analysis of the Human Complement C3 Protein Market provides comprehensive regional and country-wise assessment across North America, Western Europe, East Asia, Latin America, South Asia & Pacific, Eastern Europe, and Middle East & Africa. Readers can find detailed insights on regional growth outlook, recombinant protein demand trends, complement therapeutics research activity, biotechnology investments, immunology innovation, and precision medicine commercialization opportunities shaping the global market through 2036.
Competitive Benchmarking and Company Positioning
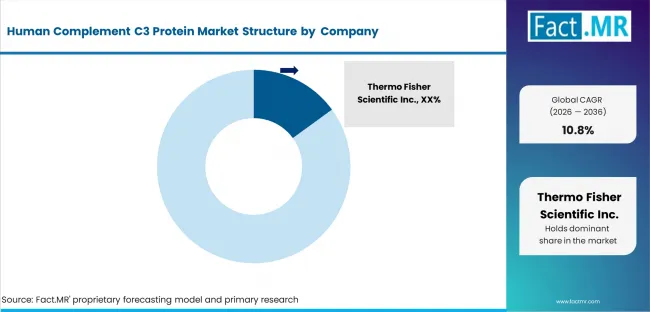
Leading Companies Shaping the Human Complement C3 Protein Market
The Human Complement C3 Protein Market is moderately fragmented with the major players competing based on purity of the proteins, the reproducibility of the assays and the technical validation. Benefits to large companies include vertically integrated manufacturing, international distribution systems, extensive immunology portfolios, and robust immunology research partnerships. Specialized companies like Sino Biological, Inc. and ACROBiosystems compete by introducing recombinant protein innovations and developing customized services. Consistency, proven function and multi-supplier sourcing strategies are top priorities for buyers, which puts a brake on pricing power and drives the premium recombinant protein capabilities of suppliers.
Key Players of the Human Complement C3 Protein Market
- Thermo Fisher Scientific Inc.
- Bio-Techne
- Merck KGaA
- Abcam Limited
- Proteintech Group
- Sino Biological, Inc.
- ACROBiosystem
- CUSABIO TECHNOLOGY LLC
- Elabscience® Bionovation Inc.
- MedChemExpress
- Abnova Corporation
- RayBiotech, Inc.
- BioLegend, Inc.
- Prospec-Tany Technogene Ltd.
- OriGene Technologies, Inc.
- MyBioSource
- Enzo Biochem Inc.
- Boster Biological Technology
Recent Industry Developments
- Thermo Fisher Scientific Inc. announces acquisition of Solventum’s Purification & Filtration business (February 2025): Thermo Fisher Scientific entered into a definitive agreement to acquire Solventum’s Purification & Filtration business for approximately USD 4.1 billion to strengthen its bioprocessing and recombinant protein purification capabilities supporting biologics and immunology research applications.
- Thermo Fisher Scientific’s Olink platform selected for UK Biobank Pharma Proteomics Project (January 2025): Thermo Fisher Scientific announced that its Olink proteomics platform was selected for the UK Biobank Pharma Proteomics Project to support large-scale protein biomarker discovery and precision medicine research involving human proteome analysis.
- Sino Biological launches ProPure™ endotoxin-free recombinant protein platform in the U.S. (July 2025): Sino Biological introduced its ProPure™ endotoxin-free recombinant protein line manufactured at its Houston-based Center for Bioprocessing facility to support immunology research, vaccine development, cell therapy, and therapeutic protein manufacturing applications. The launch strengthens the company’s position in high-purity recombinant protein commercialization and advanced immune research solutions.
Sources and Research References
- [1] National Institutes of Health (NIH), “NIH Autoimmune, Inflammation, and Precision Medicine Research Funding Programs,” March 2025
- [2] Thermo Fisher Scientific Inc., “Thermo Fisher Scientific Expands Bioprocessing and Immunology Research Capabilities,” February 2025
- [3] German Research Foundation (DFG), “Expanded Research Grants for Inflammatory Disease and Complement Biology Studies,” February 2025
- [4] Merck KGaA, “Merck Expands Life Science Production Technologies and Research Infrastructure,” May 2025
- [5] Japan Agency for Medical Research and Development (AMED), “Funding Expansion for Complement Research and Immune Biomarker Studies,” January 2025
- [6] FUJIFILM Irvine Scientific, “Expansion of Biologics and Recombinant Protein Production Support Solutions,” March 2025
- [7] Ministry of Science and Technology of China, “Precision Medicine and Life Science Innovation Funding Expansion,” April 2025
- [8] Sino Biological, Inc., “Expansion of Recombinant Protein Manufacturing and Immunology Assay Development,” February 2025
- [9] Ministry of Health and Welfare, South Korea, “Funding Support for Precision Immunology and Inflammatory Disease Research,” March 2025
- [10] Celltrion, “Expansion of Biologics Research and Advanced Therapeutic Development Infrastructure,” May 2025
- [11] Thermo Fisher Scientific Inc., “Thermo Fisher Scientific to Acquire Solventum’s Purification and Filtration Business,” February 2025
- [12] Thermo Fisher Scientific Inc., “Thermo Fisher Scientific’s Olink Platform Selected for World’s Largest Human Proteome Study,” January 2025
- [13] The Scientist / Sino Biological, “Sino Biological Sets New Industry Standard with ProPure Endotoxin-Free Proteins Made in the USA,” July 2025
Human Complement C3 Protein Market Definition
The market consists of human complement C3 protein which is either purified native, recombinant, or activated, employed in immunological research, drug discovery, diagnostic assays, and biomarker studies. Human complement C3 protein is an important protein involved in the regulation of immune and inflammatory response in the human immune complement system. These Human complement C3 proteins find major applications in the study of autoimmune diseases, kidney ailments, infectious diseases, and complement targeted drugs.
Human Complement C3 Protein Market Inclusions
The report provides estimates and forecasts for the global and regional market size and volume from 2026 to 2036. Segmentation by product type, formulation type, purity type, disease research area, application, end-user, and geography is covered in the report. Further, the report includes information regarding competition, pricing trends, technological innovations, funding trends, and other emerging opportunities in Human Complement C3 protein related research applications.
Human Complement C3 Protein Market Exclusions
The scope of the report excludes other broad categories of complement pathway related products such as complement inhibitors, antibodies, cytokines, and other immune proteins, except where applicable to the Human Complement C3 protein. Also excluded are therapeutics and finished diagnostic kits, general laboratory supplies, and complement proteins apart from Human Complement C3 protein.
Human Complement C3 Protein Market Research Methodology
- Primary Research
- Insights into the industry were gathered through one-on-one discussions and expert panel discussions involving recombinant protein manufacturers, immunologists, biotech professionals, lab purchasing managers, CROs, and clinical diagnostics experts.
- Desk Research
- Primary information sources for the report include scientific journals, annual reports of companies, SEC filings, product catalogs, company investor presentations, regulatory publications, trade sources, research funding details, and immunology industry white papers. Additionally, the report analyzes complement pathways, scientific research studies on complement pathways, biotechnology market reports, and trends related to protein reagents commercialization.
- Market-Sizing and Forecasting
- The report is based on Fact.MR's proprietary methodology that uses both top-down and bottom-up approaches to estimate market values. The forecasting was done by analyzing market penetration levels, usage patterns of recombinant proteins, rising research fundings, complement pathway therapeutics pipeline, and biotechnology infrastructure.
- Data Validation and Update Cycle
- Market numbers have been verified through the use of triangulation method using expert views, supplier validation, revenues of leading companies, and industry-level analysis. Market forecasts and estimates will be updated on regular basis considering latest trends and advances in the complement biology ecosystem.
Scope of Analysis

| Parameter | Details |
|---|---|
| Quantitative Units | USD 67.4 million in 2025 to USD 208.3 million in 2036, at a CAGR of 10.8% |
| Market Definition | The Human Complement C3 Protein Market comprises purified and recombinant complement C3 proteins used in immunology research, biomarker studies, diagnostic assays, and complement-targeted therapeutic development across pharmaceutical, biotechnology, and clinical research applications. |
| Regions Covered | North America, Latin America, Europe, East Asia, South Asia and Pacific, MiddleEastand Africa |
| Countries Covered | USA, Canada, UK, Germany, China, India, 30 plus countries |
| Key Companies | Thermo Fisher Scientific Inc., Bio-Techne, Merck KGaA, Abcam Limited, Proteintech Group, Sino Biological, Inc., ACROBiosystem, CUSABIO TECHNOLOGY LLC |
| Forecast Period | 2026 to 2036 |
| Approach | Hybrid demand-side and top-downmethodologybuilt on country-level application demand, product benchmarking, pricing analysis, shipment validation, and primary interviews across manufacturers, distributors, retailers, and end users |
Analysis by Product Type, by Formulation Type, by Purity Level, by Disease Research Area, by Application, by End User and by Region
-
Human Complement C3 Protein Market by Product Type:
- Native Human Complement C3 Protein
- Plasma-Derived Human C3 Protein
- Purified Serum-Derived Human C3 Protein
- Full-Length Functional Native C3
- Recombinant Human Complement C3 Protein
- Mammalian Cell-Expressed Recombinant C3
- HEK293-Derived Recombinant C3
- CHO Cell-Derived Recombinant C3
- Insect Cell-Expressed Recombinant C3
- C3 Fragments & Activated Forms
- C3a Protein
- C3b Protein
- iC3b Protein
- C3c Protein
- C3d Protein
- C3(H2O) Protein
- Native Human Complement C3 Protein
-
Human Complement C3 Protein Market by Formulation Type:
- Lyophilized Protein
- Carrier-Free Lyophilized
- Stabilized Lyophilized
- Buffered Lyophilized
- Liquid Protein Preparation
- Ready-to-Use Liquid
- Concentrated Stock Solution
- Buffered Aqueous Solution
- Lyophilized Protein
-
Human Complement C3 Protein Market by Protein Purity Level:
- Research-Grade Protein
- Standard Purity (<95%)
- High Purity (95–98%)
- Ultra-Pure Protein
- 98% Purity
- 99% Purity
- GMP/Clinical-Grade Protein
- GMP-Manufactured
- Preclinical/Clinical Development Grade
- Research-Grade Protein
-
Human Complement C3 Protein Market by Disease Research Area
- Autoimmune Disorders
- Systemic Lupus Erythematosus (SLE)
- Rheumatoid Arthritis
- Vasculitis
- Autoimmune Hemolytic Disorders
- Renal Diseases
- Complement 3 Glomerulopathy (C3G)
- IgA Nephropathy
- Atypical Hemolytic Uremic Syndrome (aHUS)
- Lupus Nephritis
- Infectious Diseases
- Bacterial Infection Research
- Viral Infection Research
- Sepsis Studies
- Emerging Infectious Disease Research
- Oncology Research
- Tumor Immunology
- Cancer Inflammation Studies
- Immuno-Oncology Biomarker Research
- Neurological & Chronic Inflammatory Disorders
- Alzheimer’s Disease Research
- Multiple Sclerosis Research
- Neuroinflammation Studies
- Autoimmune Disorders
-
Human Complement C3 Protein Market by Application
- Immunology Research
- Complement Cascade Studies
- Innate Immunity Research
- Inflammatory Response Studies
- Host-Pathogen Interaction Research
- Drug Discovery & Therapeutic Development
- Complement Inhibitor Screening
- Target Validation Studies
- Biologic Drug Development
- Autoimmune Drug Research
- Diagnostic & Assay Development
- ELISA Development
- Biomarker Assay Development
- Clinical Diagnostic Kit Development
- Reference Standard Calibration
- Cell & Molecular Biology Research
- Signal Transduction Studies
- Protein Interaction Studies
- Functional Cell Assays
- Gene Expression Studies
- Immunology Research
-
Human Complement C3 Protein Market by End User
- Academic & Research Institutes
- Pharmaceutical & Biotechnology Companies
- CROs & CDMOs
- Clinical & Diagnostic Laboratories
-
Human Complement C3 Protein Market by Region
- North America
- USA
- Canada
- Mexico
- Latin America
- Brazil
- Chile
- Rest of LATAM
- East Asia
- China
- Japan
- South Korea
- Western Europe
- Germany
- Italy
- France
- U.K.
- Spain
- BENELUX
- Nordic
- Rest of W. Europe
- Eastern Europe
- Russia
- Hungary
- Poland
- Balkan & Baltics
- Rest of E. Europe
- South Asia & Pacific
- India
- ASEAN
- ANZ
- Rest of SAP
- Middle East and Africa
- Kingdom of Saudi Arabia
- United Arab Emirates
- South Africa
- Rest of Middle East and Africa
- North America
- Frequently Asked Questions -
How large is the demand for Human Complement C3 Protein in the global market in 2026?
Demand for Human Complement C3 Protein in the global market is estimated to be valued at USD 74.7 million in 2026.
What will be the market size of Human Complement C3 Protein in the global market by 2036?
The market size for Human Complement C3 Protein is projected to reach USD 208.3 million by 2036.
What is the expected demand growth for Human Complement C3 Protein in the global market between 2026 and 2036?
Demand for Human Complement C3 Protein in the global market is expected to grow at a CAGR of 10.8% between 2026 and 2036, driven by increasing immunology research and rising adoption in diagnostic and therapeutic applications.
Which product type is expected to dominate the market?
Recombinant Human Complement C3 Protein is expected to dominate the market, accounting for 46% of the market share in 2026, supported by its broad use in biomedical research and assay development.
What is the growth outlook for China in this report?
China is anticipated to grow at a CAGR of 11.4%, supported by expanding immunology research activities and growth in biotechnology manufacturing capabilities.
What is the growth outlook for Japan in this market?
Japan is expected to grow at a CAGR of 10.6%, driven by advancements in precision medicine and increasing focus on immune system disorder research.
Which company is identified as a leading player in the Human Complement C3 Protein market?
Thermo Fisher Scientific Inc. is recognized as a leading player in this market, offering recombinant proteins, antibodies, and immunology research solutions.
Table of Content
- Human Complement C3 Protein Market – Executive Summary
- Market Overview
- Market Definition & Introduction
- Market Taxonomy & Research Scope
- Global Human Complement C3 Protein Market Demand Analysis 2021-2025 and Forecast, 2026–2036
- Historical Market Volume (Kg) Analysis, 2021-2025
- Current and Future Market Volume (Kg) Projections, 2026–2036
- Y-o-Y Growth Trend Analysis
- Global Human Complement C3 Protein Market - Pricing Analysis
- Product Category and Country-Level Pricing Analysis
- Region Average Pricing Analysis Benchmark
- Price Trends and Forecasts
- Historical price trends
- Future price forecasts
- Factors Influencing Pricing
- Competitive Pricing Strategies
- Global Human Complement C3 Protein Market Demand (in Value or Size in US$ Mn) Analysis 2021-2025 and Forecast, 2026–2036
- Historical Market Value (US$ Mn) Analysis, 2021-2025
- Current and Future Market Value (US$ Mn) Projections, 2026–2036
- Y-o-Y Growth Trend Analysis
- Absolute $ Opportunity Analysis
- Market Background and Foundational Data Points
- Research Reagents Market Analysis and Outlooks
- Recombinant Protein Market Growth (%)
- Complement Research Activity
- Complement Therapeutics Pipeline
- Autoimmune & Renal Disease Burden
- Immunology Research Funding
- Diagnostic Assay Adoption
- End-User Demand Patterns
- Regional Biotech & R&D Investments
- Human Complement C3 Protein Market Opportunity Assessment
- Total Available Market (US$ Mn)
- Serviceable Addressable Market (US$ Mn)
- Serviceable Obtainable Market (US$ Mn)
- Investment Feasibility Analysis
- Macro-Economic Factors & Forecast Factors - Relevance & Impact
- Market Dynamics
- Drivers
- Restraints
- Opportunity Analysis
- Key Regulations & Certifications
- Human Complement C3 Protein Market Analysis 2021-2025 and Forecast 2026–2036, By Product Type
- Introduction / Key Findings
- Historical Market Size (US$ Mn) & Volume (Kg) Trend Analysis By Product Type, 2021-2025
- Current and Future Market Size (US$ Mn) & Volume (Kg) Analysis and Forecast By Product Type, 2026-2036
- Native Human Complement C3 Protein
- Plasma-Derived Human C3 Protein
- Purified Serum-Derived Human C3 Protein
- Full-Length Functional Native C3
- Recombinant Human Complement C3 Protein
- Mammalian Cell-Expressed Recombinant C3
- HEK293-Derived Recombinant C3
- CHO Cell-Derived Recombinant C3
- Insect Cell-Expressed Recombinant C3
- C3 Fragments & Activated Forms
- C3a Protein
- C3b Protein
- iC3b Protein
- C3c Protein
- C3d Protein
- C3(H2O) Protein
- Native Human Complement C3 Protein
- Market Attractiveness Analysis By Product Type
- Human Complement C3 Protein Market Analysis 2021-2025 and Forecast 2026–2036, By Formulation Type
- Introduction / Key Findings
- Historical Market Size (US$ Mn) & Volume (Kg) Trend Analysis By Formulation Type, 2021-2025
- Current and Future Market Size (US$ Mn) & Volume (Kg) Analysis and Forecast By Formulation Type, 2026-2036
- Lyophilized Protein
- Carrier-Free Lyophilized
- Stabilized Lyophilized
- Buffered Lyophilized
- Liquid Protein Preparation
- Ready-to-Use Liquid
- Concentrated Stock Solution
- Buffered Aqueous Solution
- Lyophilized Protein
- Market Attractiveness Analysis By Formulation Type
- Human Complement C3 Protein Market Analysis 2021-2025 and Forecast 2026–2036, By Purity Level
- Introduction / Key Findings
- Historical Market Size (US$ Mn) & Volume (Kg) Trend Analysis By Purity Level, 2021-2025
- Current and Future Market Size (US$ Mn) & Volume (Kg) Analysis and Forecast By Purity Level, 2026-2036
- Research-Grade Protein
- Standard Purity (<95%)
- High Purity (95–98%)
- Ultra-Pure Protein
- 98% Purity
- 99% Purity
- GMP/Clinical-Grade Protein
- GMP-Manufactured
- Preclinical/Clinical Development Grade
- Research-Grade Protein
- Market Attractiveness Analysis By Purity Level
- Human Complement C3 Protein Market Analysis 2021-2025 and Forecast 2026–2036, By Disease Research Area
- Introduction / Key Findings
- Historical Market Size (US$ Mn) & Volume (Kg) Trend Analysis By Disease Research Area, 2021-2025
- Current and Future Market Size (US$ Mn) & Volume (Kg) Analysis and Forecast By Disease Research Area, 2026-2036
- Autoimmune Disorders
- Systemic Lupus Erythematosus (SLE)
- Rheumatoid Arthritis
- Vasculitis
- Autoimmune Hemolytic Disorders
- Renal Diseases
- Complement 3 Glomerulopathy (C3G)
- IgA Nephropathy
- Atypical Hemolytic Uremic Syndrome (aHUS)
- Lupus Nephritis
- Infectious Diseases
- Bacterial Infection Research
- Viral Infection Research
- Sepsis Studies
- Emerging Infectious Disease Research
- Oncology Research
- Tumor Immunology
- Cancer Inflammation Studies
- Immuno-Oncology Biomarker Research
- Neurological & Chronic Inflammatory Disorders
- Alzheimer’s Disease Research
- Multiple Sclerosis Research
- Neuroinflammation Studies
- Autoimmune Disorders
- Market Attractiveness Analysis By Disease Research Area
- Human Complement C3 Protein Market Analysis 2021-2025 and Forecast 2026–2036, By Application
- Introduction / Key Findings
- Historical Market Size (US$ Mn) & Volume (Kg) Trend Analysis By Application, 2021-2025
- Current and Future Market Size (US$ Mn) & Volume (Kg) Analysis and Forecast By Application, 2026-2036
- Immunology Research
- Complement Cascade Studies
- Innate Immunity Research
- Inflammatory Response Studies
- Host-Pathogen Interaction Research
- Drug Discovery & Therapeutic Development
- Complement Inhibitor Screening
- Target Validation Studies
- Biologic Drug Development
- Autoimmune Drug Research
- Diagnostic & Assay Development
- ELISA Development
- Biomarker Assay Development
- Clinical Diagnostic Kit Development
- Reference Standard Calibration
- Cell & Molecular Biology Research
- Signal Transduction Studies
- Protein Interaction Studies
- Functional Cell Assays
- Gene Expression Studies
- Immunology Research
- Market Attractiveness Analysis By Application
- Human Complement C3 Protein Market Analysis 2021-2025 and Forecast 2026–2036, By End User
- Introduction / Key Findings
- Historical Market Size (US$ Mn) & Volume (Kg) Trend Analysis by End User, 2021-2025
- Current and Future Market Size (US$ Mn) & Volume (Kg) Analysis and Forecast by End User, 2026-2036
- Academic & Research Institutes
- Pharmaceutical & Biotechnology Companies
- CROs & CDMOs
- Clinical & Diagnostic Laboratories
- Market Attractiveness Analysis by End User
- Global Human Complement C3 Protein Market Analysis and Forecast, by Region
- Introduction / Key Findings
- Historical Market Size (US$ Mn) & Volume (Kg) Trend Analysis by Region, 2021-2025
- Current and Future Market Size (US$ Mn) & Volume (Kg) Analysis and Forecast by Region, 2026-2036
- North America
- Latin America
- Western Europe
- Eastern Europe
- East Asia
- South Asia & Pacific
- Middle East & Africa
- Market Attractiveness Analysis by Region
- North America Human Complement C3 Protein Market Analysis and Forecast
- Introduction / Key Findings
- Pricing Analysis
- Historical Market Size (US$ Mn) & Volume (Kg) Trend Analysis by Market Taxonomy, 2021-2025
- Current and Future Market Size (US$ Mn) and Volume (Kg) Analysis & Forecast by Market Taxonomy, 2026-2036
- By Country
- United States
- Canada
- Mexico
- By Taxonomy
- Market Attractiveness Analysis By Country & Taxonomy
- Market Trends
- Key Market Participants – Intensity Mapping
- Drivers and Restraints - Impact Analysis
- Latin America Human Complement C3 Protein Market Analysis and Forecast
- Introduction / Key Findings
- Pricing Analysis
- Historical Market Size (US$ Mn) & Volume (Kg) Trend Analysis by Market Taxonomy, 2021-2025
- Current and Future Market Size (US$ Mn) and Volume (Kg) Analysis & Forecast by Market Taxonomy, 2026-2036
- By Country
- Brazil
- Chile
- Rest of LATAM
- By Taxonomy
- Market Attractiveness Analysis By Country & Taxonomy
- Market Trends
- Key Market Participants – Intensity Mapping
- Drivers and Restraints - Impact Analysis
- Western Europe Human Complement C3 Protein Market Analysis and Forecast
- Introduction / Key Findings
- Pricing Analysis
- Historical Market Size (US$ Mn) & Volume (Kg) Trend Analysis by Market Taxonomy, 2021-2025
- Current and Future Market Size (US$ Mn) and Volume (Kg) Analysis & Forecast by Market Taxonomy, 2026-2036
- By Country
- Germany
- Italy
- France
- United Kingdom
- Spain
- BENELUX
- Nordics
- Rest of Western Europe
- By Taxonomy
- Market Attractiveness Analysis By Country & Taxonomy
- Market Trends
- Key Market Participants – Intensity Mapping
- Drivers and Restraints - Impact Analysis
- Eastern Europe Human Complement C3 Protein Market Analysis and Forecast
- Introduction / Key Findings
- Pricing Analysis
- Historical Market Size (US$ Mn) & Volume (Kg) Trend Analysis by Market Taxonomy, 2021-2025
- Current and Future Market Size (US$ Mn) and Volume (Kg) Analysis & Forecast by Market Taxonomy, 2026-2036
- By Country
- Russia
- Hungary
- Poland
- Balkan & Baltics
- Rest of Eastern Europe
- By Taxonomy
- Market Attractiveness Analysis By Country & Taxonomy
- Market Trends
- Key Market Participants – Intensity Mapping
- Drivers and Restraints - Impact Analysis
- East Asia Human Complement C3 Protein Market Analysis and Forecast
- Introduction / Key Findings
- Pricing Analysis
- Historical Market Size (US$ Mn) & Volume (Kg) Trend Analysis by Market Taxonomy, 2021-2025
- Current and Future Market Size (US$ Mn) and Volume (Kg) Analysis & Forecast by Market Taxonomy, 2026-2036
- By Country
- China
- Japan
- South Korea
- By Taxonomy
- Market Attractiveness Analysis By Country & Taxonomy
- Market Trends
- Key Market Participants – Intensity Mapping
- Drivers and Restraints - Impact Analysis
- South Asia & Pacific Human Complement C3 Protein Market Analysis and Forecast
- Introduction / Key Findings
- Pricing Analysis
- Historical Market Size (US$ Mn) & Volume (Kg) Trend Analysis by Market Taxonomy, 2021-2025
- Current and Future Market Size (US$ Mn) and Volume (Kg) Analysis & Forecast by Market Taxonomy, 2026-2036
- By Country
- India
- ASEAN
- Australia & New Zealand
- Rest of South Asia & Pacific
- By Taxonomy
- Market Attractiveness Analysis By Country & Taxonomy
- Market Trends
- Key Market Participants – Intensity Mapping
- Drivers and Restraints - Impact Analysis
- Middle East & Africa Human Complement C3 Protein Market Analysis and Forecast
- Introduction / Key Findings
- Pricing Analysis
- Historical Market Size (US$ Mn) & Volume (Kg) Trend Analysis by Market Taxonomy, 2021-2025
- Current and Future Market Size (US$ Mn) and Volume (Kg) Analysis & Forecast by Market Taxonomy, 2026-2036
- By Country
- Kingdom of Saudi Arabia
- Other GCC Countries
- Turkiye
- South Africa
- Other African Union
- By Taxonomy
- Market Attractiveness Analysis By Country & Taxonomy
- Market Trends
- Key Market Participants – Intensity Mapping
- Drivers and Restraints - Impact Analysis
- Country-level Human Complement C3 Protein Market Analysis and Forecast
- Introduction
- Market Value Proportion Analysis, By Key Countries
- Global Vs. Country Growth Comparison
- United States Human Complement C3 Protein Market Analysis
- Market Size (US$ Mn) & Volume (Kg) Analysis by Market Taxonomy, 2021–2036
- By Product Type
- By Formulation Type
- By Purity Level
- By Disease Research Area
- By Application
- By End User
- Canada Human Complement C3 Protein Market Analysis
- Mexico Human Complement C3 Protein Market Analysis
- Brazil Human Complement C3 Protein Market Analysis
- Chile Human Complement C3 Protein Market Analysis
- Germany Human Complement C3 Protein Market Analysis
- France Human Complement C3 Protein Market Analysis
- Italy Human Complement C3 Protein Market Analysis
- Spain Human Complement C3 Protein Market Analysis
- United Kingdom Human Complement C3 Protein Market Analysis
- BENELUX Human Complement C3 Protein Market Analysis
- Nordics Human Complement C3 Protein Market Analysis
- Poland Human Complement C3 Protein Market Analysis
- Russia Human Complement C3 Protein Market Analysis
- Hungary Human Complement C3 Protein Market Analysis
- Balkan & Baltics Human Complement C3 Protein Market Analysis
- China Human Complement C3 Protein Market Analysis
- Japan Human Complement C3 Protein Market Analysis
- South Korea Human Complement C3 Protein Market Analysis
- India Human Complement C3 Protein Market Analysis
- ASEAN Human Complement C3 Protein Market Analysis
- ANZ Human Complement C3 Protein Market Analysis
- KSA Human Complement C3 Protein Market Analysis
- Other GCC Countries Human Complement C3 Protein Market Analysis
- South Africa Human Complement C3 Protein Market Analysis
- Turkiye Human Complement C3 Protein Market Analysis
- United States Human Complement C3 Protein Market Analysis
- Human Complement C3 Protein Market Structure Analysis
- Market Analysis by Tier of Companies
- Market Concentration
- Market Share Analysis of Top Players
- Market Space for New Brands and Dollar Opportunity
- Market Presence Analysis
- Regional Footprint of Players
- Product Footprint by Players
- Mobile Optical Pluggable Competition Analysis
- Competition Dashboard
- Pricing Analysis by Competition
- Competition Benchmarking
- Competition Deep Dive
- Thermo Fisher Scientific Inc.
- Overview
- Product Portfolio
- Sales Footprint
- Key Developments
- SWOT Analysis
- Strategy Overview
- Key Financials
- Bio-Techne
- Merck KGaA
- Abcam Limited
- Proteintech Group
- Sino Biological, Inc.
- ACROBiosystem
- CUSABIO TECHNOLOGY LLC
- Elabscience® Bionovation Inc.
- MedChemExpress
- Abnova Corporation
- RayBiotech, Inc.
- BioLegend, Inc.
- Prospec-Tany Technogene Ltd.
- OriGene Technologies, Inc.
- MyBioSource
- Enzo Biochem Inc.
- Boster Biological Technology
- Other Prominent Players
- Thermo Fisher Scientific Inc.
- Primary insights
- Assumptions & Acronyms Used
- Research Methodology & Data Sources
List Of Table
- Table 1: GlobalMarket Value (USD Mn) Forecast by Region, 2021 to 2036
- Table 2: GlobalMarket Volume (Kg) Forecast by Region, 2021 to 2036
- Table 3: GlobalMarket Value (USD Mn) Forecast by Product Type, 2021 to 2036
- Table 4: GlobalMarket Volume (Kg) Forecast by Product Type, 2021 to 2036
- Table 5: GlobalMarket Value (USD Mn) Forecast by Formulation Type, 2021 to 2036
- Table 6: GlobalMarket Volume (Kg) Forecast by Formulation Type, 2021 to 2036
- Table 7: GlobalMarket Value (USD Mn) Forecast by Purity Level, 2021 to 2036
- Table 8: GlobalMarket Volume (Kg) Forecast by Purity Level, 2021 to 2036
- Table 9: GlobalMarket Value (USD Mn) Forecast by Disease Research Area, 2021 to 2036
- Table 10: GlobalMarket Volume (Kg) Forecast by Disease Research Area, 2021 to 2036
- Table 11: GlobalMarket Value (USD Mn) Forecast by Application, 2021 to 2036
- Table 12: GlobalMarket Volume (Kg) Forecast by Application, 2021 to 2036
- Table 13: GlobalMarket Value (USD Mn) Forecast by End User, 2021 to 2036
- Table 14: GlobalMarket Volume (Kg) Forecast by End User, 2021 to 2036
- Table 15: North AmericaMarket Value (USD Mn) Forecast by Country, 2021 to 2036
- Table 16: North AmericaMarket Volume (Kg) Forecast by Country, 2021 to 2036
- Table 17: North AmericaMarket Value (USD Mn) Forecast by Product Type, 2021 to 2036
- Table 18: North AmericaMarket Volume (Kg) Forecast by Product Type, 2021 to 2036
- Table 19: North AmericaMarket Value (USD Mn) Forecast by Formulation Type, 2021 to 2036
- Table 20: North AmericaMarket Volume (Kg) Forecast by Formulation Type, 2021 to 2036
- Table 21: North AmericaMarket Value (USD Mn) Forecast by Purity Level, 2021 to 2036
- Table 22: North AmericaMarket Volume (Kg) Forecast by Purity Level, 2021 to 2036
- Table 23: North AmericaMarket Value (USD Mn) Forecast by Disease Research Area, 2021 to 2036
- Table 24: North AmericaMarket Volume (Kg) Forecast by Disease Research Area, 2021 to 2036
- Table 25: North AmericaMarket Value (USD Mn) Forecast by Application, 2021 to 2036
- Table 26: North AmericaMarket Volume (Kg) Forecast by Application, 2021 to 2036
- Table 27: North AmericaMarket Value (USD Mn) Forecast by End User, 2021 to 2036
- Table 28: North AmericaMarket Volume (Kg) Forecast by End User, 2021 to 2036
- Table 29: Latin AmericaMarket Value (USD Mn) Forecast by Country, 2021 to 2036
- Table 30: Latin AmericaMarket Volume (Kg) Forecast by Country, 2021 to 2036
- Table 31: Latin AmericaMarket Value (USD Mn) Forecast by Product Type, 2021 to 2036
- Table 32: Latin AmericaMarket Volume (Kg) Forecast by Product Type, 2021 to 2036
- Table 33: Latin AmericaMarket Value (USD Mn) Forecast by Formulation Type, 2021 to 2036
- Table 34: Latin AmericaMarket Volume (Kg) Forecast by Formulation Type, 2021 to 2036
- Table 35: Latin AmericaMarket Value (USD Mn) Forecast by Purity Level, 2021 to 2036
- Table 36: Latin AmericaMarket Volume (Kg) Forecast by Purity Level, 2021 to 2036
- Table 37: Latin AmericaMarket Value (USD Mn) Forecast by Disease Research Area, 2021 to 2036
- Table 38: Latin AmericaMarket Volume (Kg) Forecast by Disease Research Area, 2021 to 2036
- Table 39: Latin AmericaMarket Value (USD Mn) Forecast by Application, 2021 to 2036
- Table 40: Latin AmericaMarket Volume (Kg) Forecast by Application, 2021 to 2036
- Table 41: Latin AmericaMarket Value (USD Mn) Forecast by End User, 2021 to 2036
- Table 42: Latin AmericaMarket Volume (Kg) Forecast by End User, 2021 to 2036
- Table 43: Western EuropeMarket Value (USD Mn) Forecast by Country, 2021 to 2036
- Table 44: Western EuropeMarket Volume (Kg) Forecast by Country, 2021 to 2036
- Table 45: Western EuropeMarket Value (USD Mn) Forecast by Product Type, 2021 to 2036
- Table 46: Western EuropeMarket Volume (Kg) Forecast by Product Type, 2021 to 2036
- Table 47: Western EuropeMarket Value (USD Mn) Forecast by Formulation Type, 2021 to 2036
- Table 48: Western EuropeMarket Volume (Kg) Forecast by Formulation Type, 2021 to 2036
- Table 49: Western EuropeMarket Value (USD Mn) Forecast by Purity Level, 2021 to 2036
- Table 50: Western EuropeMarket Volume (Kg) Forecast by Purity Level, 2021 to 2036
- Table 51: Western EuropeMarket Value (USD Mn) Forecast by Disease Research Area, 2021 to 2036
- Table 52: Western EuropeMarket Volume (Kg) Forecast by Disease Research Area, 2021 to 2036
- Table 53: Western EuropeMarket Value (USD Mn) Forecast by Application, 2021 to 2036
- Table 54: Western EuropeMarket Volume (Kg) Forecast by Application, 2021 to 2036
- Table 55: Western EuropeMarket Value (USD Mn) Forecast by End User, 2021 to 2036
- Table 56: Western EuropeMarket Volume (Kg) Forecast by End User, 2021 to 2036
- Table 57: Eastern EuropeMarket Value (USD Mn) Forecast by Country, 2021 to 2036
- Table 58: Eastern EuropeMarket Volume (Kg) Forecast by Country, 2021 to 2036
- Table 59: Eastern EuropeMarket Value (USD Mn) Forecast by Product Type, 2021 to 2036
- Table 60: Eastern EuropeMarket Volume (Kg) Forecast by Product Type, 2021 to 2036
- Table 61: Eastern EuropeMarket Value (USD Mn) Forecast by Formulation Type, 2021 to 2036
- Table 62: Eastern EuropeMarket Volume (Kg) Forecast by Formulation Type, 2021 to 2036
- Table 63: Eastern EuropeMarket Value (USD Mn) Forecast by Purity Level, 2021 to 2036
- Table 64: Eastern EuropeMarket Volume (Kg) Forecast by Purity Level, 2021 to 2036
- Table 65: Eastern EuropeMarket Value (USD Mn) Forecast by Disease Research Area, 2021 to 2036
- Table 66: Eastern EuropeMarket Volume (Kg) Forecast by Disease Research Area, 2021 to 2036
- Table 67: Eastern EuropeMarket Value (USD Mn) Forecast by Application, 2021 to 2036
- Table 68: Eastern EuropeMarket Volume (Kg) Forecast by Application, 2021 to 2036
- Table 69: Eastern EuropeMarket Value (USD Mn) Forecast by End User, 2021 to 2036
- Table 70: Eastern EuropeMarket Volume (Kg) Forecast by End User, 2021 to 2036
- Table 71: East AsiaMarket Value (USD Mn) Forecast by Country, 2021 to 2036
- Table 72: East AsiaMarket Volume (Kg) Forecast by Country, 2021 to 2036
- Table 73: East AsiaMarket Value (USD Mn) Forecast by Product Type, 2021 to 2036
- Table 74: East AsiaMarket Volume (Kg) Forecast by Product Type, 2021 to 2036
- Table 75: East AsiaMarket Value (USD Mn) Forecast by Formulation Type, 2021 to 2036
- Table 76: East AsiaMarket Volume (Kg) Forecast by Formulation Type, 2021 to 2036
- Table 77: East AsiaMarket Value (USD Mn) Forecast by Purity Level, 2021 to 2036
- Table 78: East AsiaMarket Volume (Kg) Forecast by Purity Level, 2021 to 2036
- Table 79: East AsiaMarket Value (USD Mn) Forecast by Disease Research Area, 2021 to 2036
- Table 80: East AsiaMarket Volume (Kg) Forecast by Disease Research Area, 2021 to 2036
- Table 81: East AsiaMarket Value (USD Mn) Forecast by Application, 2021 to 2036
- Table 82: East AsiaMarket Volume (Kg) Forecast by Application, 2021 to 2036
- Table 83: East AsiaMarket Value (USD Mn) Forecast by End User, 2021 to 2036
- Table 84: East AsiaMarket Volume (Kg) Forecast by End User, 2021 to 2036
- Table 85: South Asia and PacificMarket Value (USD Mn) Forecast by Country, 2021 to 2036
- Table 86: South Asia and PacificMarket Volume (Kg) Forecast by Country, 2021 to 2036
- Table 87: South Asia and PacificMarket Value (USD Mn) Forecast by Product Type, 2021 to 2036
- Table 88: South Asia and PacificMarket Volume (Kg) Forecast by Product Type, 2021 to 2036
- Table 89: South Asia and PacificMarket Value (USD Mn) Forecast by Formulation Type, 2021 to 2036
- Table 90: South Asia and PacificMarket Volume (Kg) Forecast by Formulation Type, 2021 to 2036
- Table 91: South Asia and PacificMarket Value (USD Mn) Forecast by Purity Level, 2021 to 2036
- Table 92: South Asia and PacificMarket Volume (Kg) Forecast by Purity Level, 2021 to 2036
- Table 93: South Asia and PacificMarket Value (USD Mn) Forecast by Disease Research Area, 2021 to 2036
- Table 94: South Asia and PacificMarket Volume (Kg) Forecast by Disease Research Area, 2021 to 2036
- Table 95: South Asia and PacificMarket Value (USD Mn) Forecast by Application, 2021 to 2036
- Table 96: South Asia and PacificMarket Volume (Kg) Forecast by Application, 2021 to 2036
- Table 97: South Asia and PacificMarket Value (USD Mn) Forecast by End User, 2021 to 2036
- Table 98: South Asia and PacificMarket Volume (Kg) Forecast by End User, 2021 to 2036
- Table 99: Middle East & AfricaMarket Value (USD Mn) Forecast by Country, 2021 to 2036
- Table 100: Middle East & AfricaMarket Volume (Kg) Forecast by Country, 2021 to 2036
- Table 101: Middle East & AfricaMarket Value (USD Mn) Forecast by Product Type, 2021 to 2036
- Table 102: Middle East & AfricaMarket Volume (Kg) Forecast by Product Type, 2021 to 2036
- Table 103: Middle East & AfricaMarket Value (USD Mn) Forecast by Formulation Type, 2021 to 2036
- Table 104: Middle East & AfricaMarket Volume (Kg) Forecast by Formulation Type, 2021 to 2036
- Table 105: Middle East & AfricaMarket Value (USD Mn) Forecast by Purity Level, 2021 to 2036
- Table 106: Middle East & AfricaMarket Volume (Kg) Forecast by Purity Level, 2021 to 2036
- Table 107: Middle East & AfricaMarket Value (USD Mn) Forecast by Disease Research Area, 2021 to 2036
- Table 108: Middle East & AfricaMarket Volume (Kg) Forecast by Disease Research Area, 2021 to 2036
- Table 109: Middle East & AfricaMarket Value (USD Mn) Forecast by Application, 2021 to 2036
- Table 110: Middle East & AfricaMarket Volume (Kg) Forecast by Application, 2021 to 2036
- Table 111: Middle East & AfricaMarket Value (USD Mn) Forecast by End User, 2021 to 2036
- Table 112: Middle East & AfricaMarket Volume (Kg) Forecast by End User, 2021 to 2036
List Of Figures
- Figure 1: Global Market Volume (Kg) Forecast 2021–2036
- Figure 2: Global Market Pricing Analysis
- Figure 3: Global Market Value (USD Mn) Forecast 2021–2036
- Figure 4: Global Market Value Share and BPS Analysis by Product Type, 2026 and 2036
- Figure 5: Global Market Y-o-Y Growth Comparison by Product Type, 2026 to 2036
- Figure 6: Global Market Attractiveness Analysis by Product Type
- Figure 7: Global Market Value Share and BPS Analysis by Formulation Type, 2026 and 2036
- Figure 8: Global Market Y-o-Y Growth Comparison by Formulation Type, 2026 to 2036
- Figure 9: Global Market Attractiveness Analysis by Formulation Type
- Figure 10: Global Market Value Share and BPS Analysis by Purity Level, 2026 and 2036
- Figure 11: Global Market Y-o-Y Growth Comparison by Purity Level, 2026 to 2036
- Figure 12: Global Market Attractiveness Analysis by Purity Level
- Figure 13: Global Market Value Share and BPS Analysis by Disease Research Area, 2026 and 2036
- Figure 14: Global Market Y-o-Y Growth Comparison by Disease Research Area, 2026 to 2036
- Figure 15: Global Market Attractiveness Analysis by Disease Research Area
- Figure 16: Global Market Value Share and BPS Analysis by Application, 2026 and 2036
- Figure 17: Global Market Y-o-Y Growth Comparison by Application, 2026 to 2036
- Figure 18: Global Market Attractiveness Analysis by Application
- Figure 19: Global Market Value Share and BPS Analysis by End User, 2026 and 2036
- Figure 20: Global Market Y-o-Y Growth Comparison by End User, 2026 to 2036
- Figure 21: Global Market Attractiveness Analysis by End User
- Figure 22: Global Market Value (USD Mn) Share and BPS Analysis by Region, 2026 and 2036
- Figure 23: Global Market Y-o-Y Growth Comparison by Region, 2026 to 2036
- Figure 24: Global Market Attractiveness Analysis by Region
- Figure 25: North America Market Incremental $ Opportunity, 2026 to 2036
- Figure 26: Latin America Market Incremental $ Opportunity, 2026 to 2036
- Figure 27: Western Europe Market Incremental $ Opportunity, 2026 to 2036
- Figure 28: Eastern Europe Market Incremental $ Opportunity, 2026 to 2036
- Figure 29: East Asia Market Incremental $ Opportunity, 2026 to 2036
- Figure 30: South Asia and Pacific Market Incremental $ Opportunity, 2026 to 2036
- Figure 31: Middle East & Africa Market Incremental $ Opportunity, 2026 to 2036
- Figure 32: North America Market Value Share and BPS Analysis by Country, 2026 and 2036
- Figure 33: North America Market Value Share and BPS Analysis by Product Type, 2026 and 2036
- Figure 34: North America Market Y-o-Y Growth Comparison by Product Type, 2026 to 2036
- Figure 35: North America Market Attractiveness Analysis by Product Type
- Figure 36: North America Market Value Share and BPS Analysis by Formulation Type, 2026 and 2036
- Figure 37: North America Market Y-o-Y Growth Comparison by Formulation Type, 2026 to 2036
- Figure 38: North America Market Attractiveness Analysis by Formulation Type
- Figure 39: North America Market Value Share and BPS Analysis by Purity Level, 2026 and 2036
- Figure 40: North America Market Y-o-Y Growth Comparison by Purity Level, 2026 to 2036
- Figure 41: North America Market Attractiveness Analysis by Purity Level
- Figure 42: North America Market Value Share and BPS Analysis by Disease Research Area, 2026 and 2036
- Figure 43: North America Market Y-o-Y Growth Comparison by Disease Research Area, 2026 to 2036
- Figure 44: North America Market Attractiveness Analysis by Disease Research Area
- Figure 45: North America Market Value Share and BPS Analysis by Application, 2026 and 2036
- Figure 46: North America Market Y-o-Y Growth Comparison by Application, 2026 to 2036
- Figure 47: North America Market Attractiveness Analysis by Application
- Figure 48: North America Market Value Share and BPS Analysis by End User, 2026 and 2036
- Figure 49: North America Market Y-o-Y Growth Comparison by End User, 2026 to 2036
- Figure 50: North America Market Attractiveness Analysis by End User
- Figure 51: Latin America Market Value Share and BPS Analysis by Country, 2026 and 2036
- Figure 52: Latin America Market Value Share and BPS Analysis by Product Type, 2026 and 2036
- Figure 53: Latin America Market Y-o-Y Growth Comparison by Product Type, 2026 to 2036
- Figure 54: Latin America Market Attractiveness Analysis by Product Type
- Figure 55: Latin America Market Value Share and BPS Analysis by Formulation Type, 2026 and 2036
- Figure 56: Latin America Market Y-o-Y Growth Comparison by Formulation Type, 2026 to 2036
- Figure 57: Latin America Market Attractiveness Analysis by Formulation Type
- Figure 58: Latin America Market Value Share and BPS Analysis by Purity Level, 2026 and 2036
- Figure 59: Latin America Market Y-o-Y Growth Comparison by Purity Level, 2026 to 2036
- Figure 60: Latin America Market Attractiveness Analysis by Purity Level
- Figure 61: Latin America Market Value Share and BPS Analysis by Disease Research Area, 2026 and 2036
- Figure 62: Latin America Market Y-o-Y Growth Comparison by Disease Research Area, 2026 to 2036
- Figure 63: Latin America Market Attractiveness Analysis by Disease Research Area
- Figure 64: Latin America Market Value Share and BPS Analysis by Application, 2026 and 2036
- Figure 65: Latin America Market Y-o-Y Growth Comparison by Application, 2026 to 2036
- Figure 66: Latin America Market Attractiveness Analysis by Application
- Figure 67: Latin America Market Value Share and BPS Analysis by End User, 2026 and 2036
- Figure 68: Latin America Market Y-o-Y Growth Comparison by End User, 2026 to 2036
- Figure 69: Latin America Market Attractiveness Analysis by End User
- Figure 70: Western Europe Market Value Share and BPS Analysis by Country, 2026 and 2036
- Figure 71: Western Europe Market Value Share and BPS Analysis by Product Type, 2026 and 2036
- Figure 72: Western Europe Market Y-o-Y Growth Comparison by Product Type, 2026 to 2036
- Figure 73: Western Europe Market Attractiveness Analysis by Product Type
- Figure 74: Western Europe Market Value Share and BPS Analysis by Formulation Type, 2026 and 2036
- Figure 75: Western Europe Market Y-o-Y Growth Comparison by Formulation Type, 2026 to 2036
- Figure 76: Western Europe Market Attractiveness Analysis by Formulation Type
- Figure 77: Western Europe Market Value Share and BPS Analysis by Purity Level, 2026 and 2036
- Figure 78: Western Europe Market Y-o-Y Growth Comparison by Purity Level, 2026 to 2036
- Figure 79: Western Europe Market Attractiveness Analysis by Purity Level
- Figure 80: Western Europe Market Value Share and BPS Analysis by Disease Research Area, 2026 and 2036
- Figure 81: Western Europe Market Y-o-Y Growth Comparison by Disease Research Area, 2026 to 2036
- Figure 82: Western Europe Market Attractiveness Analysis by Disease Research Area
- Figure 83: Western Europe Market Value Share and BPS Analysis by Application, 2026 and 2036
- Figure 84: Western Europe Market Y-o-Y Growth Comparison by Application, 2026 to 2036
- Figure 85: Western Europe Market Attractiveness Analysis by Application
- Figure 86: Western Europe Market Value Share and BPS Analysis by End User, 2026 and 2036
- Figure 87: Western Europe Market Y-o-Y Growth Comparison by End User, 2026 to 2036
- Figure 88: Western Europe Market Attractiveness Analysis by End User
- Figure 89: Eastern Europe Market Value Share and BPS Analysis by Country, 2026 and 2036
- Figure 90: Eastern Europe Market Value Share and BPS Analysis by Product Type, 2026 and 2036
- Figure 91: Eastern Europe Market Y-o-Y Growth Comparison by Product Type, 2026 to 2036
- Figure 92: Eastern Europe Market Attractiveness Analysis by Product Type
- Figure 93: Eastern Europe Market Value Share and BPS Analysis by Formulation Type, 2026 and 2036
- Figure 94: Eastern Europe Market Y-o-Y Growth Comparison by Formulation Type, 2026 to 2036
- Figure 95: Eastern Europe Market Attractiveness Analysis by Formulation Type
- Figure 96: Eastern Europe Market Value Share and BPS Analysis by Purity Level, 2026 and 2036
- Figure 97: Eastern Europe Market Y-o-Y Growth Comparison by Purity Level, 2026 to 2036
- Figure 98: Eastern Europe Market Attractiveness Analysis by Purity Level
- Figure 99: Eastern Europe Market Value Share and BPS Analysis by Disease Research Area, 2026 and 2036
- Figure 100: Eastern Europe Market Y-o-Y Growth Comparison by Disease Research Area, 2026 to 2036
- Figure 101: Eastern Europe Market Attractiveness Analysis by Disease Research Area
- Figure 102: Eastern Europe Market Value Share and BPS Analysis by Application, 2026 and 2036
- Figure 103: Eastern Europe Market Y-o-Y Growth Comparison by Application, 2026 to 2036
- Figure 104: Eastern Europe Market Attractiveness Analysis by Application
- Figure 105: Eastern Europe Market Value Share and BPS Analysis by End User, 2026 and 2036
- Figure 106: Eastern Europe Market Y-o-Y Growth Comparison by End User, 2026 to 2036
- Figure 107: Eastern Europe Market Attractiveness Analysis by End User
- Figure 108: East Asia Market Value Share and BPS Analysis by Country, 2026 and 2036
- Figure 109: East Asia Market Value Share and BPS Analysis by Product Type, 2026 and 2036
- Figure 110: East Asia Market Y-o-Y Growth Comparison by Product Type, 2026 to 2036
- Figure 111: East Asia Market Attractiveness Analysis by Product Type
- Figure 112: East Asia Market Value Share and BPS Analysis by Formulation Type, 2026 and 2036
- Figure 113: East Asia Market Y-o-Y Growth Comparison by Formulation Type, 2026 to 2036
- Figure 114: East Asia Market Attractiveness Analysis by Formulation Type
- Figure 115: East Asia Market Value Share and BPS Analysis by Purity Level, 2026 and 2036
- Figure 116: East Asia Market Y-o-Y Growth Comparison by Purity Level, 2026 to 2036
- Figure 117: East Asia Market Attractiveness Analysis by Purity Level
- Figure 118: East Asia Market Value Share and BPS Analysis by Disease Research Area, 2026 and 2036
- Figure 119: East Asia Market Y-o-Y Growth Comparison by Disease Research Area, 2026 to 2036
- Figure 120: East Asia Market Attractiveness Analysis by Disease Research Area
- Figure 121: East Asia Market Value Share and BPS Analysis by Application, 2026 and 2036
- Figure 122: East Asia Market Y-o-Y Growth Comparison by Application, 2026 to 2036
- Figure 123: East Asia Market Attractiveness Analysis by Application
- Figure 124: East Asia Market Value Share and BPS Analysis by End User, 2026 and 2036
- Figure 125: East Asia Market Y-o-Y Growth Comparison by End User, 2026 to 2036
- Figure 126: East Asia Market Attractiveness Analysis by End User
- Figure 127: South Asia and Pacific Market Value Share and BPS Analysis by Country, 2026 and 2036
- Figure 128: South Asia and Pacific Market Value Share and BPS Analysis by Product Type, 2026 and 2036
- Figure 129: South Asia and Pacific Market Y-o-Y Growth Comparison by Product Type, 2026 to 2036
- Figure 130: South Asia and Pacific Market Attractiveness Analysis by Product Type
- Figure 131: South Asia and Pacific Market Value Share and BPS Analysis by Formulation Type, 2026 and 2036
- Figure 132: South Asia and Pacific Market Y-o-Y Growth Comparison by Formulation Type, 2026 to 2036
- Figure 133: South Asia and Pacific Market Attractiveness Analysis by Formulation Type
- Figure 134: South Asia and Pacific Market Value Share and BPS Analysis by Purity Level, 2026 and 2036
- Figure 135: South Asia and Pacific Market Y-o-Y Growth Comparison by Purity Level, 2026 to 2036
- Figure 136: South Asia and Pacific Market Attractiveness Analysis by Purity Level
- Figure 137: South Asia and Pacific Market Value Share and BPS Analysis by Disease Research Area, 2026 and 2036
- Figure 138: South Asia and Pacific Market Y-o-Y Growth Comparison by Disease Research Area, 2026 to 2036
- Figure 139: South Asia and Pacific Market Attractiveness Analysis by Disease Research Area
- Figure 140: South Asia and Pacific Market Value Share and BPS Analysis by Application, 2026 and 2036
- Figure 141: South Asia and Pacific Market Y-o-Y Growth Comparison by Application, 2026 to 2036
- Figure 142: South Asia and Pacific Market Attractiveness Analysis by Application
- Figure 143: South Asia and Pacific Market Value Share and BPS Analysis by End User, 2026 and 2036
- Figure 144: South Asia and Pacific Market Y-o-Y Growth Comparison by End User, 2026 to 2036
- Figure 145: South Asia and Pacific Market Attractiveness Analysis by End User
- Figure 146: Middle East & Africa Market Value Share and BPS Analysis by Country, 2026 and 2036
- Figure 147: Middle East & Africa Market Value Share and BPS Analysis by Product Type, 2026 and 2036
- Figure 148: Middle East & Africa Market Y-o-Y Growth Comparison by Product Type, 2026 to 2036
- Figure 149: Middle East & Africa Market Attractiveness Analysis by Product Type
- Figure 150: Middle East & Africa Market Value Share and BPS Analysis by Formulation Type, 2026 and 2036
- Figure 151: Middle East & Africa Market Y-o-Y Growth Comparison by Formulation Type, 2026 to 2036
- Figure 152: Middle East & Africa Market Attractiveness Analysis by Formulation Type
- Figure 153: Middle East & Africa Market Value Share and BPS Analysis by Purity Level, 2026 and 2036
- Figure 154: Middle East & Africa Market Y-o-Y Growth Comparison by Purity Level, 2026 to 2036
- Figure 155: Middle East & Africa Market Attractiveness Analysis by Purity Level
- Figure 156: Middle East & Africa Market Value Share and BPS Analysis by Disease Research Area, 2026 and 2036
- Figure 157: Middle East & Africa Market Y-o-Y Growth Comparison by Disease Research Area, 2026 to 2036
- Figure 158: Middle East & Africa Market Attractiveness Analysis by Disease Research Area
- Figure 159: Middle East & Africa Market Value Share and BPS Analysis by Application, 2026 and 2036
- Figure 160: Middle East & Africa Market Y-o-Y Growth Comparison by Application, 2026 to 2036
- Figure 161: Middle East & Africa Market Attractiveness Analysis by Application
- Figure 162: Middle East & Africa Market Value Share and BPS Analysis by End User, 2026 and 2036
- Figure 163: Middle East & Africa Market Y-o-Y Growth Comparison by End User, 2026 to 2036
- Figure 164: Middle East & Africa Market Attractiveness Analysis by End User
- Figure 165: Global Market – Tier Structure Analysis
- Figure 166: Global Market – Company Share Analysis