- Market Value (2025): USD 521.1 Mn
- Estimated Value (2026): USD 560.0 Mn
- Forecast Value (2036): USD 1150.0 Mn
- CAGR (2026-2036): 7.5%
What is the Interactive Expo Displays Market forecast to be worth by 2036?
USD 560.0 million in 2026 to USD 1,150.0 million by 2036 at 7.5% CAGR.
- The interactive expo displays market reached USD 521.1 million in 2025 as event budgets moved toward guided product explanation and visitor response tracking.
- Demand is projected to increase from USD 560.0 million in 2026 to USD 1,150.0 million by 2036.
- The market is forecast to record 7.5% CAGR from 2026 to 2036 owing to shorter staff-led demonstrations and more disciplined gamified brand engagement.
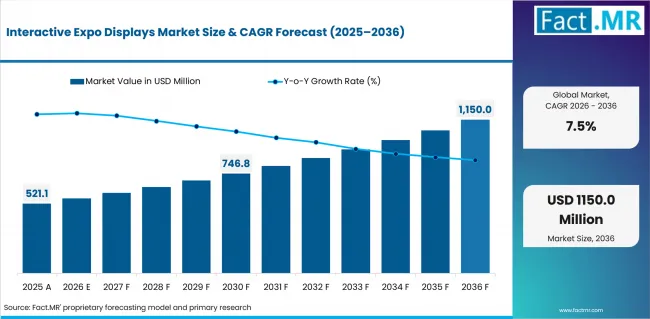
Interactive Expo Displays Market Value Analysis | Source: Fact.MR
What are the defining numbers behind Interactive Expo Displays Market growth?
USD 590.0 million absolute opportunity by 2036, led by Touch displays and Interactive kiosks alongside Product demo use cases and Convention center deployments.
- Demand Drivers in the Market
- Experiential product explanation makes the category useful when complex offers need a guided booth workflow. Visitors move through features and choices before the staff conversation begins.
- Measurable visitor interaction gives event teams a record of taps and form starts. These records help compare one show with the next and improve the content path before reuse.
- Shorter staff-led demonstrations are expected to favor prepared touch flows during peak booth traffic. The format helps product experts spend more time with qualified visitors.
- Gamified brand engagement is expected to support demand when the activity returns visitors to the product offer. Event teams reject effects that slow traffic without useful follow-up.
- Key Segments Analyzed
- By Interaction Mode: Touch displays are projected to hold 34.0% share in 2026 because they give visitors a familiar input method and reduce booth training needs.
- By Hardware Form: Interactive kiosks are expected to account for 29.0% share in 2026 where self-contained units simplify setup and support responsibility.
- By Content Purpose: Product demo is anticipated to capture 27.0% share in 2026 because product explanation creates the clearest route to a lead outcome.
- By Venue Type: Convention centers are forecast to represent 31.0% share in 2026 as repeat shows make stable installation routines more important.
- By Deployment Model: Purchase is estimated to command 24.0% share in 2026 where repeat exhibitors need control over hardware condition and content updates.
- Analyst Opinion at Fact.MR
- Shambhu Nath Jha, Sr. Consultant at Fact.MR, states, “Interactive expo display purchases are expected to depend less on visual effect and more on reliable interaction design. Providers need to prove that touch and sensor workflows can guide visitors toward a product decision under live event conditions. The best position belongs to companies that define support responsibility before the show opens.”
- Strategic Implications
- Event buyers can compare different display options before selecting a booth format. The plan needs one clear visitor action and one content flow to avoid late changes.
- Display providers can speed up approval by listing the screens and sensors included in the package. Clear support terms also help when kiosks are reused at several events.
- Venue and agency teams can set placement rules before choosing touch walls or interactive projectors. The setup needs to match visitor movement and available booth staff.
The UAE is forecast to grow at 8.2% over the same period. The USA is anticipated to register 7.5%, followed closely by Japan at 7.4%. The United Kingdom is projected to advance at 7.2%, while Germany is estimated to record a 6.9% CAGR.
How does the Interactive Expo Displays Market break down by segment?
Touch displays are expected to lead Interaction Mode at 34.0% share. Interactive kiosks are projected to lead Hardware Form at 29.0% share in 2026.
Why do Touch display lead Interaction Mode?
Touch displays are projected to account for 34.0% share in 2026.
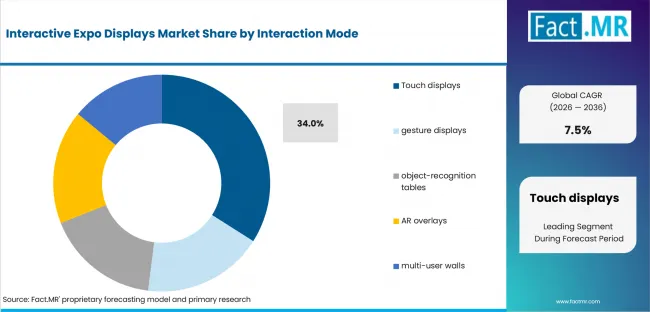
Interactive Expo Displays Market Analysis By Interaction Mode | Source: Fact.MR
Touch displays fit event use because most visitors already know how the interface works. They can tap through products and submit details without staff guidance. The format also supports guided browsing within one screen. Buyers can test the visitor journey before the booth opens. Screen height and response speed can be checked at the same time. This lowers the chance of confusion during busy periods and makes the display easier to use across different audience groups.
Why do Interactive kiosks lead Hardware Form?
Interactive kiosks are projected to account for 29.0% share in 2026.
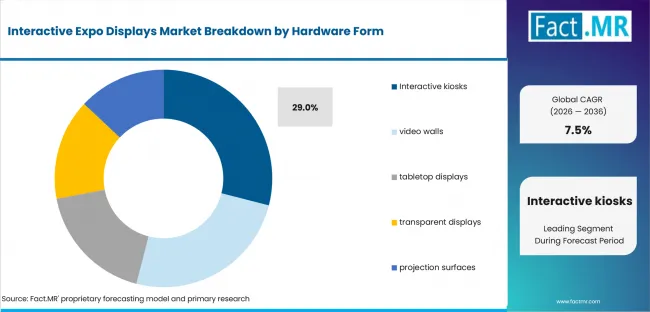
Interactive Expo Displays Market Analysis By Hardware Form | Source: Fact.MR
Interactive kiosks place the screen and visitor controls inside one ready-to-use structure. Exhibitors can use them for registration or product information. The same unit can also support lead capture. Setup becomes easier when power and content checks follow a fixed process. Exhibit builders can prepare the system before delivery and repeat the same steps at each show. This reduces on-site changes and gives support staff a clearer route for solving technical problems.
Why does Product demo lead Content Purpose?
Product demo is projected to account for 27.0% share in 2026.
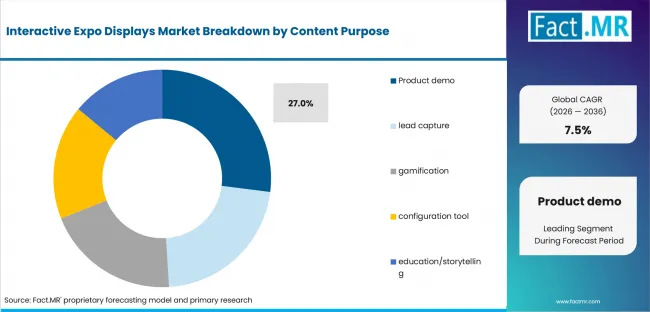
Interactive Expo Displays Market Analysis By Content Purpose | Source: Fact.MR
Product demos help exhibitors explain key features within a short visitor interaction. The content can move from a problem to a product benefit and then to a clear next step. This creates a more focused experience than broad brand messaging. Each screen path can also be measured. Event teams can see which features attract attention and which actions produce useful leads. The results can guide future content updates without changing the full booth experience.
Why do Convention centers lead Venue Type?
Convention centers are projected to account for 31.0% share in 2026.
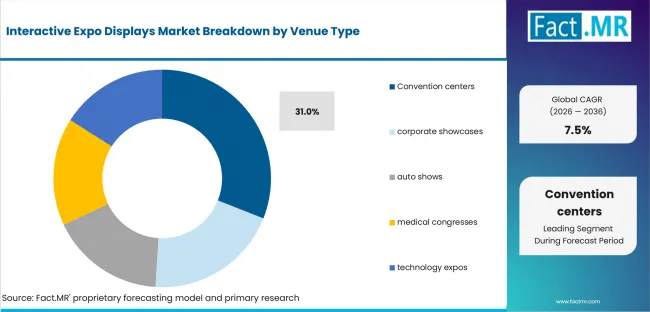
Interactive Expo Displays Market Analysis By Venue Type | Source: Fact.MR
Convention centers support repeated display use because they host regular exhibitions and larger booth builds. These sites often have clear rules for power and placement. Suppliers must prepare the system around those requirements before installation begins. Content testing also becomes important when several exhibitors share the same operating window. Companies that complete checks early can avoid delays during opening hours. This makes convention centers suitable for structured deployments that depend on reliable setup and technical support.
Why does Purchase lead Deployment Model?
Purchase is estimated to account for 24.0% share in 2026.
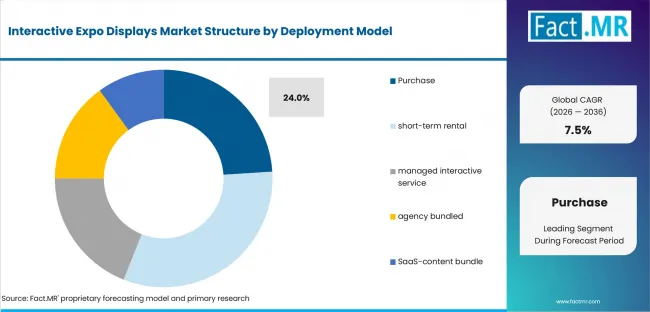
Interactive Expo Displays Market Analysis By Deployment Model | Source: Fact.MR
Purchase works well for exhibitors that use the same display system at several events. Ownership gives them control over hardware condition and software settings. Staff can also train on one familiar setup before each show. The model may reduce repeated rental work when the interaction format remains stable. However, buyers must manage storage and transport between events. Purchase therefore suits companies with a clear reuse plan and enough internal support to maintain the equipment over time.
What is accelerating Interactive Expo Displays Market adoption, and what is holding it back?
Demand is expected to be driven by experiential product explanation and measurable visitor interaction. Adoption is expected to be held back by content development cost and on-site technical failure.
Drivers Impact Analysis
| DRIVER | (~) % IMPACT ON CAGR | GEOGRAPHIC RELEVANCE | IMPACT TIMELINE |
|---|---|---|---|
| Experiential product explanation | +2.0% | North America and Europe | Short term (<=2 years) |
| Measurable visitor interaction | +1.6% | China and UAE | Short term (<=2 years) |
| Shorter staff-led demonstrations | +1.2% | Mature exhibition markets | Medium term (2-4 years) |
| Gamified brand engagement | +0.8% | Global | Medium term (2-4 years) |
Source: Fact.MR analysis. Updated Jul 27, 2026
- Experiential product explanation: Complex products are expected to need booth formats that show value without a long verbal script. Interactive content gives visitors a guided path and gives staff more time for qualified questions.
- Measurable visitor interaction: Event teams are expected to place more weight on interaction records when choosing repeatable booth systems. Taps and form starts help compare content performance across shows.
- Shorter staff-led demonstrations: Prepared touch flows are expected to reduce repeated introductory explanations. The benefit is clearest when the system resets quickly and does not require expert staff for every visitor.
- Gamified brand engagement: Game-like content is expected to improve recall when it is connected to product discovery. The activity must still move visitors toward a commercial next step.
Opportunity Impact Analysis
| OPPORTUNITY | (~) % IMPACT ON CAGR | GEOGRAPHIC RELEVANCE | IMPACT TIMELINE |
|---|---|---|---|
| Content-as-a-service bundles | +1.3% | Germany and Japan | Short term (<=2 years) |
| Accessible multi-user interfaces | +1.0% | China and UAE | Medium term (2-4 years) |
| Analytics-ready demonstrations | +0.7% | USA and UK | Medium term (2-4 years) |
Source: Fact.MR analysis. Updated Jul 27, 2026
- Content-as-a-service bundles: Repeat exhibitors are expected to value packaged content updates when hardware is reused across shows. This gives providers a service route after installation and keeps the display useful after the first event.
- Accessible multi-user interfaces: Multi-user layouts are expected to expand use in crowded booths when they guide several visitors without confusion. This opportunity connects with extended reality when overlays support product explanation without turning into spectacle.
- Analytics-ready demonstrations: Demonstrations with interaction records are expected to help marketers compare product interest across events. This makes content planning closer to programmatic display decisions where response patterns guide the next campaign.
Restraints Impact Analysis
| RESTRAINT | (~) % IMPACT ON CAGR | GEOGRAPHIC RELEVANCE | IMPACT TIMELINE |
|---|---|---|---|
| Content development cost | -1.4% | Highly regulated venues | Short term (<=2 years) |
| On-site technical failure | -1.0% | Global | Medium term (2-4 years) |
| Interaction designs that distract from the offer | -0.7% | Cost-sensitive regional markets | Short term (<=2 years) |
Source: Fact.MR analysis. Updated Jul 27, 2026
- Content development cost: Custom content slows approval when the visitor path and reset process are not defined early. Costs are easier to defend when the same content can be reused with minor updates.
- On-site technical failure: Touch or sensor failure creates direct event risk because the display is visible to visitors. Providers need spare parts and a clear support owner before the show opens.
- Interaction designs that distract from the offer: Some interactive effects create attention without helping visitors understand the product. Event teams are expected to reject designs that weaken the sales conversation.
Which countries are scaling Interactive Expo Displays Market fastest?
The country comparison is defined by event density and venue service expectations. China and UAE remain above the global 7.5% CAGR. USA tracks the global pace. Japan, UK and Germany remain below the global rate but still benefit from repeat exhibitions and stricter operating checks.
- UAE records a higher growth path through international shows that place pressure on fast installation and removal. Interactive displays must work within tight venue timelines and multilingual visitor flows.
- USA adoption is expected to depend on measurement-led exhibitor procurement. Event teams need evidence that content paths improve lead capture and reduce repeated staff explanations.
- Japan is expected to favor compact systems that fit disciplined booth layouts. Providers need stable touch response and simple content controls because space and setup routines are closely managed.
- UK demand is expected to reflect recurring exhibitions and agency-led booth programs. Content service bundles gain value when the same exhibitor needs refreshed messaging before another show.
- Germany is expected to place heavier weight on documentation and technical fit. Interactive kiosks and product-demo formats must support reliable performance across internationally exposed trade fairs.
Comparable CAGRs can therefore produce different market entry conditions across these countries. Deployment timing depends on interaction proof and venue support readiness. Content update capability before each show cycle remains a practical approval factor.
The full report provides country-level CAGR analysis across North America; Latin America; Europe; East Asia; South Asia & Oceania; and the Middle East & Africa.
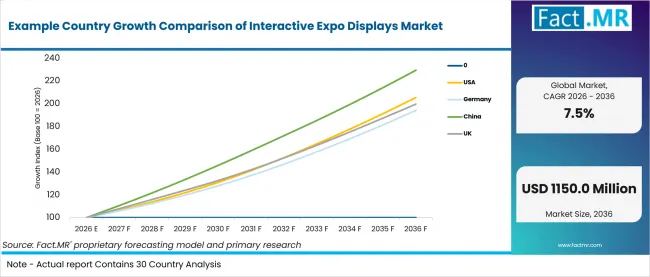
Example Country Growth Comparison Of Interactive Expo Displays Market | Source: Fact.MR
| COUNTRY | CAGR, 2026 to 2036 |
|---|---|
| UAE | 8.2% |
| USA | 7.5% |
| Japan | 7.4% |
| UK | 7.2% |
| Germany | 6.9% |
Source: Fact.MR analysis. Updated Jul 27, 2026
How is the UAE scaling demand?
8.2% CAGR, driven by premium venues and short event turnaround periods.
The UAE’s growth is shaped by large international exhibitions that operate within tight installation and removal schedules. Interactive systems need to be ready for quick deployment and multilingual visitor use. Buyers may prefer packages that combine hardware with content support and on-site service. This model gives providers a clearer route to approval because venue teams can manage both setup and visitor interaction through one coordinated offer.
What supports USA adoption?
7.5% CAGR, backed by measurable visitor engagement and lead-quality analysis.
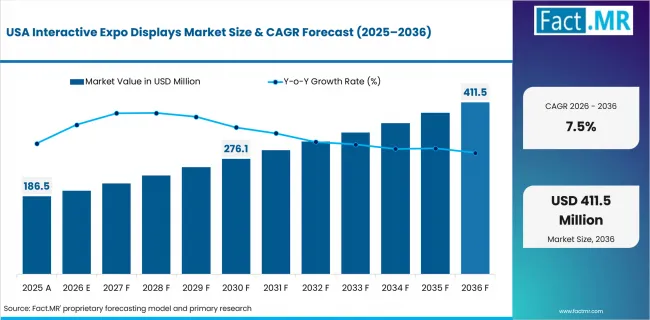
Interactive Expo Displays Market Country Value Analysis | Source: Fact.MR
The USA’s growth reflects a market where exhibitors expect evidence from event spending. Interactive displays are more valuable when they record visitor actions and connect them with lead capture. Analytics-ready product demonstrations help teams compare content performance across different shows. Buyers are therefore likely to favor systems that reduce staff workload while showing which interaction path produced more useful sales conversations.
How is Japan developing demand?
7.4% CAGR, supported by compact booth layouts and reliable touch performance.
Japan’s growth is linked to event spaces where visitor movement and equipment placement are carefully managed. Compact touch displays and tabletop systems fit these conditions without crowding the booth. Buyers are expected to value stable response and simple content controls over complex visual effects. Providers that offer predictable setup routines can improve approval because the equipment must operate smoothly within tightly controlled venue processes.
How does the UK perform?
7.2% CAGR, led by recurring exhibitions and agency-managed content updates.
The UK’s growth reflects a market where many exhibitors return to similar events with revised campaigns. This creates demand for hardware that can be reused while the product message is refreshed before each show. Content-service bundles help agencies avoid rebuilding the full interactive experience. Providers can gain an advantage by protecting brand consistency and making updates easier across repeated exhibition programs.
What supports Germany’s growth?
6.9% CAGR, driven by technical documentation and structured trade-fair requirements.
Germany’s growth is shaped by international trade fairs where technical preparation forms part of the buying decision. Interactive kiosks must meet clear power and installation requirements before they enter the venue. Buyers also expect support responsibilities to be defined in advance. Providers that document setup conditions and service limits can reduce approval delays and improve confidence in repeated deployment.
Who leads the Interactive Expo Displays Market?
Samsung and LG Business Solutions show the clearest broad display relevance. Ideum with MultiTaction plus DISPLAX and BenQ extend the provider set across touch tables and interactive boards.
Samsung and LG Business Solutions are relevant where event buyers want recognizable display brands and formal service channels. Their role is clearest when interactive displays must support product explanation in customer-facing spaces. These companies fit mainstream booth programs that need reliable screens and support access.
Ideum and MultiTaction add depth around touch tables and multi-user walls. Their relevance is most visible where the booth experience needs object recognition or a collaborative screen layout. DISPLAX adds touch sensor and overlay capability for kiosks and custom structures.
BenQ adds depth through interactive boards and business display systems used in presentation settings. The company fits opportunities where product demos need a familiar screen interface and straightforward support. Across the provider set, selection is expected to focus on content readiness and maintenance responsibility.
Which companies are the key providers?
Key companies include Samsung; LG Business Solutions; Ideum; MultiTaction; DISPLAX; BenQ.
- Samsung
- LG Business Solutions
- Ideum
- MultiTaction
- DISPLAX
- BenQ
Bibliography
- Ministry of Economy, Trade and Industry. (2025, July 10). Experience-based events and displays to promote PHR data utilization on the theme “Unlock a new wellness era with PHR” held at Expo 2025 Osaka, Kansai.
- Office for Digital Identities and Attributes. (2025, July 16). Digital identity services: Inclusion monitoring report findings 2025. Department for Science, Innovation and Technology.
- Australian Bureau of Statistics. (2026, June 25). Characteristics of Australian business, 2024–25 financial year.
- Samsung. Interactive displays and business display solutions.
- LG Business Solutions. Interactive digital signage and commercial display solutions.
- Ideum. Multitouch tables and interactive displays.
- MultiTaction. Multi-user interactive display technology.
- DISPLAX. (2025, October 21). From display to touch: Why overlays are the smartest way to upgrade screens.
- BenQ. Interactive displays and business display solutions.
This Report Answers
- The report provides strategic intelligence on Interactive Expo Displays Market across Interaction Mode and Hardware Form choices that shape event purchasing decisions.
- Segment analysis covers Touch displays and Interactive kiosks as the share leaders within the 2026 market.
- Country outlook evaluates China and UAE alongside USA and Japan. UK and Germany complete the growth comparison across the profiled markets.
- Competitive analysis profiles Samsung and LG Business Solutions alongside Ideum and MultiTaction. DISPLAX and BenQ complete the provider set.
- Use-case assessment covers Product demo and lead capture. Gamification and configuration tools complete the content view alongside education or storytelling.
What does the Interactive Expo Displays Market cover?
Digital exhibition installations that respond to touch or gesture and object recognition or multi-user input.
The market includes interactive screens and tables. It also includes walls and sensors when they are packaged with content for exhibition engagement. The covered solution must be usable within an exhibition workflow and cannot be treated as a standalone display device component.
The market differs from broader event equipment because its boundary is defined by visitor response. Passive video screens and general event apps remain outside the valuation. The exclusion also covers outdoor advertising screens unless they respond to visitors within a commercial event workflow.
What is included in the scope?
The scope includes solutions used by the buyer groups identified in the segmentation and deployed for exhibitions or related temporary business events.
Coverage spans Interaction Mode and Hardware Form alongside Content Purpose and Venue Type. Hardware such as flat panel display remains in scope only when it is packaged into an interactive expo display solution. Content services remain in scope when they support visitor interaction or lead capture.
Components remain in scope when they form part of the complete interactive expo displays solution. Their value must contribute directly to reliable interaction and a measurable visitor action.
What is excluded from the scope?
Passive video screens and consumer gaming equipment remain outside commercial events. General event apps and permanent museum systems are excluded when they do not serve a temporary business event.
The scope excludes unrelated venue construction and general event management. Floor-space rental and services that do not deliver the defined product function are excluded. This exclusion also covers location-based VR entertainment unless the installation functions as a commercial exhibition display.
How Was the Analysis Built?
The analysis draws on 120+ sources, 35+ company portfolios, 25+ countries, and more than 20 industry interviews.
- Primary Research: Primary research includes discussions with manufacturers, service providers, technology developers, distributors, end users, procurement teams, and subject-matter experts. These conversations examine purchasing priorities, product adoption, operational challenges, approval requirements, competitive positioning, and the factors that influence wider market acceptance.
- Desk Research: Desk research covers government statistics, regulatory publications, company filings, trade data, technical studies, industry associations, standards, public policy, and other authoritative sources. Every source used in the analysis is documented in the bibliography.
- Market Sizing and Forecasting: Market estimates combine historical performance, demand indicators, pricing and volume trends, segment shares, company participation, country-level growth, adoption patterns, investment activity, and barriers to market expansion.
- Data Validation and Update Cycle: Findings are validated by comparing primary interviews with public data, company activity, regulatory changes, trade patterns, and industry developments. Regular updates review new product launches, capacity changes, partnerships, approvals, procurement trends, and shifts in commercial adoption.
Segmentation
What is the report's scope and coverage?
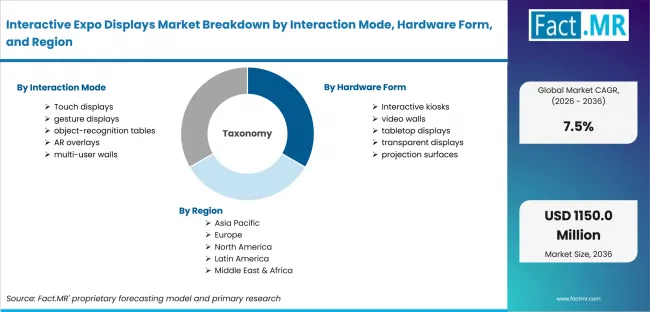
Interactive Expo Displays Market Breakdown By Interaction Mode, Hardware Form, And Region | Source: Fact.MR
| Attribute | Details |
|---|---|
| Quantitative Units | USD 560.0 million in 2026 to USD 1,150.0 million by 2036 at 7.5% CAGR |
| Market Definition | Digital exhibition installations that respond to touch or gesture and object recognition or multi-user input when sold as a commercial event solution |
| Interaction Mode | Touch displays; gesture displays; object-recognition tables; AR overlays; multi-user walls |
| Hardware Form | Interactive kiosks; video walls; tabletop displays; transparent displays; projection surfaces |
| Content Purpose | Product demo; lead capture; gamification; configuration tool; education/storytelling |
| Venue Type | Convention centers; corporate showcases; auto shows; medical congresses; technology expos |
| Deployment Model | Purchase; short-term rental; managed interactive service; agency bundled; SaaS-content bundle |
| Regions Covered | North America; Latin America; Europe; East Asia; South Asia & Oceania; Middle East & Africa |
| Countries Covered | USA; Canada; Brazil; Mexico; Germany; U.K.; France; Italy; Spain; South Korea; Japan; China; India; Australia & New Zealand; GCC Countries; South Africa; UAE |
| Key Companies Profiled | Samsung; LG Business Solutions; Ideum; MultiTaction; DISPLAX; BenQ |
| Forecast Period | 2026 to 2036 |
| Approach | Hybrid top-down and bottom-up approach using interaction mode demand; hardware form adoption; content purpose; venue type; deployment model; country growth; company participation; pricing signals; support requirements and event-use validation |
Source: Fact.MR analysis. Updated Jul 27, 2026
How is the market segmented?
-
By Interaction Mode:
- Touch displays
- gesture displays
- object-recognition tables
- AR overlays
- multi-user walls
-
By Hardware Form:
- Interactive kiosks
- video walls
- tabletop displays
- transparent displays
- projection surfaces
-
By Content Purpose:
- Product demo
- lead capture
- gamification
- configuration tool
- education/storytelling
-
By Venue Type:
- Convention centers
- corporate showcases
- auto shows
- medical congresses
- technology expos
-
By Deployment Model:
- Purchase
- short-term rental
- managed interactive service
- agency bundled
- SaaS-content bundle
-
By Region:
- North America
- USA
- Canada
- Latin America
- Brazil
- Mexico
- Rest of Latin America
- Europe
- Germany
- U.K.
- France
- Italy
- Spain
- Rest of Europe
- East Asia
- South Korea
- Japan
- China
- South Asia & Oceania
- India
- Australia & New Zealand
- Rest of South Asia & Oceania
- Middle East & Africa
- GCC Countries
- South Africa
- UAE
- Rest of Middle East & Africa
- North America
Frequently Asked Questions
Which Interaction Mode leads the market?
Which Hardware Form leads the market?
Which Content Purpose leads the market?
Which Venue Type leads the market?
Which Deployment Model leads the market?
What is the primary driver in this market?
What is the main restraint?
Why do interactive kiosks lead Hardware Form?
What does the market exclude?
Who worked on this report


Preview the report firsthand - request a free sample
Free SampleGet the brochure for pricing and purchase details
Download PDF