- Market Value (2025): USD 3.5 Bn
- Estimated Value (2026): USD 3.7 Bn
- Forecast Value (2036): USD 6.0 Bn
- CAGR (2026-2036): 4.9%
What is the Live Fish Carrier Market forecast to be worth by 2036?
USD 6.0 billion by 2036.
- The Live Fish Carrier Market reached approximately USD 3.5 billion in 2025.
- Demand is projected to increase from USD 3.7 billion in 2026 to USD 6.0 billion by 2036.
- The market is forecast to record a 4.9% CAGR from 2026 to 2036 and create an absolute opportunity of USD 2.3 billion.
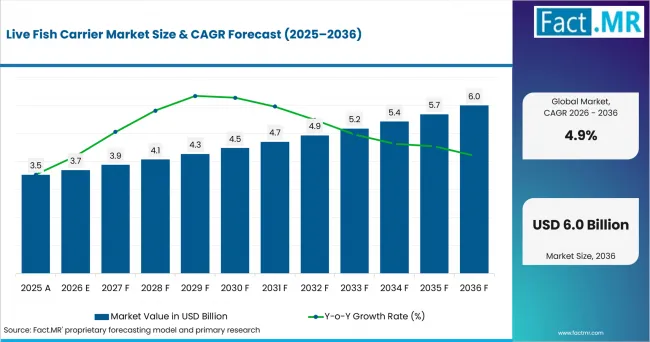
Live Fish Carrier Market Value Analysis | Source: Fact.MR
What are the defining numbers behind Live Fish Carrier Market growth?
An absolute opportunity of USD 2.3 billion is expected between 2026 and 2036.
- Demand Drivers in the Market
- Global aquaculture continues to expand the operating base for live-fish movement. FAO reported 103 million tonnes of farmed aquatic animals in 2024, representing 53% of total aquatic animal production.
- Fish production cycles require live transfers before harvest. NOAA describes Atlantic salmon moving from on-land hatcheries in aerated water tanks to marine net pens after smoltification.
- Fish welfare increasingly affects carrier design. Water quality has to remain controlled during loading, transport and unloading, particularly when fish spend long periods inside closed tanks.
- Biosecurity raises the value of closed circulation and controlled transport. The Norwegian Veterinary Institute identifies live aquaculture animal transport by wellboats as an important route through which disease can spread between production areas.
- Fleet renewal is creating demand for improved circulation systems. MMC First Process introduced a new wellboat circulation system in 2025 designed to reduce energy demand while maintaining stable water flow during live-fish transport.
- Key Segments Analyzed
- By Product: Salt Water Carrier is projected to account for 23.5% share in 2026 as marine aquaculture requires controlled movement between coastal production sites and downstream handling points.
- By Length: Less than 50 m is expected to hold 43.0% share in 2026 because compact carriers can serve regional aquaculture routes without the capital requirements of larger vessels.
- By Capacity: Less than 2500 m³ is anticipated to represent 55.0% share in 2026 as smaller-capacity systems suit coastal farms and recurring short-distance movements.
- By Application: Aquaculture Farming Transport is forecast to capture 73.6% share in 2026 because hatchery-to-farm and farm-to-processing transfers are direct operating requirements within commercial aquaculture.
- Analyst Opinion at Fact.MR
- Shambhu Nath Jha, Principal Consultant at Fact.MR, states, “Buyer decisions in the Live Fish Carrier Market will centre on moving live stock without turning transport into a fish-health event. Capacity has commercial value only when water quality and oxygen can be controlled throughout the trip and fish can be loaded or discharged with limited stress. Aquaculture operators will increasingly assess the carrier as part of the biological production system.”
- Strategic Implications
- Carrier suppliers should design around the biological requirements of transported species rather than treating tank volume as the primary commercial differentiator.
- Aquaculture operators should evaluate loading systems and water management before comparing vessel capacity because mortality or stress can outweigh transport savings.
- Closed circulation creates an opportunity for suppliers of oxygenation and water-treatment systems that can maintain conditions during longer voyages.
- Fleet economics should include fuel consumption and cleaning requirements alongside payload because downtime between biological loads affects annual vessel utilization.
How does the Live Fish Carrier Market break down by segment?
Salt Water Carrier leads Product with 23.5% share in 2026. Less than 50 m leads Length at 43.0%. Less than 2500 m³ leads Capacity at 55.0%, while Aquaculture Farming Transport leads Application with 73.6% share.
Why does Salt Water Carrier lead Product?
Salt Water Carrier is projected to account for a 23.5% share in 2026.
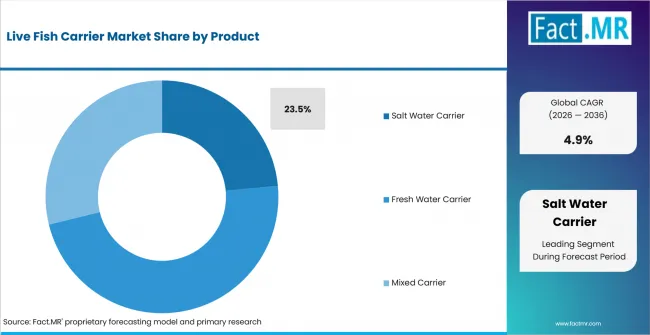
Live Fish Carrier Market Analysis By Product | Source: Fact.MR
Salt Water Carrier demand is tied to marine aquaculture operations where fish must remain alive while moving between offshore or coastal production stages. Open Sea Carrier supports routes exposed to marine operating conditions, while Coastal Carrier addresses shorter movements around concentrated farming areas. Live Holding Carrier provides additional flexibility where fish must remain onboard before the next production step.
Fresh Water Carrier serves Inland Water Carrier, Aquaculture Support Carrier and Containment Carrier requirements. This category can support hatchery movements and freshwater production systems where water conditions differ from marine operations.
Mixed Carrier includes Dual Water Compatibility Carrier, Hybrid Transport Carrier and Long Distance Mixed Carrier. These configurations can become more relevant when one vessel must handle different biological stages or operating environments. Closed-circulation technology supports greater control over the water surrounding transported fish. Sølvtrans states that its live fish carriers operate in closed circulation during transport.
Why does Less than 50 m lead Length?
Less than 50 m is projected to hold a 43.0% share in 2026.
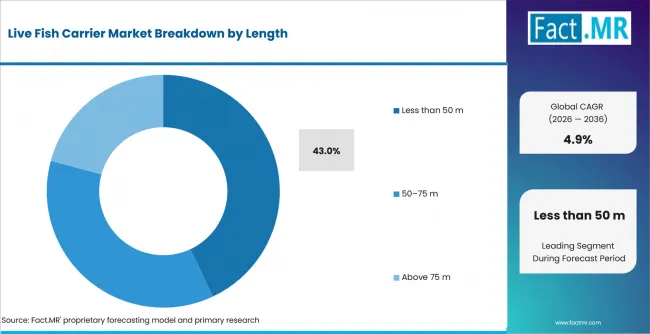
Live Fish Carrier Market Analysis By Length | Source: Fact.MR
The category leads because many carrier movements occur within regional aquaculture clusters. Compact Carrier designs can perform repeated transfers without requiring the cost structure associated with large deep-sea vessels. Portable Carrier Systems provide flexibility where operations are distributed across smaller sites, while Regional Utility Carrier configurations can serve recurring support requirements.
The 50–75 m category covers Mid Size Carrier, Industrial Carrier Systems and Multi Compartment Carrier configurations. These vessels can provide additional biomass capacity or allow operators to separate loads within one voyage.
Above 75 m includes Large Scale Carrier, Deep Sea Carrier and Advanced Carrier Systems. Larger vessels can become commercially attractive where operators need greater carrying volume or longer transport endurance, but their utilization must justify higher vessel investment.
Why does Less than 2500 m³ lead Capacity?
Less than 2500 m³ is projected to account for a 55.0% share in 2026.
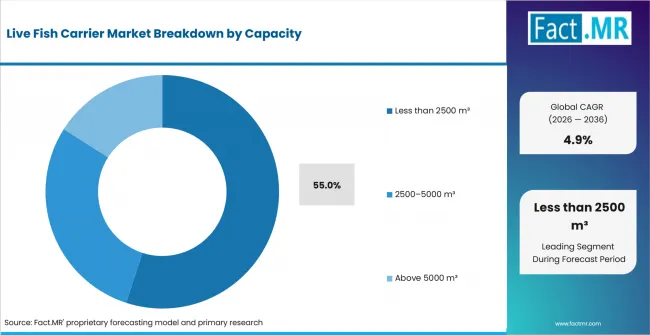
Live Fish Carrier Market Analysis By Capacity | Source: Fact.MR
Less than 2500 m³ leads because Small Capacity Operations can align vessel size with recurring regional movements. Compact Storage Systems reduce the amount of unused holding space when loads are smaller, while Coastal Aquaculture Support can prioritize frequency and route flexibility.
The 2500–5000 m³ category includes Medium Capacity Operations, Balanced Volume Systems and Industrial Aquaculture Logistics. It provides additional scale where one carrier serves larger marine farms or several production sites.
Above 5000 m³ includes Large Capacity Operations, Long Duration Transport and Advanced Industrial Systems. Larger carriers have a clear role where production concentration supports high biomass movements. Sølvtrans has deployed wellboats with multi-thousand-cubic-metre cargo capacities and closed transport technology, illustrating the industry's move toward larger specialized platforms for selected routes.
Why does Aquaculture Farming Transport lead Application?
Aquaculture Farming Transport is forecast to account for a 73.6% share in 2026.
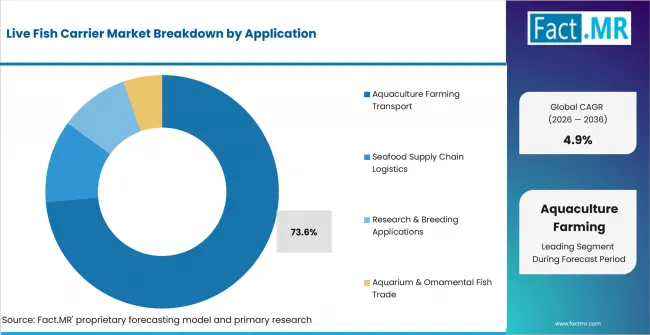
Live Fish Carrier Market Analysis By Application | Source: Fact.MR
Aquaculture Farming Transport leads because Hatchery to Farm Transfer and Farm to Processing Transfer sit directly inside the production cycle. Fish cannot be treated like conventional cargo. Water conditions and handling speed affect the biological condition of the load.
NOAA describes farmed Atlantic salmon being moved from hatcheries to marine net pens in aerated tanks. Commercial wellboat operators extend the same operating principle to larger marine production systems.
Seafood Supply Chain Logistics includes Wholesale Fish Distribution and Retail Supply Distribution where live delivery forms part of the commercial proposition.
Research & Breeding Applications cover Aquatic Research Transport and Breeding Stock Transport. These movements can require tighter control because individual animals may carry greater biological value.
Aquarium & Ornamental Fish Trade includes Export Ornamental Fish Transport and Domestic Aquarium Supply. The volumes can be smaller, but survival during transport remains central to commercial value.
What is accelerating Live Fish Carrier Market adoption, and what is holding it back?
Aquaculture expansion and tighter control of fish welfare support carrier investment. Biosecurity requirements strengthen the case for closed systems. Adoption can still be delayed by vessel capital cost and the operational burden of cleaning between biological loads.
Drivers Impact Analysis
| Driver | (~) % Impact on CAGR | Geographic Relevance | Impact Timeline |
|---|---|---|---|
| Expansion of commercial aquaculture production | +1.5% | Global aquaculture markets | Current forecast period |
| Greater focus on controlled live-fish transport | +1.1% | USA and European aquaculture regions | Short term (<= 2 years) |
| Biosecurity requirements for fish movements | +0.8% | European marine aquaculture | Medium term (2–4 years) |
| Renewal of specialized wellboat fleets | +0.6% | Marine farming clusters | Medium term (2–4 years) |
Source: Fact.MR analysis. Updated Aug 14, 2026
- Aquaculture production: FAO reported a record 103 million tonnes of aquaculture aquatic-animal production in 2024. A larger farming base increases the number of biological movements required within production networks.
- Controlled transport: Fish remain part of the production process while onboard. The carrier therefore has to maintain conditions rather than merely move biomass.
- Biosecurity: Disease-transfer risk gives closed circulation and effective cleaning greater commercial importance.
- Fleet renewal: New circulation systems are being developed around lower energy demand and more controlled water flow, giving operators an efficiency case for replacing older equipment.
Opportunity Impact Analysis
| Opportunity | (~) % Impact on CAGR | Geographic Relevance | Impact Timeline |
|---|---|---|---|
| Closed-circulation transport systems | +0.8% | Norway-linked and UK aquaculture operations | Short term (<= 2 years) |
| Advanced onboard water treatment | +0.7% | Long-distance carrier routes | Medium term (2–4 years) |
| Energy-efficient circulation technology | +0.5% | European and Asian operators | Medium term (2–4 years) |
| Automated fish handling and monitoring | +0.4% | Industrial aquaculture markets | Long term (>= 4 years) |
Source: Fact.MR analysis. Updated Aug 14, 2026
- Closed circulation: Keeping transport water contained can reduce interaction between the transported load and surrounding seawater. Sølvtrans uses closed-system live fish transport between marine cages and downstream facilities.
- Water treatment: Long trips create a stronger requirement to maintain safe onboard conditions. MMC First Process offers water-treatment technology for live fish carriers designed to address water-quality challenges during extended operations.
- Energy efficiency: Circulation is a continuous operating requirement, so reducing pumping energy can improve carrier economics over repeated voyages.
- Automation: Integrated fish-handling systems can connect biomass movement with water management and onboard controls.
Restraints Impact Analysis
| Restraint | (~) % Impact on CAGR | Geographic Relevance | Impact Timeline |
|---|---|---|---|
| High vessel investment and financing requirement | -0.9% | Global operators | Short term (<= 2 years) |
| Biosecurity risk during live-fish movements | -0.7% | Marine aquaculture regions | Current forecast period |
| Cleaning and disinfection downtime | -0.6% | European aquaculture fleets | Short term (<= 2 years) |
| Energy requirement during closed transport | -0.4% | Long-distance routes | Medium term (2–4 years) |
Source: Fact.MR analysis. Updated Aug 14, 2026
- Capital burden: Specialized tanks and life-support equipment increase the investment needed to commission a dedicated carrier.
- Biosecurity exposure: Moving fish between sites creates a potential route for disease movement when containment or hygiene controls fail.
- Cleaning requirements: Repeated biological loads require vessel systems that can be cleaned effectively before subsequent operations. Hygiene therefore affects available operating days as well as vessel design.
- Energy requirement: Pumps and water treatment consume energy during transport. Improved circulation design can reduce this burden, but installed efficiency varies across fleets.
The impact percentages are approximate Fact.MR modeled directional contributions used to show relative influence on the forecast CAGR.
Which countries are scaling the Live Fish Carrier Market fastest?
The USA is projected to record 5.3% CAGR from 2026 to 2036. Germany follows at 5.0%, South Korea at 4.8%, while the UK and France each record 4.4%. Italy is forecast at 4.2% and Japan at 4.1%.
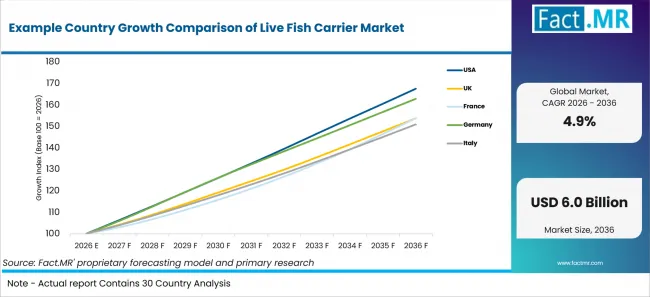
Example Country Growth Comparison Of Live Fish Carrier Market | Source: Fact.MR
| Country | CAGR (2026–2036) |
|---|---|
| USA | 5.3% |
| Germany | 5.0% |
| South Korea | 4.8% |
| UK | 4.4% |
| France | 4.4% |
| Italy | 4.2% |
| Japan | 4.1% |
Source: Fact.MR analysis. Updated Aug 14, 2026
What supports USA demand?
5.3% CAGR through 2036.
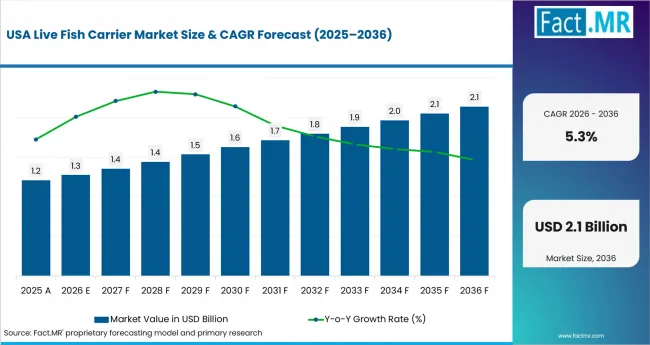
Live Fish Carrier Market Country Value Analysis | Source: Fact.MR
The USA is projected to record 5.3% CAGR through 2036.
Marine finfish aquaculture provides a direct use case for controlled live-fish movement. NOAA describes Atlantic salmon being raised in on-land hatcheries before the fish are transferred in aerated water tanks to marine net pens. This makes transport equipment part of the transition between freshwater and saltwater production stages.
NOAA has also continued work on marine aquaculture development. In 2025 it identified Aquaculture Opportunity Areas in federal waters, while further siting work continued in 2026. Expansion of marine production capacity can create downstream demand for transfer and support equipment when commercial farms move from development into operation.
What is shaping Germany growth?
5.0% CAGR through 2036.
Germany is forecast to expand at 5.0% CAGR through 2036.
EUMOFA reports that Germany produced around 35,000 tonnes of aquaculture products in 2023. Its domestic aquaculture base is smaller than several other European producers, which limits the scale of direct marine wellboat demand.
The commercial opportunity therefore includes specialized transport systems and technology supplied into the wider European aquaculture industry. German engineering procurement can participate through onboard components and vessel systems even when the carrier operates outside German waters.
What is driving South Korea demand?
4.8% CAGR through 2036.
South Korea is projected to advance at 4.8% CAGR through 2036.
The Ministry of Oceans and Fisheries has set a long-term goal of increasing aquaculture fish production from 86,000 tonnes in 2017 to 200,000 tonnes by 2030 while increasing smart-farm penetration.
Policy direction has continued toward automation and higher-value aquaculture. In February 2026, the ministry outlined measures covering land-based smart aquaculture and expansion of automated farms. These changes can raise demand for controlled fish transfer between breeding, growing and downstream production stages.
What supports the UK outlook?
4.4% CAGR through 2036.
The UK is anticipated to record 4.4% CAGR through 2036.
Scotland provides the clearest commercial base. Atlantic salmon production reached 192,000 tonnes in 2024, up 27% from the previous year.
Large salmon production systems require recurring movement of fish across biological stages. Carrier suppliers therefore compete on fish welfare and operating reliability alongside capacity. A vessel that can maintain water conditions and reduce transfer stress can support more predictable farm operations.
How is France developing demand?
4.4% CAGR through 2036.
France is forecast to post 4.4% CAGR through 2036.
France was the EU's second-largest aquaculture producer in 2023. EUMOFA reports that 82% of French aquaculture production occurred in sea or brackish water.
The production mix is broader than the salmon-focused wellboat model seen in northern Europe. Live Fish Carrier demand therefore depends on species and production method. Marine cage production creates a more direct fit, while shellfish and fixed-site farming have different logistics requirements.
What is supporting Italy demand?
4.2% CAGR through 2036.
Italy is expected to record 4.2% CAGR through 2036.
Italy produced around 130,000 tonnes of aquaculture products in 2023 and ranked fourth among EU-27 countries by aquaculture production. Around 71% of Italian production occurred in marine or brackish water.
Marine finfish production creates the clearest addressable demand for live carriers. Vessel configurations have to fit Mediterranean operating conditions and the economics of individual farming clusters rather than copy the larger North Atlantic wellboat model.
What underpins Japan demand?
4.1% CAGR through 2036.
Japan is projected to grow at 4.1% CAGR through 2036.
Japan's Fisheries Agency has an aquaculture growth strategy built around strategic farmed species and closer coordination from production through sales and exports. The strategy also highlights technology development around large-scale offshore aquaculture and product-quality management.
Live transport has a role where juvenile or production fish need to move between sites without losing biological value. Adoption is likely to remain application-specific because Japan's aquaculture structure covers several species and production methods rather than one dominant carrier model.
Who are the key companies in the Live Fish Carrier Market?
The company set includes vessel designers and equipment suppliers alongside aquaculture operators and live-fish transport specialists. Competitive positioning depends on how well a supplier connects vessel capacity with fish handling, water management and operating support.
Sølvtrans provides closed-system live fish transport from marine cages to waiting cages or processing facilities and also operates dedicated smolt vessels. Its public technical material emphasizes closed circulation and continuous monitoring of onboard water conditions.
MMC First Process supplies fish-handling systems for live fish carriers, including circulation equipment and water-treatment systems. Its carrier solutions integrate handling functions with onboard control and water management.
Competition through 2036 is expected to centre on vessel utilization and fish survival during transport. Providers that reduce handling stress or shorten cleaning cycles can influence operating economics beyond initial vessel price.
Which companies are the key providers?
Key companies include Aas Mek Verksted AS; Adria Winch; Arctic Group; Oliverdesign; Palfinger Marine; Peak Marine Tech; Salt Ship Design; Sterner AS; Skipskompetanse AS; Moen Marin; MMC First Process; Sølvtrans; and Mowi.
- Aas Mek Verksted AS
- Adria Winch
- Arctic Group
- Oliverdesign
- Palfinger Marine
- Peak Marine Tech
- Salt Ship Design
- Sterner AS
- Skipskompetanse AS
- Moen Marin
- MMC First Process
- Sølvtrans
- Mowi
Bibliography
- Food and Agriculture Organization of the United Nations. The State of World Fisheries and Aquaculture 2026.
- NOAA Fisheries. Atlantic Salmon: Aquaculture.
- NOAA Fisheries. Aquaculture Opportunity Areas.
- Scottish Government. Scottish Fish Farm Production Survey 2024.
- European Market Observatory for Fisheries and Aquaculture Products. France Country Profile.
- European Market Observatory for Fisheries and Aquaculture Products. Germany Country Profile.
- European Market Observatory for Fisheries and Aquaculture Products. Italy Country Profile.
- Ministry of Oceans and Fisheries, Republic of Korea. Fisheries Innovation 2030.
- Ministry of Oceans and Fisheries, Republic of Korea. 2026 Fisheries Policy Direction.
- Fisheries Agency, Japan. Comprehensive Strategy for the Transformation of Aquaculture into a Growth Industry.
- Norwegian Veterinary Institute. Biosecurity and Transportation of Fish.
- Sølvtrans. Live Fish Transport Services and Sustainability.
- MMC First Process. Fish Handling Systems for Live Fish Carriers.
- MMC First Process. Water Treatment Technology for Live Fish Carriers.
This Report Answers
- The report provides strategic intelligence on Live Fish Carrier demand across Product, Length, Capacity and Application.
- Segment analysis explains how marine and freshwater configurations serve different aquaculture transport requirements.
- Application assessment examines farm transfers alongside seafood logistics and breeding movements.
- Country analysis evaluates operating conditions across the listed national markets.
- Competitive analysis covers vessel specialists and aquaculture-equipment suppliers alongside integrated fish producers.
- Commercial assessment examines fish welfare and biosecurity together with carrier utilization and onboard water management.
What does the Live Fish Carrier Market cover?
The market covers vessels and integrated carrier systems designed to move live fish while maintaining conditions required for survival during transport.
Coverage includes Salt Water Carrier, Fresh Water Carrier and Mixed Carrier configurations. Length coverage ranges from vessels below 50 m to units above 75 m. Capacity coverage extends from Less than 2500 m³ to Above 5000 m³.
Applications include Hatchery to Farm Transfer and Farm to Processing Transfer under Aquaculture Farming Transport. Seafood Supply Chain Logistics and Research & Breeding Applications are included where the transported fish remain alive. Aquarium & Ornamental Fish Trade is included within the stated taxonomy.
What is included in the scope?
The scope includes dedicated live-fish carrier vessels and onboard systems when those systems form part of the commercial carrier configuration.
Tank systems and circulation equipment are included when integrated into the carrier. Water treatment and fish-handling equipment are included where supplied as part of carrier functionality.
The scope includes marine and freshwater transport across the supplied Product taxonomy. It also includes carrier configurations categorized by Length and Capacity.
What is excluded from the scope?
Conventional seafood transport where fish are already harvested and no longer transported alive is excluded.
Ordinary refrigerated cargo vessels and fishing vessels used only to catch wild fish fall outside the market unless they are specifically configured for live-fish transport.
Standalone aquaculture farm equipment is excluded when it is not part of a carrier system. General port infrastructure and seafood-processing revenue are also outside the assessed market.
How Was the Analysis Built?
The analysis uses the defined market taxonomy as the boundary for demand assessment and evaluates carrier economics against aquaculture operating requirements.
- Primary Research
- Primary research covers perspectives from aquaculture operators and vessel suppliers together with fish-handling specialists and marine engineering participants. Research discussions assess transfer frequency and species requirements alongside vessel utilization and water-management needs.
- Desk Research
- Desk research reviews official aquaculture statistics and fisheries policy. It also considers fish-health guidance and public technical information from live-fish carrier specialists. Country assessment is supported by FAO and national fisheries authorities together with European Commission aquaculture sources.
- Market Sizing and Forecasting
- Market sizing evaluates demand across Product, Length, Capacity and Application. Forecast interpretation considers the scale of aquaculture production and the frequency of live transfers, plus carrier replacement requirements.
- Country forecasts account for local aquaculture structures and the role of marine farming within each market.
- Data Validation and Update Cycle
- Forecast interpretation is checked against changes in aquaculture production and fish-health requirements. Public company information is reviewed to assess current vessel and onboard-system capabilities.
Segmentation
What is the report scope and coverage?
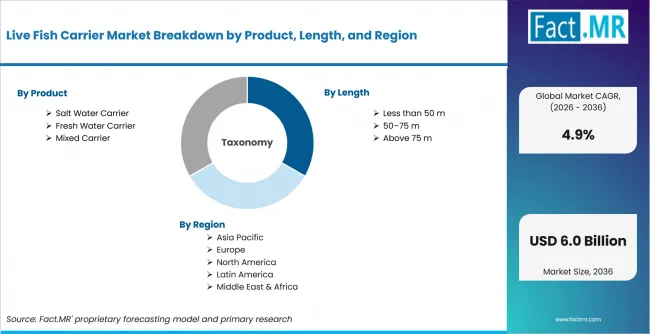
Live Fish Carrier Market Breakdown By Product, Length, And Region | Source: Fact.MR
| Attribute | Details |
|---|---|
| Quantitative Units | USD Billion |
| Market Definition | Commercial value associated with live fish carrier vessels and carrier systems used to transport live aquatic stock within the defined Product, Length, Capacity and Application taxonomy |
| Product | Salt Water Carrier; Fresh Water Carrier; Mixed Carrier |
| Length | Less than 50 m; 50–75 m; Above 75 m |
| Capacity | Less than 2500 m³; 2500–5000 m³; Above 5000 m³ |
| Application | Aquaculture Farming Transport; Seafood Supply Chain Logistics; Research & Breeding Applications; Aquarium & Ornamental Fish Trade |
| Countries Covered | USA; UK; France; Germany; Italy; South Korea; Japan and more |
| Key Companies Profiled | Aas Mek Verksted AS; Adria Winch; Arctic Group; Oliverdesign; Palfinger Marine; Peak Marine Tech; Salt Ship Design; Sterner AS; Skipskompetanse AS; Moen Marin; MMC First Process; Sølvtrans; Mowi |
| Forecast Period | 2026 to 2036 |
| Approach | Assessment of carrier demand against aquaculture production cycles, vessel configuration, fish-handling requirements, capacity utilization and country operating conditions |
Source: Fact.MR analysis. Updated Aug 14, 2026
How is the market segmented?
-
By Product:
- Salt Water Carrier
- Open Sea Carrier
- Coastal Carrier
- Live Holding Carrier
- Fresh Water Carrier
- Inland Water Carrier
- Aquaculture Support Carrier
- Containment Carrier
- Mixed Carrier
- Dual Water Compatibility Carrier
- Hybrid Transport Carrier
- Long Distance Mixed Carrier
- Salt Water Carrier
-
By Length:
- Less than 50 m
- Compact Carrier
- Portable Carrier Systems
- Regional Utility Carrier
- 50–75 m
- Mid Size Carrier
- Industrial Carrier Systems
- Multi Compartment Carrier
- Above 75 m
- Large Scale Carrier
- Deep Sea Carrier
- Advanced Carrier Systems
- Less than 50 m
-
By Capacity:
- Less than 2500 m³
- Small Capacity Operations
- Compact Storage Systems
- Coastal Aquaculture Support
- 2500–5000 m³
- Medium Capacity Operations
- Balanced Volume Systems
- Industrial Aquaculture Logistics
- Above 5000 m³
- Large Capacity Operations
- Long Duration Transport
- Advanced Industrial Systems
- Less than 2500 m³
-
By Application:
- Aquaculture Farming Transport
- Hatchery to Farm Transfer
- Farm to Processing Transfer
- Seafood Supply Chain Logistics
- Wholesale Fish Distribution
- Retail Supply Distribution
- Research & Breeding Applications
- Aquatic Research Transport
- Breeding Stock Transport
- Aquarium & Ornamental Fish Trade
- Export Ornamental Fish Transport
- Domestic Aquarium Supply
- Aquaculture Farming Transport
-
By Region:
- North America
- Latin America
- Western Europe
- Eastern Europe
- East Asia
- South Asia and Pacific
- Middle East & Africa
Frequently Asked Questions
What is the Live Fish Carrier Market worth in 2026?
What was the market worth in 2025?
What is the Live Fish Carrier Market forecast for 2036?
What absolute opportunity is expected between 2026 and 2036?
Which Product leads the Live Fish Carrier Market?
Which Length leads the market?
Which Capacity leads the market?
Which Application leads the market?
Which country records the highest listed CAGR?
How does Germany perform?
How does South Korea perform?
How does the UK perform?
How does France perform?
How does Italy perform?
How does Japan perform?
Which companies are active in the Live Fish Carrier Market?
Who worked on this report


Preview the report firsthand - request a free sample
Free SampleGet the brochure for pricing and purchase details
Download PDF