- Market Value (2025): USD 495.7 Mn
- Estimated Value (2026): USD 575.0 Mn
- Forecast Value (2036): USD 2537.0 Mn
- CAGR (2026-2036): 16.0%
What is the Marine Anti-Fouling Films Market forecast to be worth by 2036?
USD 575.0 million in 2026 to USD 2537.0 million by 2036, at a 16.0% CAGR.
- The marine anti-fouling films market reached USD 495.7 million in 2025.
- Demand is projected to increase from USD 575.0 million in 2026 to USD 2537.0 million by 2036.
- The market is forecast to record a 16.0% CAGR from 2026 to 2036 as ship operators and coating teams prioritize clean-hull efficiency, drydock planning and verified antifouling performance.
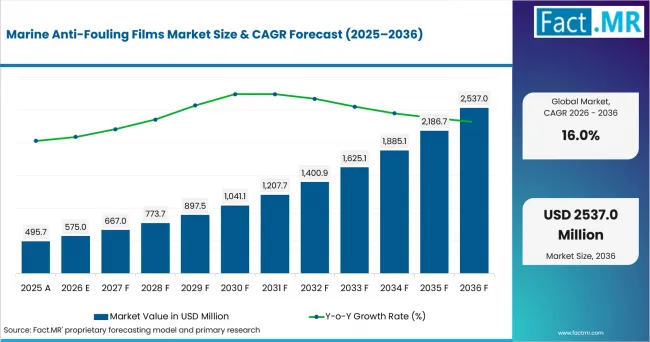
Marine Anti Fouling Films Market Value Analysis | Source: Fact.MR
What are the defining numbers behind Marine Anti-Fouling Films Market growth?
USD 1962.0 million absolute opportunity by 2036, led by bio-polyesters, hull applications and commercial vessels.
- Demand Drivers in the Market
- Commercial vessel owners need longer clean-hull intervals because biofouling raises drag and fuel use between dockings. IMO attention to biofouling management adds value to films that hold surface condition during inspection and cleaning.
- Shipyards need film systems that apply cleanly to hull surfaces and reduce coating disruption during scheduled drydock windows.
- IMO guidance addresses waste substances from in-water cleaning, including biocides, plastics and microplastics, as well as potential effects on antifouling-coating condition.
- Port fleets need durable anti-fouling surfaces because IMO guidance issued in April 2025 links hull cleaning with coating damage and waste capture. That raises interest in films that tolerate controlled cleaning near terminals.
- Performance teams need measurable speed-loss data because hull condition now affects fuel-efficiency and carbon-intensity reviews.
- Key Segments Analyzed
- By Material: Bio-polyesters are expected to hold 38.0% share in 2026, supported by film-forming performance and rising interest in lower-biocide hull surfaces.
- By Vessel Area: Hull is projected to account for 41.0% share in 2026 because hull fouling has the clearest link with drag, fuel use and docking economics.
- By Function: Anti-fouling is anticipated to capture 44.0% share in 2026 as vessel owners treat fouling prevention as the core purchase reason.
- By Vessel Type: Commercial vessels are estimated to represent 44.0% share in 2026 owing to higher operating hours and greater sensitivity to speed loss.
- Analyst Opinion at Fact.MR
- Shambhu Nath Jha, Principal Consultant at Fact.MR, states, “Clean-hull performance now links with fuel cost and vessel availability. Film suppliers are expected to gain when they prove antifouling life, surface integrity and cleaning compatibility together.”
- Strategic Implications
- Film suppliers should document speed-loss behavior, cleaning tolerance and coating compatibility by vessel class. Fleet teams need proof that film surfaces maintain performance across idle days and cleaning events.
- Shipyards should align film application with drydock schedules so owners avoid extra off-hire time. Application guides should show primer selection and repair steps before the vessel enters the yard.
- Coating formulators should use coating binders that balance antifouling performance with lower environmental release risk.
- Fleet managers should compare film cost with fuel, cleaning and inspection savings over the full docking interval. The comparison should include speed-loss records and any added inspection time at the next drydock.
The USA leads displayed growth at 19.2%, followed by Germany at 18.5%, Japan at 16.7%, South Korea at 14.8% and the UK at 14.0%. Port investment and ship-service depth separate the higher-growth group from markets where retrofit timing is more selective.
How does the Marine Anti-Fouling Films Market break down by segment?
Bio-polyesters lead Material at 38.0%; Hull leads Vessel Area at 41.0%.
Which Material leads?
Bio-polyesters are expected to hold 38.0% share in 2026.
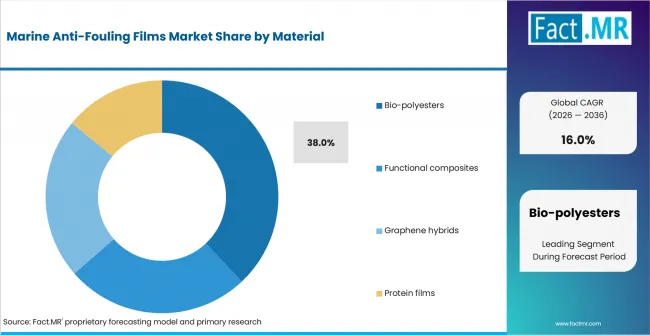
Marine Anti Fouling Films Market Analysis By Material | Source: Fact.MR
Bio-polyesters lead because film makers need binder systems that hold surface integrity during immersion. The linked development of bio anti-fouling polymers makes these materials relevant where formulators want lower-biocide hull protection.
What leads the Vessel Area segment?
Hull is projected to account for 41.0% share in 2026.
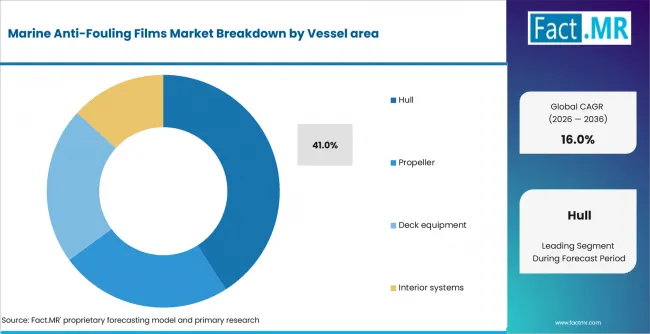
Marine Anti Fouling Films Market Analysis By Vessel Area | Source: Fact.MR
Hull applications lead because underwater surface condition directly changes vessel resistance. Adjacent hull coatings work shows why broad underwater coverage receives the first budget review during drydock planning.
How does Function shape demand?
Anti-fouling is anticipated to lead with 44.0% share in 2026.
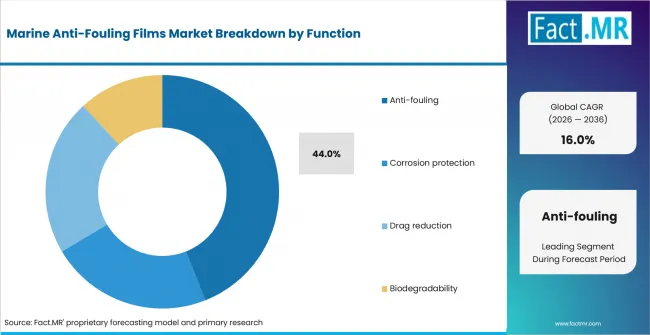
Marine Anti Fouling Films Market Analysis By Function | Source: Fact.MR
Anti-fouling leads because the film must prevent organism attachment before drag and cleaning cost rises. Corrosion protection remains tied to anti-corrosion coatings when owners evaluate underwater surface life.
PPG reported in July 2025 that SIGMAGLIDE 2390 was recognized for biocide-free fouling protection and lower overspray through electrostatic application. Its product page states power savings of up to 20% and speed loss below 1% under stated conditions.
What supports Commercial vessels within Vessel Type?
Commercial vessels are estimated to represent 44.0% share in 2026.
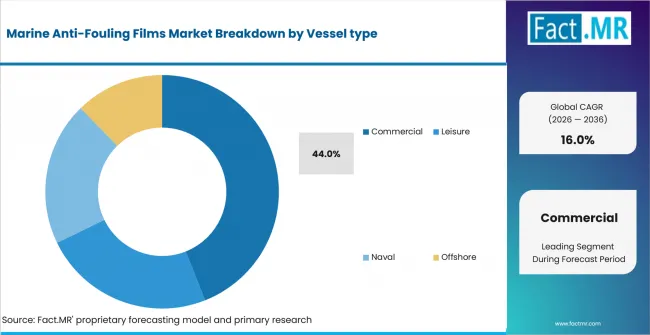
Marine Anti Fouling Films Market Analysis By Vessel Type | Source: Fact.MR
Commercial vessels lead because they spend more days in service and have clearer fuel-cost exposure. Fixed docking programs create repeatable windows for hull-film conversion.
What is accelerating Marine Anti-Fouling Films Market adoption, and what is holding it back?
Demand is expected to rise through clean-hull economics and biofouling rules. Docking cycles, qualification work and cleaning documentation shape the pace of adoption.
Drivers Impact Analysis
| DRIVER | (~) % IMPACT ON CAGR | GEOGRAPHIC RELEVANCE | IMPACT TIMELINE |
|---|---|---|---|
| Clean-hull fuel and speed-loss economics | +1.8% | Global | Short term (<= 2 years) |
| Biofouling and in-water cleaning guidance | +1.3% | Global | Medium term (2-4 years) |
| Lower-biocide polymer and binder development | +1.0% | Europe, East Asia | Medium term (2-4 years) |
| Port and drydock modernization | +0.8% | North America, East Asia | Long term (>= 4 years) |
Source: Fact.MR analysis. Updated Aug 27, 2026
- Clean-hull fuel and speed-loss economics: Vessel owners value surfaces that hold smoothness over long service intervals and reduce cleaning surprises.
- Biofouling and in-water cleaning guidance: IMO attention to cleaning risks raises demand for surfaces that tolerate inspection and controlled cleaning.
- Lower-biocide polymer and binder development: Formulators are testing binder systems that reduce environmental release while keeping antifouling action effective.
Opportunity Impact Analysis
| OPPORTUNITY | (~) % IMPACT ON CAGR | GEOGRAPHIC RELEVANCE | IMPACT TIMELINE |
|---|---|---|---|
| Biocide-free foul-release films | +1.2% | Europe, North America | Medium term (2-4 years) |
| Verified hull-performance packages | +0.9% | Global | Short term (<= 2 years) |
| Propeller and niche-area film systems | +0.6% | East Asia, Europe | Long term (>= 4 years) |
Source: Fact.MR analysis. Updated Aug 27, 2026
- Biocide-free foul-release films: PPG and other coating providers show how silicone-based surfaces can compete where operators want fouling control with lower biocide reliance.
- Verified hull-performance packages: DNV and RightShip-linked records make fuel and speed outcomes easier for fleet managers to defend internally.
- Propeller and niche-area film systems: Smaller underwater surfaces need tailored film formats because fouling around running gear can still disturb efficiency.
Restraints Impact Analysis
| RESTRAINT | (~) % IMPACT ON CAGR | GEOGRAPHIC RELEVANCE | IMPACT TIMELINE |
|---|---|---|---|
| Drydock qualification and off-hire cost | -0.6% | Global | Short term (<= 2 years) |
| Coating-film compatibility risk | -0.4% | Global | Medium term (2-4 years) |
| Cleaning waste and coating damage scrutiny | -0.3% | Europe, North America | Medium term (2-4 years) |
Source: Fact.MR analysis. Updated Aug 27, 2026
- Drydock qualification and off-hire cost: Film conversion competes with standard coating work during fixed maintenance windows.
- Coating-film compatibility risk: Shipyards need proof that primers, binders and film surfaces remain stable through immersion and cleaning cycles.
- Cleaning waste and coating damage scrutiny: IMO guidance addresses coating-damage risk and sets conditions and performance expectations for in-water cleaning with and without waste capture.
Which countries are scaling the Marine Anti-Fouling Films Market through 2036?
- The country comparison spans 5.2 percentage points between the USA and the UK across the forecast period.
- The USA remains 0.7 percentage point above Germany as port investment and marine GDP create a larger service base.
- Germany remains 1.8 percentage points above Japan as EU reporting pressure and cargo recovery shape hull-maintenance decisions.
- Japan remains 1.9 percentage points above South Korea as port decarbonization and shipbuilding capability support technical qualification.
- South Korea remains 0.8 percentage point above the UK through container throughput and newbuild access.
- The UK closes the displayed range while container traffic growth supports film demand in a softer overall freight setting.
Comparable CAGRs create different entry conditions because port throughput, drydock access, fleet age and environmental rules vary by country. Full report coverage includes North America, Latin America, Western Europe, Eastern Europe, East Asia, South Asia & Pacific, Middle East & Africa.
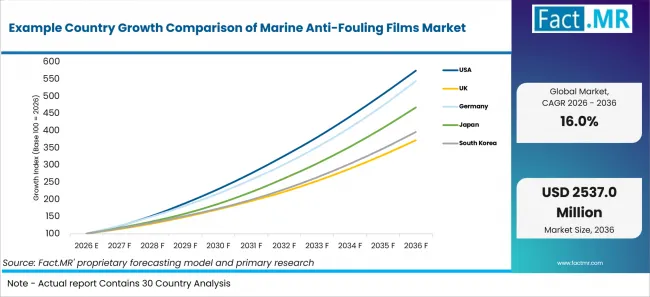
Example Country Growth Comparison Of Marine Anti Fouling Films Market | Source: Fact.MR
| Country | CAGR (2026-2036) |
|---|---|
| USA | 19.2% |
| Germany | 18.5% |
| Japan | 16.7% |
| South Korea | 14.8% |
| UK | 14.0% |
Source: Fact.MR analysis. Updated Aug 27, 2026
What supports USA adoption?
19.2% CAGR, supported by port investment and clean-hull economics.
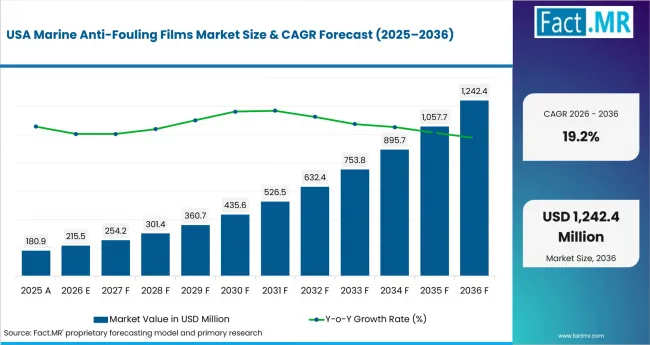
Marine Anti Fouling Films Market Country Value Analysis | Source: Fact.MR
U.S. vessel owners evaluate film systems against fuel exposure and scheduled maintenance time. NOAA reported in March 2026 that the marine economy employed approximately 3.7 million people. The Bureau of Economic Analysis reported in June 2025 that the marine economy accounted for USD 511.0 billion of GDP in 2023. MARAD announced on April 28, 2026 that USD 774 million was invested across 37 port projects.
What supports Germany adoption?
18.5% CAGR, backed by sea freight recovery and EU emissions scrutiny.
Germany's port and ship-service base gives anti-fouling film suppliers a clear retrofit channel. Destatis reported in March 2026 that German seaports handled 284.4 million tonnes of goods in 2025, up 3.8% from 2024. Eurostat reported in December 2025 that Hamburg handled 97 million tonnes of maritime freight in 2024. Germany is forecast to advance at 18.5% CAGR with EU fuel reporting and shipyard qualification lifting demand for documented hull performance. Northern shipyards give film makers a practical route to test compatibility with primers and corrosion-control layers.
How is Japan scaling demand?
16.7% CAGR, led by port decarbonization and shipbuilding capability.
Japan's adoption route starts with port logistics and shipbuilding specification. MLIT reported in August 2026 that Japanese ports handled 22.36 million TEU of container cargo in 2025, up 1.8% from 2024. OECD reported in April 2026 that Japanese shipyards delivered 15.4% of newly built vessels by gross tonnage in 2023. Japan at 16.7% CAGR and interprets port-decarbonization activity and newbuild coating trials as supportive context for hull and propeller film-like systems. Domestic coating suppliers can use quality-focused yards to validate surfaces before expanding across coastal fleets.
How is South Korea developing demand?
14.8% CAGR, supported by container scale and newbuild access.
South Korea's demand is tied to container traffic and newbuild yards that specify underwater systems early. MOF reported in January 2025 that Korean trade ports handled a record 31.73 million TEUs in 2024. The Ministry of Trade, Industry and Energy (MOTIE) reported on July 1, 2025 that ship exports surged 63.4% year on year to USD 2.5 billion in June 2025. South Korea is anticipated to post 14.8% CAGR, led by shipyard access and commercial fleet demand for lower-resistance surfaces. Major yards give suppliers an entry point when films can be applied within planned delivery schedules.
What supports UK growth?
14.0% CAGR, shaped by container activity and stricter cleaning expectations.
The UK marine market has port, ferry and offshore fleets that create repeat drydock demand. The Department for Transport reported on July 29, 2026 that UK ports handled 428.3 million tonnes of freight in 2025. The Department for Transport reported on February 25, 2026 that the UK Ship Register stood at 8.7 million gross tonnes at the end of December 2025. The UK is projected to register 14.0% CAGR where operators seek cleaning-compatible antifouling films for commercial and specialist vessels. Adoption is expected to concentrate around operators that can measure fuel savings and repair time across repeated coastal routes.
Who leads the Marine Anti-Fouling Films Market?
Finsulate B.V. is positioned as a specialist provider within marine anti-fouling film systems, addressing vessel-surface protection where operators seek alternatives to conventional antifouling coatings. Its relevance aligns with demand for film and film-like surfaces that reduce organism attachment while supporting inspection and cleaning requirements.
Mactac / Avery Dennison and HEXIS participate from the specialty-film side of the competitive landscape. Their positioning is relevant where adhesive and functional film technologies can be adapted to hull, propeller and other vessel-area applications requiring durable surface coverage and compatibility with marine operating conditions.
PPG Industries brings established marine-coating and antifouling expertise to the market. Its competitive position is supported by fouling-control technologies designed around surface performance, cleaning compatibility and reduced reliance on conventional biocide-intensive approaches. The report specifically identifies PPG among the key providers assessed in the market.
RENOLIT SE adds polymer-film manufacturing capability to the competitive set, supporting applications where engineered surface films, durability and material consistency influence adoption. Competition therefore centers on antifouling performance, film adhesion, surface integrity, cleaning compatibility and the ability to fit installation or retrofit work within vessel maintenance cycles.
Which companies are the key providers?
Key companies include Finsulate B.V., Mactac / Avery Dennison, HEXIS, PPG Industries, and RENOLIT SE.
- Finsulate B.V.
- Mactac / Avery Dennison
- HEXIS
- PPG Industries
- RENOLIT SE
Bibliography
- PPG. (2025, July 10). PPG SIGMAGLIDE 2390 coating clinches top innovation award.
- UN Trade and Development. (2025, September 24). Review of Maritime Transport 2025: Staying the course in turbulent waters.
- United States Coast Guard. (2025, August 11). 2024 Flag State Control Annual Report.
- European Environment Agency, & European Maritime Safety Agency. (2025, February 4). European Maritime Transport Environmental Report 2025 (EEA-EMSA Joint Report 15/2024).
- International Maritime Organization. (2025, April 29). Guidance on in-water cleaning of ships’ biofouling (MEPC.1/Circ.918).
- Department for Transport. (2026, February 25). Shipping fleet statistics: 2025. GOV.UK.
- Department for Transport. (2026, July 29). Port freight annual statistics: 2025. GOV.UK.
- Ministry of Trade, Industry and Energy. (2025, July 1). Korea’s exports grow 4.3% in June.
- Ministry of Oceans and Fisheries. (2025, January 24). Korea’s ports handle record-high container volume of 31.73 million TEUs in 2024.
- OECD. (2026, April 8). Peer Review of the Japanese Shipbuilding Industry 2026. OECD Publishing.
- Eurostat. (2025, December 4). EU ports handled 3.4 bn tonnes of freight in 2024.
- Federal Statistical Office (Destatis). (2026, March 10). Seeverkehr 2025: Güterumschlag steigt um 3,8 % gegenüber dem Vorjahr [Sea transport 2025: Goods handling rises by 3.8% year on year].
- Maritime Administration. (2026, April 28). Trump’s Transportation Secretary Sean P. Duffy invests nearly $800 million into American ports to strengthen supply chains. U.S. Department of Transportation.
- U.S. Bureau of Economic Analysis. (2025, June 5). Marine Economy Satellite Account, 2023.
- National Oceanic and Atmospheric Administration. (2026, March 18). New NOAA data reveals strength of the U.S. marine economy.
This Report Answers
- The report explains where marine anti-fouling films are used across material, vessel area, function and vessel type. It connects those uses with drydock timing and vessel surface qualification.
- Segment analysis identifies the leading subsegments and the operational reasons vessel operators prioritize them. It reviews why hull, anti-fouling function and commercial vessels take priority in 2026.
- Country analysis reviews the listed markets and the port, fleet or shipbuilding conditions shaping adoption. It uses official port and fleet evidence where local demand needs support.
- Competitive analysis examines active providers across coatings, antifouling ingredients and hull-performance systems. It separates marine coating portfolios from ingredient suppliers that enable antifouling performance.
- Application analysis assesses how film performance, cleaning compatibility and docking economics influence purchase decisions. It gives special attention to surfaces that face inspection and repair during scheduled maintenance.
What does the Marine Anti-Fouling Films Market cover?
The Marine Anti-Fouling Films Market covers film and film-like systems that reduce organism attachment on underwater vessel surfaces. It includes bio-polyester film layers, functional composites and hybrid surfaces used by fleet owners and shipyards.
The assessment covers hull, propeller, deck equipment and interior systems across commercial, leisure, naval and offshore vessels. Adjacent analysis frames where film technologies overlap with established marine coating choices.
What is included in the scope?
The scope includes antifouling film systems, film-forming materials and surface layers where film-like behavior provides fouling control. It also includes corrosion-adjacent systems linked to anti-corrosion coatings when tied to underwater vessel protection.
Products used during drydock work, newbuild coating programs and retrofit maintenance remain in scope. Marine adhesives pages are relevant where bonding affects film application. Protective coating analysis applies when primers shape underwater durability.
What is excluded from the scope?
Decorative marine paints, tank linings, topside coatings and vessel maintenance products fall outside the scope when they lack antifouling or film-like performance. Marine biodegradable polymers are covered only when used on vessel surfaces.
Paint and coating products are covered only when specified for underwater vessel fouling control. Offshore structure coatings, including low-VOC coatings, are included only when they serve floating marine assets.
How Was the Analysis Built?
The analysis draws on 120+ sources, 35+ company portfolios, 25+ countries, and more than 20 industry interviews.
- Primary Research: Primary research includes discussions with manufacturers, service providers, technology developers, distributors, end users, procurement teams, and subject-matter experts. These conversations examine purchasing priorities, product adoption, operational challenges, approval requirements, competitive positioning, and the factors that influence wider market acceptance.
- Desk Research: Desk research covers government statistics, regulatory publications, company filings, trade data, technical studies, industry associations, standards, public policy, and other authoritative sources. Every source used in the analysis is documented in the bibliography.
- Market Sizing and Forecasting: Market estimates combine historical performance, demand indicators, pricing and volume trends, segment shares, company participation, country-level growth, adoption patterns, investment activity, and barriers to market expansion.
- Data Validation and Update Cycle: Findings are validated by comparing primary interviews with public data, company activity, regulatory changes, trade patterns, and industry developments. Regular updates review new product launches, capacity changes, partnerships, approvals, procurement trends, and shifts in commercial adoption.
Segmentation
What is the report's scope and coverage?
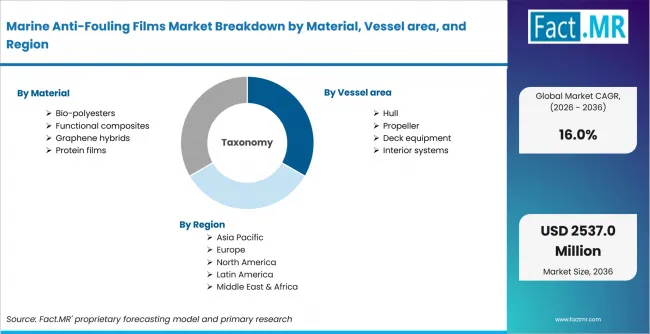
Marine Anti Fouling Films Market Breakdown By Material, Vessel Area, And Region | Source: Fact.MR
| Attribute | Details |
|---|---|
| Quantitative Units | USD million |
| Market Definition | Films and film-like antifouling surface systems used on vessel hulls, propellers, deck equipment and interior marine systems to reduce fouling, drag, corrosion exposure or marine biodegradation concerns. |
| Material | Bio-polyesters; Functional composites; Graphene hybrids; Protein films |
| Vessel Area | Hull; Propeller; Deck equipment; Interior systems |
| Function | Anti-fouling; Corrosion protection; Drag reduction; Biodegradability |
| Vessel Type | Commercial; Leisure; Naval; Offshore |
| Regions Covered | North America; Latin America; Western Europe; Eastern Europe; East Asia; South Asia & Pacific; Middle East & Africa |
| Countries Covered | USA; UK; Germany; Japan; South Korea |
| Key Companies Profiled | Finsulate B.V.; Mactac / Avery Dennison; HEXIS; PPG Industries; RENOLIT SE |
| Forecast Period | 2026 to 2036 |
| Approach | Hybrid top-down and bottom-up approach using vessel maintenance cycles, antifouling material adoption, country cargo indicators, coating portfolio review and supplier activity. |
Source: Fact.MR analysis. Updated Aug 27, 2026
How is the market segmented?
-
By Material:
- Bio-polyesters
- Functional composites
- Graphene hybrids
- Protein films
-
By Vessel Area:
- Hull
- Propeller
- Deck equipment
- Interior systems
-
By Function:
- Anti-fouling
- Corrosion protection
- Drag reduction
- Biodegradability
-
By Vessel Type:
- Commercial
- Leisure
- Naval
- Offshore
-
By Region:
- North America
- Latin America
- Western Europe
- Eastern Europe
- East Asia
- South Asia & Pacific
- Middle East & Africa
Frequently Asked Questions
How big is the marine anti-fouling films market in 2026?
What is the CAGR of the marine anti-fouling films market from 2026 to 2036?
Which material leads the marine anti-fouling films market?
Which vessel area leads the marine anti-fouling films market?
Who are the leading companies in the marine anti-fouling films market?
Who worked on this report


Preview the report firsthand - request a free sample
Free SampleGet the brochure for pricing and purchase details
Download PDF