- Market Value (2025): USD 123.2 Bn
- Estimated Value (2026): USD 138.8 Bn
- Forecast Value (2036): USD 458.8 Bn
- CAGR (2026-2036): 12.7%
What is the Ride-Hailing Service Market forecast to be worth by 2036?
USD 138.8 billion in 2026 to USD 458.8 billion by 2036 at a 12.7% CAGR.
- The Ride-Hailing Service Market reached USD 123.2 billion in 2025.
- Demand is projected to increase from USD 138.8 billion in 2026 to USD 458.8 billion by 2036.
- The market is projected to expand at a 12.7% CAGR from 2026 to 2036.
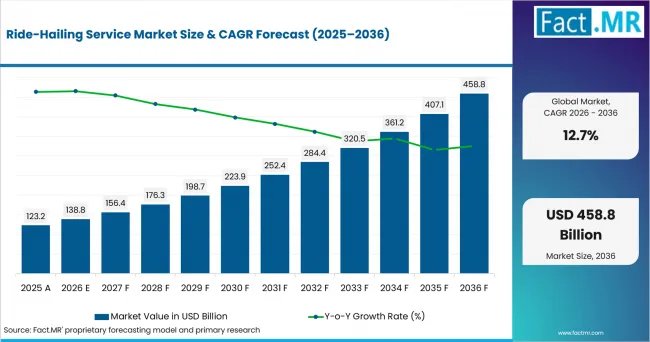
Ride Hailing Service Market Value Analysis | Source: Fact.MR
What are the defining numbers behind Ride-Hailing Service Market growth?
An absolute opportunity of USD 320.0 billion is expected between 2026 and 2036.
- Demand Drivers in the Market
- Urban population concentration is increasing the number of trips that need flexible door-to-door transport. The World Bank Group reports that more than half of the global population lives in cities and that nearly seven in 10 people are expected to live in urban areas by 2050. Dense residential, employment, retail and airport corridors raise demand for app-based ride hailing because passengers can match a car to a trip without owning a vehicle.
- Mobile internet access and digital payments are reducing booking friction. ITU reported 5.5 billion internet users in 2024, equal to 68% of the world population. U.S. DOT defines ridesourcing as prearranged on-demand transport where drivers and passengers connect through digital applications for booking, payment and ratings. That app layer turns scattered passenger demand into visible, dispatchable demand and gives cities new data for traffic management.
- Airport, leisure and late-evening trips keep personal use active outside routine commuting. Business travelers still use rental and chauffeur channels, but short trips from rail stations, airports and entertainment areas are shifting toward app booking when passengers want transparent pricing and rapid pickup. This gives ride-hailing platforms room beside car rental rather than replacing every travel mode.
- City and state agencies are moving ride-hailing into more formal operating frameworks. ITF notes that app-based mobility services need regulation for safety, consumer protection and environmental outcomes, while the UK Department for Transport shows PHV operators and driver licences growing after the pandemic. Formal licensing improves passenger confidence and gives platforms a clearer base for fleet management.
- Electrification is opening a cost and compliance pathway for high-utilization fleets. IEA's Global EV Outlook 2025 links EV deployment with battery and charging-infrastructure trends, and California's Clean Miles Standard sets zero-emission mile and greenhouse-gas targets for ride-hailing companies. Platforms that can align charging access, driver incentives and vehicle uptime can serve riders while city policies encourage low-emission alternatives to private car use and e-scooter sharing.
- Key Segments Analyzed
- Four Wheeler Ride Hailing accounts for 65.3% of Product in 2026 because cars carry higher-value urban, airport, family and business trips where comfort, luggage capacity and regulated driver supply matter.
- Personal accounts for 71.2% of End User in 2026 as daily commuters, leisure travelers and airport passengers book rides directly through individual app accounts and digital wallets.
- Analyst Opinion at Fact.MR
- Shambhu Nath Jha, Senior Consultant, Fact.MR, states, "Ride-hailing demand is becoming less about novelty and more about dependable urban mobility. The platforms that protect pickup reliability, driver availability, local licensing, transparent fares and safe digital payments will hold repeat riders. Fleet electrification and city partnerships can add another layer of advantage, but only when the service remains affordable and responsive at the curb."
- Strategic Implications
- Platforms should treat driver availability, cancellation control and pickup-time reliability as core commercial levers because personal riders compare services ride by ride.
- City licensing and curb-management rules will become more important as passenger volumes concentrate near airports, rail stations, business districts and night-time economy zones.
- EV transition should be paired with charging access, driver financing and uptime planning so lower operating cost does not become a service-disruption risk.
- Corporate ride-hailing programs need better billing, policy controls, safety documentation and traveler support to compete for business mobility budgets.
- Two- and three-wheeler platforms can grow in price-sensitive corridors, but safety controls, helmet compliance and local licensing will shape how far those modes move beyond commuter use.
How does the Ride-Hailing Service Market break down by segment?
The market is segmented by Product and End User.
Why does Four Wheeler Ride Hailing lead Product?
Four Wheeler Ride Hailing is projected to account for a 65.3% share in 2026.
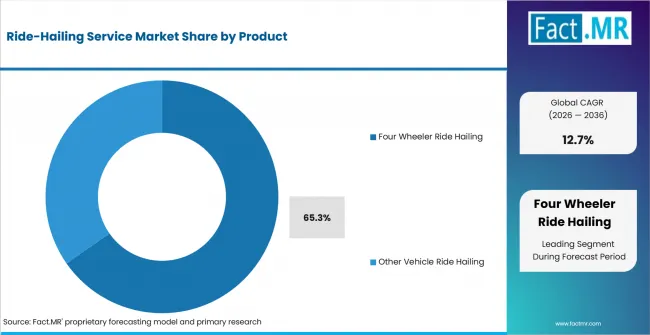
Ride Hailing Service Market Analysis By Product | Source: Fact.MR
Four-wheeler ride hailing leads because cars serve the widest range of paid passenger trips. Daily commuters use them for weather-protected point-to-point trips, airport travelers need luggage space, families prefer enclosed vehicles, and business users need professional dispatch, receipts and predictable journey records.
The U.S. DOT definition of ridesourcing emphasizes app-based booking, electronic payment and ratings, which map naturally to four-wheeler services where driver screening, route tracking and fare transparency influence trust. Four-wheelers also carry higher fare values per trip than two- and three-wheeler services, so they contribute a larger revenue base even where lighter vehicle formats are active.
Other vehicle ride hailing still matters in dense and price-sensitive routes. Two-wheelers and three-wheelers can handle short corridors, congestion and lower fares, but they face narrower use cases when passengers need comfort, luggage capacity, safety assurance or corporate travel documentation.
Why does Personal lead End User?
Personal is projected to account for a 71.2% share in 2026.
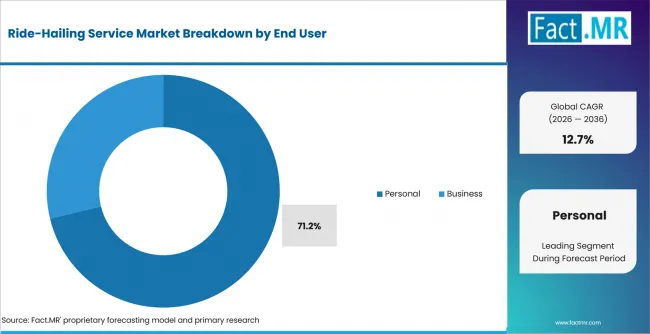
Ride Hailing Service Market Analysis By End User | Source: Fact.MR
Personal use leads because ride hailing is embedded in ordinary trip decisions: commuting, shopping, social travel, airport access, late-evening travel and first-mile or last-mile connections. Individual passengers can book, pay, rate and repeat rides without procurement approval, so demand is less dependent on corporate travel cycles.
World Bank urbanization indicators and ITU connectivity data reinforce the same mechanism. More urban residents are making short trips across dispersed job, retail and leisure nodes, while mobile connectivity makes those trips bookable at the moment of need. Business demand is valuable, but it is filtered through travel policies, expense rules and preferred-supplier arrangements.
What is accelerating Ride-Hailing Service Market adoption, and what is holding it back?
Urbanization, mobile internet access, digital payments, airport and leisure travel, licensed private-hire supply and EV-transition programs are increasing adoption. Labour-classification rules, insurance costs, curb congestion, driver supply swings, local licensing limits and fare sensitivity continue to hold back wider use.
Drivers Impact Analysis
| Factor | (~) % Impact on CAGR | Geographic Relevance | Impact Timeline |
|---|---|---|---|
| Dense urban point-to-point travel demand | +1.8% | Global | Short term (<= 2 years) |
| Mobile booking, digital payment and ratings familiarity | +1.4% | Global | Short term (<= 2 years) |
| Airport, leisure and late-evening trip recovery | +1.0% | USA, U.K. and Japan | Medium term (2-4 years) |
| Formal private-hire licensing and operator recovery | +0.8% | U.K., Germany and USA | Medium term (2-4 years) |
| Flexible app-based driver participation | +0.7% | Brazil, USA and Japan | Short term (<= 2 years) |
Source: Fact.MR analysis. Updated Sep 4, 2026
Opportunity Impact Analysis
| Factor | (~) % Impact on CAGR | Geographic Relevance | Impact Timeline |
|---|---|---|---|
| EV fleet transition and lower energy cost per trip | +1.2% | USA, Germany and Japan | Long term (>= 4 years) |
| Multimodal city integration and mobility-as-a-service booking | +1.0% | Germany, Japan and U.K. | Medium term (2-4 years) |
| TNC partnerships for underserved low-density communities | +0.8% | USA and Brazil | Medium term (2-4 years) |
| Two- and three-wheeler trips in price-sensitive corridors | +0.7% | Brazil and Asia | Short term (<= 2 years) |
Source: Fact.MR analysis. Updated Sep 4, 2026
Restraints Impact Analysis
| Factor | (~) % Impact on CAGR | Geographic Relevance | Impact Timeline |
|---|---|---|---|
| Labour classification, insurance and social protection compliance | -1.2% | Europe, Brazil and USA | Medium term (2-4 years) |
| Congestion, curb access and emissions controls | -0.9% | Global city centers | Short term (<= 2 years) |
| Driver supply volatility and fare inflation | -0.8% | Global | Short term (<= 2 years) |
| Safety, licensing and consumer-protection enforcement | -0.6% | Japan, Germany and U.K. | Medium term (2-4 years) |
Source: Fact.MR analysis. Updated Sep 4, 2026
Which countries are scaling the Ride-Hailing Service Market through 2036?
- Germany: On-demand pooling, public-transport integration and digital mobility studies give ride-hailing suppliers a regulated path, while city rules keep service design tied to licensing, accessibility and emissions expectations.
- Brazil: App-based passenger transport is supported by a large platform-worker base, dense metropolitan travel and lower entry barriers for drivers, although labour protection rules are moving into closer policy focus.
- USA: TNC use is already familiar in metropolitan regions, and public agencies are testing partnerships for low-density communities, first-mile links and clean-mile rules that influence vehicle mix.
- U.K.: Private-hire vehicle licensing, operator growth and app-based booking support ride availability, while safety standards and local licensing controls shape the pace of expansion.
- Japan: Taxi-company-led ride-sharing permissions, inbound tourism and urban taxi shortages are expanding app-booked supply, but service rollout remains bounded by operator supervision and transport-safety rules.
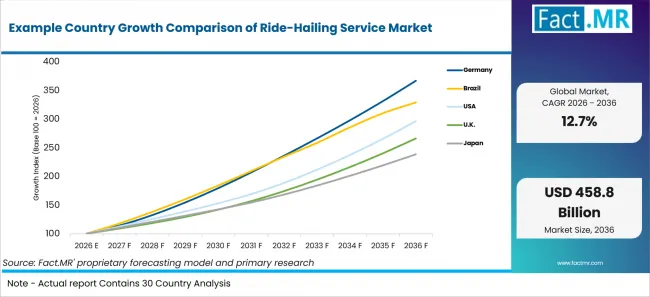
Example Country Growth Comparison Of Ride Hailing Service Market | Source: Fact.MR
| Country | CAGR, 2026-2036 |
|---|---|
| Germany | 13.9% |
| Brazil | 12.7% |
| USA | 11.5% |
| U.K. | 10.3% |
| Japan | 9.1% |
Source: Fact.MR analysis. Updated Sep 4, 2026
What is driving Germany's growth through 2036?
Germany is forecast to expand at a 13.9% CAGR from 2026 to 2036.
Germany's growth is tied to regulated on-demand mobility rather than unconstrained platform entry. The Federal Ministry of Transport describes Mobility in Germany as a cross-sectional study of everyday mobility, trip purpose, transport mode and regional patterns, which gives planners a structured evidence base for matching flexible passenger services to local travel needs.
AccessibleEU describes German on-demand ride pooling as a digitally controlled mobility service that groups passengers traveling in similar directions, with services such as MOIA operating electric minibuses in Hamburg and Hannover. This creates a pathway for app-dispatched rides that can complement public transport, but the model also keeps operators close to local licensing, accessibility and emissions requirements.
What is driving Brazil's growth through 2036?
Brazil is forecast to expand at a 12.7% CAGR from 2026 to 2036.
Brazil's growth is supported by the scale of app-based work and the familiarity of digital passenger transport in metropolitan areas. IBGE reported that the number of app-based workers grew 25.4% between 2022 and 2024, covering taxi apps, private passenger transport apps, delivery and service platforms.
Banco Central do Brasil also noted that workers in passenger-transport and delivery platforms rose from about 770 thousand in 2015 to 2.1 million in the second quarter of 2025. That labour supply helps platforms expand coverage, but it also brings policy attention to social protection, driver income and platform accountability.
What is driving USA's growth through 2036?
The USA is forecast to expand at an 11.5% CAGR from 2026 to 2036.
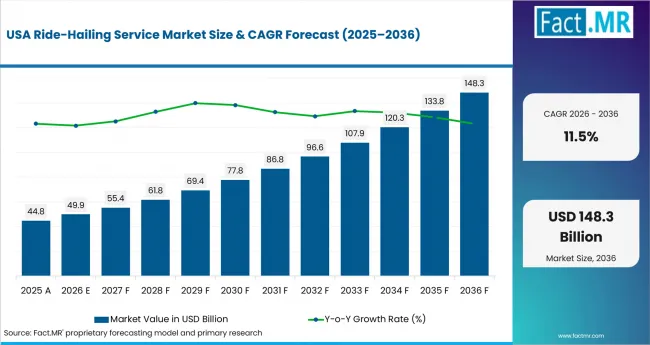
Ride Hailing Service Market Country Value Analysis | Source: Fact.MR
U.S. demand is supported by a mature transportation-network-company framework and established rider familiarity. A U.S. DOT-supported Tennessee study describes ridesourcing, ridesharing and ridehailing as a mode that has grown in popularity since its introduction, with research focused on user characteristics and travel behavior.
Public-sector use cases are also widening. A 2026 U.S. transportation study found that TNC partnerships may help low-density communities where traditional microtransit faces high fixed costs, while California's Clean Miles Standard is pushing ride-hailing companies toward zero-emission miles. Together, these forces support urban, suburban and clean-fleet demand.
What is driving U.K.'s growth through 2036?
The U.K. is forecast to expand at a 10.3% CAGR from 2026 to 2036.
The U.K. market is shaped by the private-hire vehicle base that supports app-booked rides. The Department for Transport reported 313,000 licensed taxi and private hire vehicles in England in 2024, up 8.2% from 2023, and said the upward trend in vehicles and driver licences was being driven by the PHV industry.
Operator formation also supports booking density. DfT reported that licensed PHV operators in England increased to 16,300 in 2024 and that new PHV operator applications rose 30% in the year ending March 2024. Growth therefore comes through licensed dispatch capacity, although safety, local licensing and driver standards remain central to market access.
What is driving Japan's growth through 2036?
Japan is forecast to expand at a 9.1% CAGR from 2026 to 2036.
Japan's growth reflects a more controlled opening of ride-sharing capacity. The Library of Congress reported that Japan allowed taxi companies to operate limited ride-sharing services from April 1, 2024, easing a long-standing restriction while keeping services under operator supervision.
Tourism and taxi availability add to the need for app-booked dispatch. JNTO's tourism statistics platform tracks visitor arrivals, prefecture visits and spending categories, including transport. Inbound travel to major urban and airport corridors gives taxi apps and supervised ride-sharing services a clearer role, while strict transport rules keep adoption focused on licensed operators.
Who Leads the Ride-Hailing Service Market?
Key players in the Ride-Hailing Service Market include Uber, Arro, Capital EV, Curb, Didi Chuxing Technology Co., EEETaxi, Gett, GoGreen Cabs, Gojek, Hitch, inDrive, Lyft, Inc., and Rapido bike taxi.
Competition is shaped by matching density, driver incentives, app reliability, fare transparency, digital payment coverage, customer support, local licensing and insurance compliance. A platform with strong rider demand must still protect driver supply because wait times, cancellations and surge-pricing complaints can shift passengers to another app quickly.
Four-wheeler platforms compete around comfort, pickup reliability, airport corridors, corporate accounts and receipts. EV-focused and local taxi-app brands can differentiate through regulated fleets, lower-emission positioning and city familiarity, while two- and three-wheeler providers compete in shorter, price-sensitive travel corridors.
Which companies are the key providers?
Key providers include Uber, Arro, Capital EV, Curb, Didi Chuxing Technology Co., EEETaxi, Gett, GoGreen Cabs, Gojek, Hitch, inDrive, Lyft, Inc., and Rapido bike taxi.
- Uber
- Arro
- Capital EV
- Curb
- Didi Chuxing Technology Co.
- EEETaxi
- Gett
- GoGreen Cabs
- Gojek
- Hitch
- inDrive
- Lyft, Inc.
- Rapido Bike Taxi
Bibliography
- World Bank Group. (2026). Urban Development. World Bank Group.
- International Telecommunication Union. (2024). Facts and Figures 2024: Internet Use. ITU.
- International Transport Forum. (2019). Regulating App-Based Mobility Services: Summary and Conclusions. OECD Publishing.
- International Transport Forum. (2023). Regulating App-based Mobility Services in ASEAN. OECD Publishing.
- European Union. (2024). Directive (EU) 2024/2831 on improving working conditions in platform work. Official Journal of the European Union.
- U.S. Department of Transportation. (2020). Mobility on Demand Business Models Synthesis Report. Intelligent Transportation Systems Joint Program Office.
- U.S. Department of Transportation. (2021). Investigating the Service of App-Based Rideshare and Transportation Network Companies in Tennessee. Federal Highway Administration.
- California Air Resources Board. (2026). Assessing the Early Impacts of the Clean Miles Standard on California Ride-hailing Drivers. California Air Resources Board.
- Department for Transport. (2024). Taxi and private hire vehicle statistics, England, 2024. UK Government.
- Brazilian Institute of Geography and Statistics. (2025). Number of app-based workers grew 25.4% between 2022 and 2024. IBGE News Agency.
- Banco Central do Brasil. (2025). Efeitos do trabalho por aplicativos no mercado de trabalho. Relatorio de Politica Monetaria.
- Federal Ministry of Transport. (2020). Mobility in Germany. Federal Ministry of Transport.
- European Commission. (2026). On-demand ride pooling - Germany. AccessibleEU.
- Library of Congress. (2024). Japan: Government Allows Taxi Companies to Operate Limited Ride-sharing Services from April 1, 2024. Library of Congress.
- Japan National Tourism Organization. (2026). Japan Tourism Statistics. JNTO.
- International Energy Agency. (2025). Global EV Outlook 2025. IEA.
This Report Answers
- What is the Ride-Hailing Service Market projected to reach by 2036?
- How do urban mobility, app booking, digital payments and licensing rules influence demand?
- Which Product and End User segments hold the leading 2026 shares?
- How are Germany, Brazil, USA, U.K. and Japan shaping country-level growth?
- Which companies are active across global and local ride-hailing service models?
What does the Ride-Hailing Service Market cover?
The Ride-Hailing Service Market covers app-enabled paid passenger transportation in which riders use a digital platform to request, match, book and pay for a journey. The assessment includes four-wheeler ride hailing as well as two- and three-wheeler ride-hailing formats where the platform facilitates passenger transport rather than vehicle rental or delivery.
The market covers personal journeys such as daily commuting, leisure travel, airport transfers and other point-to-point trips. It also includes business use where companies or employees use ride-hailing platforms for corporate transportation, client movement and managed business travel.
Revenue is assessed at the ride-hailing service level. Digital booking, driver matching, route visibility, electronic payment, ratings and trip records are considered part of the service model when they support the passenger journey.
What is included in the scope?
The scope includes Four Wheeler Ride Hailing across economy, premium and shared-mobility service formats. Other Vehicle Ride Hailing includes app-booked two-wheeler and three-wheeler passenger services where such services operate within local transport and licensing frameworks.
Personal end use includes daily commuters, leisure travelers and airport travelers. Business end use includes corporate transportation, client transportation and business travel management where journeys are purchased or administered through a ride-hailing platform.
The assessment includes platform-mediated passenger trips delivered through independent drivers, fleet partners, taxi or private-hire operators and other eligible vehicle providers. It also considers operating factors such as driver availability, digital payments, pricing, safety controls, licensing, insurance, airport access and fleet electrification where these influence ride-hailing demand.
What is excluded from the scope?
The scope excludes conventional passenger transport that is not booked or facilitated through a ride-hailing platform. Traditional street-hail taxi trips, scheduled public bus and rail services and privately operated personal vehicles are outside the core market unless the passenger journey is specifically fulfilled through an app-based ride-hailing service.
Vehicle rental and car-sharing models in which customers take control of the vehicle themselves are excluded. Conventional chauffeur and limousine services are also outside the core scope when they operate independently of a ride-hailing platform.
Food delivery, parcel delivery, freight transportation and last-mile logistics are excluded because the primary transaction does not involve paid passenger movement. Vehicle sales, leasing, charging infrastructure, standalone fleet-management software and payment-processing revenue are also excluded unless their value is incorporated directly into the ride-hailing service transaction.
How Was the Analysis Built?
The analysis draws on public urbanization indicators, internet-access data, app-based mobility regulation, country transport statistics, platform-work policy, clean-fleet rules, tourism and airport-travel indicators, and company service positioning.
- Primary Research: Interviews with mobility-platform managers, taxi and private-hire operators, fleet partners, corporate travel managers, city transport specialists, payment partners and driver-supply managers examine service demand, driver availability, pricing, corporate travel requirements and operating constraints.
- Desk Research: The review covers public transport records, internet-access data, platform-work statistics, regulatory publications, clean-fleet rules, tourism indicators and current company information relevant to ride-hailing services.
- Market Sizing and Forecasting: Estimates consider ride frequency, fare value, product mix, app-booking penetration, private-hire licensing, driver availability, airport and leisure demand, business-travel usage, two- and three-wheeler adoption, local regulation and EV-transition economics.
- Data Validation and Update Cycle: Findings are cross-checked against public transport records, platform-work statistics, regulatory announcements, company activity and country-access conditions. Updates assess changes in product and end-user demand, driver supply, regulation and platform activity.
Segmentation
What is the report's scope and coverage?
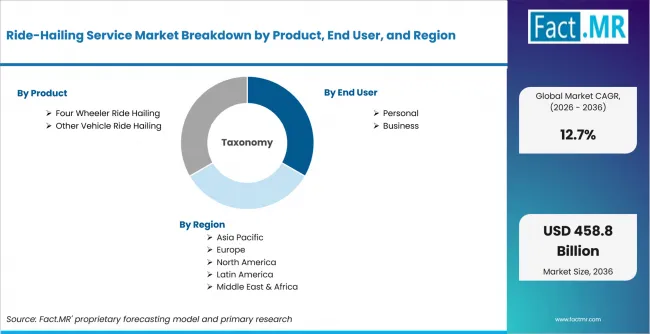
Ride Hailing Service Market Breakdown By Product, End User, And Region | Source: Fact.MR
| Attribute | Details |
|---|---|
| Quantitative Units | USD billion |
| Market Definition | App-enabled paid passenger ride-hailing services booked through digital platforms across specified product and end-user categories |
| Segments Covered | Product; End User |
| Regions Covered | North America; Latin America; Europe; East Asia |
| Countries Covered | Germany; Brazil; USA; U.K.; Japan |
| Key Companies Profiled | Uber; Arro; Capital EV; Curb; Didi Chuxing Technology Co.; EEETaxi; Gett; GoGreen Cabs; Gojek; Hitch; inDrive; Lyft, Inc.; Rapido bike taxi |
| Historical Period | 2021 to 2025 |
| Forecast Period | 2026 to 2036 |
| Base Year | 2025 |
| Market Value, 2026 | USD 138.8 billion |
| Market Value, 2036 | USD 458.8 billion |
| CAGR, 2026-2036 | 12.7% |
| Absolute Opportunity | USD 320.0 billion |
| Approach | Hybrid top-down and bottom-up approach using ride frequency, fare value, app-booking penetration, private-hire supply, product mix, end-user demand and country regulation |
Source: Fact.MR analysis. Updated Sep 4, 2026
How is the market segmented?
-
By Product
- Four Wheeler Ride Hailing
- Economy Ride Hailing
- Premium Ride Hailing
- Shared Mobility Services
- Other Vehicle Ride Hailing
- Two Wheeler Ride Hailing
- Three Wheeler Ride Hailing
- Four Wheeler Ride Hailing
-
By End User
- Personal
- Daily Commuters
- Leisure Travelers
- Airport Travelers
- Business
- Corporate Transportation
- Client Transportation
- Business Travel Management
- Personal
-
By Region
- North America
- Latin America
- Western Europe
- Eastern Europe
- East Asia
- South Asia and Pacific
- Middle East & Africa
Frequently Asked Questions
What is the Ride-Hailing Service Market worth in 2026?
At what CAGR is the Ride-Hailing Service Market projected to grow?
What will the Ride-Hailing Service Market be worth by 2036?
Which Product segment leads the Ride-Hailing Service Market?
Which End User leads the Ride-Hailing Service Market?
What is a major demand driver for the Ride-Hailing Service Market?
What is a restraint for the Ride-Hailing Service Market?
Which country records the highest listed CAGR?
Which companies are included in the market assessment?
Who worked on this report


Preview the report firsthand - request a free sample
Free SampleGet the brochure for pricing and purchase details
Download PDF