- Market Value (2025): USD 3.5 Bn
- Estimated Value (2026): USD 3.8 Bn
- Forecast Value (2036): USD 9.6 Bn
- CAGR (2026-2036): 9.7%
What is the Self-healing Grids Market forecast to be worth by 2036?
USD 3.8 billion in 2026 to USD 9.6 billion by 2036, at a 9.7% CAGR.
Automation investment should be read beside Fact.MR's Electric Power Distribution Automation Systems Market, since self-healing grids depend on automated switching and feeder visibility.
- The self-healing grids market reached USD 3.5 billion in 2025 as public utilities and grid-modernization program teams spent against a clear use case: distribution-grid automation that detects faults, isolates affected sections and restores service faster.
- Demand is projected to increase from USD 3.8 billion in 2026 to USD 9.6 billion by 2036, at a 9.7% CAGR.
- The market is forecast to record a 9.7% CAGR from 2026 to 2036. Demand depends on distribution-grid automation that detects faults, isolates affected sections and restores service faster.
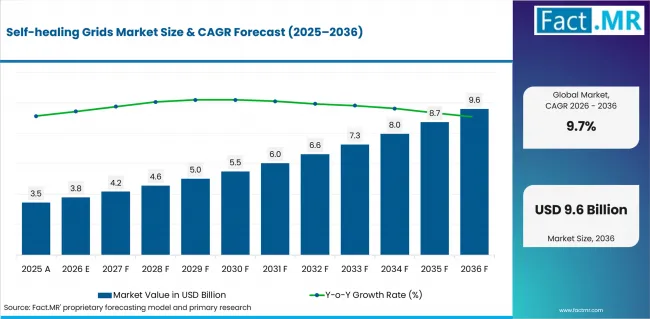
Self Healing Grids Market Value Analysis | Source: Fact.MR
What are the defining numbers behind Self-healing Grids Market growth?
USD 5.8 billion absolute opportunity is expected by 2036.
Fault isolation connects with Fact.MR's Sectionalizers Market, where utilities use sectionalized networks to reduce outage areas.
- Demand Drivers in the Market
- Hardware leads because reclosers, sectionalizers, sensors, switches and communication devices form the field layer that lets a grid detect and isolate faults.
- Distribution lines lead as most customer interruptions are felt at the distribution level. Utilities therefore place automation.
- Public utilities lead as they own distribution assets, face reliability targets and control grid-modernization budgets.
- Grid modernization projects lead deployment because self-healing functions are usually approved as part of wider reliability, resiliency, smart-grid or DER integration programs.
- Key Segments Analyzed
- By Component: Hardware is projected to hold 45.6% share in 2026. Hardware leads because self-healing behavior depends on sensors, switches, reclosers, communication equipment and protection devices installed in the field.
- By Application: Distribution Lines is projected to hold 54.8% share in 2026. Distribution lines lead because most customer interruptions occur on distribution feeders, where automated switching can reduce outage duration.
- By End User: Public Utilities is projected to hold 55.5% share in 2026. Public utilities lead as they own the grid assets, justify reliability investment and operate the control-room workflows.
- By Deployment: Grid Modernization Projects is projected to hold 45.1% share in 2026. Grid modernization projects lead as automation is normally funded through planned reliability and resilience programs rather than isolated device replacement.
- By Technology: Advanced Distribution Management System (ADMS) is projected to hold 42.1% share in 2026. Advanced Distribution Management System leads because ADMS coordinates outage information, switching logic and distribution-control actions.
- Analyst Opinion at Fact.MR
- Shambhu Nath Jha, Sr. Consultant at Fact.MR, opines, "Self-healing grids are a reliability market. The best programs connect field hardware, ADMS decisions and utility operating rules so faults are isolated faster and fewer customers lose service."
- Strategic Implications
- Vendors should demonstrate reduced outage duration, fewer truck rolls and clean ADMS integration rather than smart-grid labels.
- Utilities should sequence field-device upgrades, communications and control-room procedures together.
- Project teams should include cybersecurity, interoperability and outage analytics early in modernization design.
USA continues to be a leading market and is projected to grow at a CAGR of 12.61%; other key markets include Japan, Germany, UK, Canada, Australia and South Korea.
How does the Self-healing Grids Market break down by segment?
Hardware leads Component at 45.6%.
Protection logic links to Fact.MR's Recloser Controls Market, because restoration speed depends on coordinated field devices.
Why does Hardware lead Component?
Hardware is projected to account for 45.6% share in 2026.
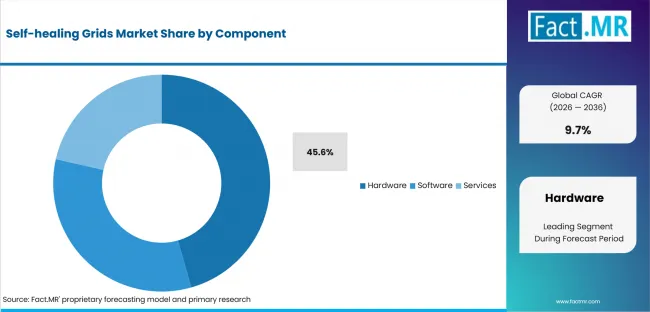
Self Healing Grids Market Analysis By Component | Source: Fact.MR
Hardware leads because self-healing behavior depends on sensors, switches, reclosers, communication equipment and protection devices installed in the field.
Why does Distribution Lines lead Application?
Distribution Lines is projected to account for 54.8% share in 2026.
Distribution lines lead because most customer interruptions occur on distribution feeders, where automated switching can reduce outage duration and truck rolls.
Why does Public Utilities lead End User?
Public Utilities is projected to account for 55.5% share in 2026.
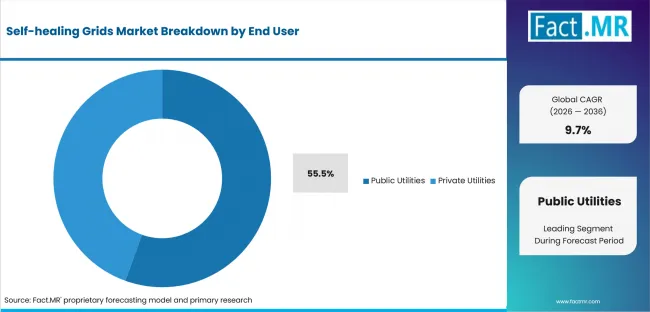
Self Healing Grids Market Analysis By End User | Source: Fact.MR
Public utilities lead as they own the grid assets, justify reliability investment and operate the control-room workflows.
Why does Grid Modernization Projects lead Deployment?
Grid Modernization Projects is projected to account for 45.1% share in 2026.
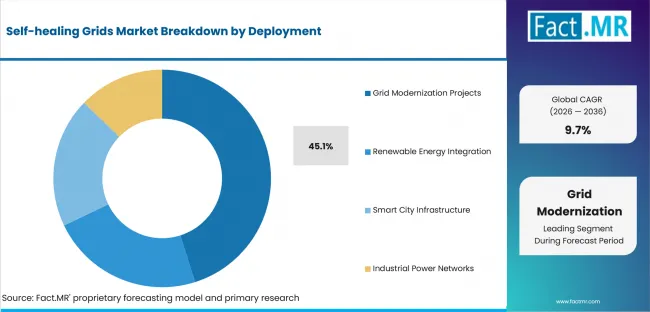
Self Healing Grids Market Analysis By Deployment | Source: Fact.MR
Grid modernization projects lead as automation is normally funded through planned reliability and resilience programs rather than isolated device replacement.
Why does Advanced Distribution Management System (ADMS) lead Technology?
Advanced Distribution Management System (ADMS) is projected to account for 42.1% share in 2026.
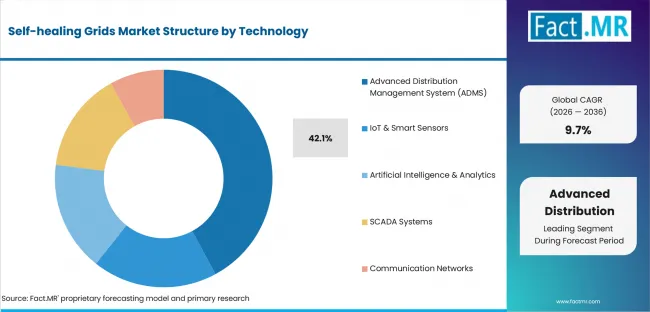
Self Healing Grids Market Analysis By Technology | Source: Fact.MR
Advanced Distribution Management System leads because ADMS coordinates outage information, switching logic and distribution-control actions.
What is accelerating Self-healing Grids Market adoption, and what is holding it back?
Adoption is strongest where utilities can connect feeder data, field devices, communications and ADMS workflows. Integration across legacy assets, cybersecurity review and utility approval cycles slows deployment.
Grid visibility should be compared with Fact.MR's Smart Grid Sensor Market, since sensors supply the event data needed for automated response.
Drivers Impact Analysis
| DRIVER | QUALITATIVE RELEVANCE | GEOGRAPHIC RELEVANCE | IMPACT TIMELINE |
|---|---|---|---|
| Field automation hardware | High | South Korea | Short term (<=2 years) |
| Distribution-line outage reduction | High | USA | Short term (<=2 years) |
| Public utility modernization budgets | Moderate | Canada | Medium term (2-4 years) |
| ADMS-enabled restoration logic | Selective | Germany | Medium term (2-4 years) |
Source: Fact.MR analysis. Updated Jul 30, 2026
- Field automation hardware: Hardware leads because reclosers, sectionalizers, sensors, switches and communication devices form the field layer that lets a grid detect and isolate faults.
- Distribution-line outage reduction: Distribution lines lead as most customer interruptions are felt at the distribution level. Utilities therefore place automation.
- Public utility modernization budgets: Public utilities lead as they own distribution assets, face reliability targets and control grid-modernization budgets.
- ADMS-enabled restoration logic: Grid modernization projects lead deployment because self-healing functions are usually approved as part of wider reliability, resiliency, smart-grid or DER integration programs.
Opportunity Impact Analysis
| OPPORTUNITY | QUALITATIVE RELEVANCE | GEOGRAPHIC RELEVANCE | IMPACT TIMELINE |
|---|---|---|---|
| DER-aware restoration | High | South Korea | Medium term (2-4 years) |
| Storm resilience and feeder automation | Moderate | USA | Medium term (2-4 years) |
| Outage analytics for regulatory cases | Selective | Canada | Medium term (2-4 years) |
Source: Fact.MR analysis. Updated Jul 30, 2026
- DER-aware restoration: DER-aware restoration can expand demand as rooftop solar, storage and microgrids complicate distribution operations.
- Storm resilience and feeder automation: Storm-resilience programs can create funding for automated switching and feeder segmentation.
- Outage analytics for regulatory cases: Analytics tied to outage minutes, truck rolls and asset health can help utilities defend modernization spend to regulators.
Restraints Impact Analysis
| RESTRAINT | QUALITATIVE RELEVANCE | GEOGRAPHIC RELEVANCE | IMPACT TIMELINE |
|---|---|---|---|
| Aging field assets and poor feeder data | High | South Korea | Short term (<=2 years) |
| Slow utility procurement and approvals | Moderate | USA | Medium term (2-4 years) |
| Device, communication and ADMS interoperability | Selective | Germany | Medium term (2-4 years) |
Source: Fact.MR analysis. Updated Jul 30, 2026
- Aging field assets and poor feeder data: Aging distribution assets make automation harder when feeders, maps and protection settings are incomplete.
- Slow utility procurement and approvals: Utility procurement cycles are slow because reliability projects require regulatory approval, field testing and cybersecurity review.
- Device, communication and ADMS interoperability: Interoperability between field devices, communications and ADMS platforms can limit performance.
Which countries are scaling Self-healing Grids Market fastest?
Country rates show where buying conditions and supplier proof are already stronger.
Reliability programs connect with Fact.MR's Power Monitoring Market, where utilities track power quality and asset stress before faults spread.
- South Korea: The market is expected to grow at a CAGR of 6.81% from 2026 to 2036. South Korea's growth is supported by advanced grid infrastructure, high reliability expectations and dense urban distribution networks.
- USA: The market is expected to grow at a CAGR of 12.61% from 2026 to 2036. USA demand is shaped by storm resilience, wildfire risk, aging distribution assets and federal and state grid-modernization programs.
- Canada: The market is expected to grow at a CAGR of 8.74% from 2026 to 2036. Canada's outlook is tied to reliability across long feeder networks, harsh weather and utility investment in automated switching.
- Germany: The market is expected to grow at a CAGR of 10.68% from 2026 to 2036. Germany's adoption is guided by renewable integration, distribution-grid congestion and strict reliability expectations.
- Australia: The market is expected to grow at a CAGR of 7.76% from 2026 to 2036. Australia benefits from resilience spending, DER integration and remote grid-operating needs, especially where outages have high economic cost.
- UK: The market is expected to grow at a CAGR of 9.69% from 2026 to 2036. UK growth is linked to distribution-network modernization, electrification and regulator scrutiny of outage performance.
- Japan: The market is expected to grow at a CAGR of 11.64% from 2026 to 2036. Japan's market is shaped by high reliability norms, disaster resilience and utility preference for proven automation platforms.
The full report provides country-level CAGR analysis across North America, Latin America, Europe, East Asia, South Asia and Oceania, and the Middle East and Africa.
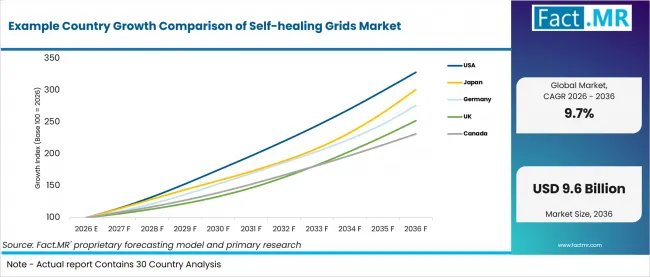
Example Country Growth Comparison Of Self Healing Grids Market | Source: Fact.MR
| Country | CAGR (2026-2036) |
|---|---|
| South Korea | 6.81% |
| USA | 12.61% |
| Canada | 8.74% |
| Germany | 10.68% |
| Australia | 7.76% |
| UK | 9.69% |
| Japan | 11.64% |
Source: Fact.MR analysis. Updated Jul 30, 2026
What is shaping South Korea's outlook through 2036?
6.81% CAGR from 2026 to 2036.
South Korea's growth is supported by advanced grid infrastructure, high reliability expectations and dense urban distribution networks.
What is shaping USA's outlook through 2036?
12.61% CAGR from 2026 to 2036.
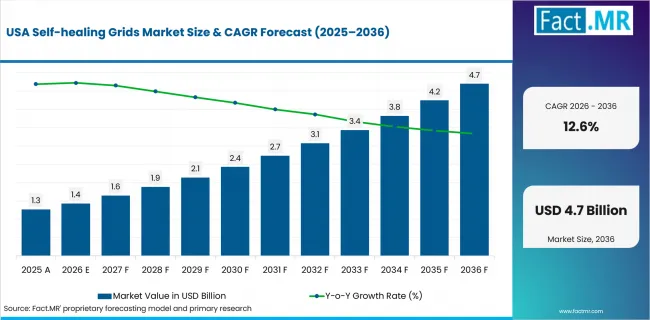
Self Healing Grids Market Country Value Analysis | Source: Fact.MR
USA demand is shaped by storm resilience, wildfire risk, aging distribution assets and federal and state grid-modernization programs.
What is shaping Canada's outlook through 2036?
8.74% CAGR from 2026 to 2036.
Canada's outlook is tied to reliability across long feeder networks, harsh weather and utility investment in automated switching.
What is shaping Germany's outlook through 2036?
10.68% CAGR from 2026 to 2036.
Germany's adoption is guided by renewable integration, distribution-grid congestion and strict reliability expectations.
What is shaping Australia's outlook through 2036?
7.76% CAGR from 2026 to 2036.
Australia benefits from resilience spending, DER integration and remote grid-operating needs, especially where outages have high economic cost.
Who leads the Self-healing Grids Market?
Schneider Electric; Siemens AG; Hitachi Energy; ABB Ltd. are among the visible providers in the self-healing grids market.
Schneider Electric and Siemens AG are among the most visible providers. Competition is shaped by product proof, channel access and buyer trust.
Between 2026 and 2036, market rivalry is likely to center on clearer positioning around Hardware, stronger documentation and better support at the point of purchase.
Which companies are the key providers?
Key companies include Schneider Electric; Siemens AG; Hitachi Energy; ABB Ltd.; GE Vernova; Eaton Corporation; Cisco Systems; Oracle Corporation.
- Schneider Electric
- Siemens AG
- Hitachi Energy
- ABB Ltd.
- GE Vernova
- Eaton Corporation
- Cisco Systems
- Oracle Corporation
Bibliography
- U.S. Department of Energy, Grid Modernization Initiative.
- U.S. Department of Energy, Grid Modernization and the Smart Grid.
- IEA, Electricity Grids and Secure Energy Transitions.
- OSTI, ADMS and DER Coordinated Capability Demonstrations.
- Puget Sound Energy, Distribution Automation.
- Fact.MR, Electric Power Distribution Automation Systems Market.
This Report Answers
- The report provides strategic intelligence on the Self-healing Grids Market across segment choices that shape the 2026 market structure.
- Segment analysis covers Hardware and Distribution Lines as the share leaders within the 2026 market.
- Country outlook evaluates the listed markets by CAGR and explains the adoption conditions in each country.
- Competitive analysis profiles the named providers and evaluates competition around product proof, channel access and buyer trust.
- Related coverage connects this report with adjacent grid automation and power-management markets.
What does the Self-healing Grids Market cover?
The Self-healing Grids Market covers self-healing grid hardware, software, sensors, reclosers, sectionalizers, switches, communications, ADMS and automation systems used to detect, isolate and restore distribution-grid faults.
The Self-healing Grids Market covers self-healing grid hardware, software, sensors, reclosers, sectionalizers, switches, communications, ADMS and automation systems used to detect, isolate and restore distribution-grid faults.
Adjacent spending is included only when it is part of the same purchase decision or operating use case.
What is included in the scope?
The scope includes Component, Application, End User, Deployment, Technology and regional demand.
Coverage includes adjacent segment options only when they are purchased for the same defined market use.
What is excluded from the scope?
general power generation equipment, transmission projects without self-healing distribution functions, manual outage-response services and consumer energy devices.
The scope excludes general power generation equipment, transmission projects without self-healing distribution functions, manual outage-response services and consumer energy devices.
How Was the Analysis Built?
The analysis combines primary research with desk research focused on the self-healing grids market, its segment structure and country-level demand.
- Primary Research: Interviews and validation discussions test buyer priorities, adoption barriers, pricing logic and operating requirements.
- Desk Research: The assessment reviews company disclosures, public datasets, regulatory material, technical literature and industry records relevant to the market.
- Market Sizing and Forecasting: Estimates combine top-down and bottom-up checks across demand signals, segment shares, country activity, company participation and adoption constraints.
- Data Validation and Update Cycle: Findings are validated against public evidence, company activity and country-level adoption patterns before final use.
Segmentation
What is the report's scope and coverage?
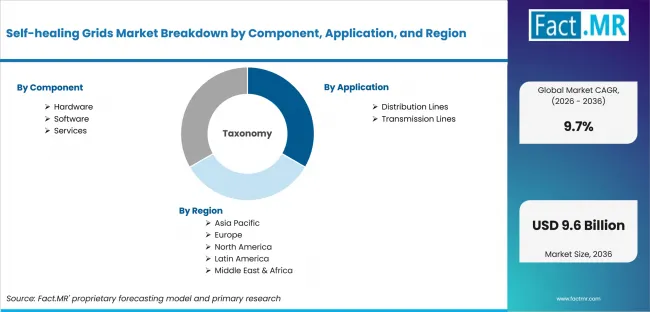
Self Healing Grids Market Breakdown By Component, Application, And Region | Source: Fact.MR
| Attribute | Details |
|---|---|
| Quantitative Units | USD 3.8 billion in 2026 to USD 9.6 billion by 2036, at a 9.7% CAGR. |
| Market Definition | Self-healing Grids Market covers self-healing grid hardware, software, sensors, reclosers, sectionalizers, switches, communications, ADMS and automation systems used to detect, isolate and restore distribution-grid faults. |
| Component | Hardware; Intelligent Electronic Devices (IEDs); Smart Sensors & Switches; Software; Distribution Management Systems; Grid Analytics Platforms; Services; Consulting Services; Integration & Maintenance Services |
| Application | Distribution Lines; Fault Detection; Service Restoration; Transmission Lines; Grid Monitoring; Transmission Automation |
| End User | Public Utilities; State-Owned Utilities; Municipal Utilities; Private Utilities; Independent Power Utilities; Private Grid Operators |
| Deployment | Grid Modernization Projects; Substation Automation; Distribution Automation; Renewable Energy Integration; Solar Grid Integration; Wind Grid Integration; Smart City Infrastructure; Urban Smart Grid Projects; Microgrid Networks; Industrial Power Networks; Manufacturing Facilities; Critical Infrastructure |
| Technology | Advanced Distribution Management System (ADMS); Fault Location Isolation & Service Restoration (FLISR); Outage Management Integration; IoT & Smart Sensors; Line Sensors; Smart Meters; Artificial Intelligence & Analytics; Predictive Maintenance; Load Forecasting; SCADA Systems; Remote Monitoring; Control Systems; Communication Networks; Fiber Optic Networks; Wireless Mesh Networks |
| Regions Covered | North America; Latin America; Europe; East Asia; South Asia and Oceania; Middle East and Africa |
| Countries Covered | South Korea; USA; Canada; Germany; Australia; UK; Japan |
| Key Companies Profiled | Schneider Electric; Siemens AG; Hitachi Energy; ABB Ltd.; GE Vernova; Eaton Corporation; Cisco Systems; Oracle Corporation |
| Forecast Period | 2026 to 2036 |
| Approach | Hybrid top-down and bottom-up assessment using demand indicators, segment mix, country growth, company participation and public evidence relevant to the category. |
Source: Fact.MR analysis. Updated Jul 30, 2026
How is the market segmented?
-
By Component:
- Hardware
- Intelligent Electronic Devices (IEDs)
- Smart Sensors & Switches
- Software
- Distribution Management Systems
- Grid Analytics Platforms
- Services
- Consulting Services
- Integration & Maintenance Services
-
By Application:
- Distribution Lines
- Fault Detection
- Service Restoration
- Transmission Lines
- Grid Monitoring
- Transmission Automation
-
By End User:
- Public Utilities
- State-Owned Utilities
- Municipal Utilities
- Private Utilities
- Independent Power Utilities
- Private Grid Operators
-
By Deployment:
- Grid Modernization Projects
- Substation Automation
- Distribution Automation
- Renewable Energy Integration
- Solar Grid Integration
- Wind Grid Integration
- Smart City Infrastructure
- Urban Smart Grid Projects
- Microgrid Networks
- Industrial Power Networks
- Manufacturing Facilities
- Critical Infrastructure
-
By Technology:
- Advanced Distribution Management System (ADMS)
- Fault Location Isolation & Service Restoration (FLISR)
- Outage Management Integration
- IoT & Smart Sensors
- Line Sensors
- Smart Meters
- Artificial Intelligence & Analytics
- Predictive Maintenance
- Load Forecasting
- SCADA Systems
- Remote Monitoring
- Control Systems
- Communication Networks
- Fiber Optic Networks
- Wireless Mesh Networks
-
By Region:
- North America
- Latin America
- Europe
- East Asia
- South Asia and Oceania
- Middle East and Africa
Frequently Asked Questions
Which Component leads the market?
Which Application leads the market?
Which End User leads the market?
Which Deployment leads the market?
Which Technology leads the market?
Which country records the highest listed CAGR?
What is the primary driver in this market?
What is the main restraint?
Who worked on this report


Preview the report firsthand - request a free sample
Free SampleGet the brochure for pricing and purchase details
Download PDF