


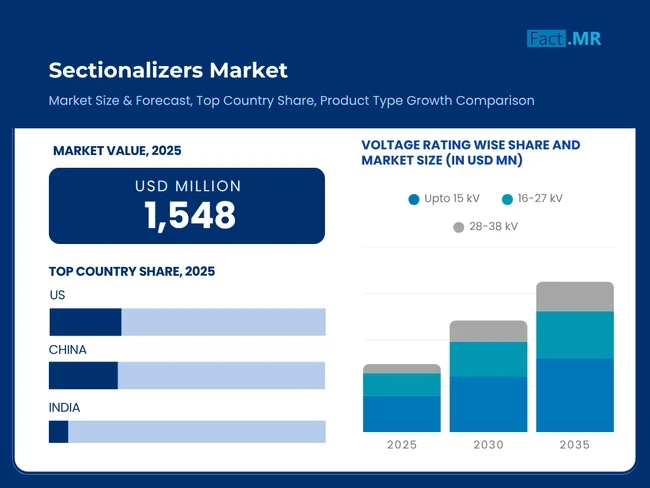
- Base Value(2025): 1548 Mn
- Forecast Value (2035): 2746 Mn
- CAGR (2035): 5.9%
Sectionalizers Market Outlook (2025 to 2035)
The global sectionalizers market is expected to reach USD 2,746 million by 2035, up from USD 1,464 million in 2024. During the forecast period (2025 to 2035), the industry is projected to expand at a CAGR of 5.9%. Investment in smart grid infrastructure is driving market growth, as stable power delivery and fault isolation are essential in minimizing service disruptions.
The emerging use of renewable resources, including wind and solar energy, is also compelling utilities to install intelligent switching devices capable of carrying two-way current and handling variable loads. In addition, the increased use of grid automation and real-time grid performance improvement and monitoring is prompting utilities and municipalities to integrate sectionalizers to enhance outage control and boost grid resilience.
What are the drivers of the Sectionalizers Market?
The switch over to smart grid infrastructure is a booster of the sectionalizers market. Every utility is also implementing improvements in fault detection and service reliability through the establishment of intelligent systems. As countries modernize their power distribution systems, particularly in urban centers, the integration of sectionalizers is becoming a critical aspect of system modernization.
There is a growing demand for dynamic load management in power networks due to the rapid expansion of renewable energy sources. The unpredictable nature of solar and wind energy is accommodated by sectionalizers, which efficiently handle the flow of power in two directions.
As the use of distributed energy resources increases, these devices are also utilized to balance the grid and prevent overloads. They are particularly useful in remote and rural regions, where renewable setups are pervasive. This demand for flexibility and responsiveness in power infrastructure is leading directly to increased implementation of sectionalizers.
Another factor is the automation experienced in the power distribution systems. Using such devices, the utility sector can identify faults and act promptly through a remote process, thereby limiting manual efforts and reducing the time to restore. They strengthen the integration of smart control systems that optimize grid performance and enable data-driven decision-making.
Sectionalizers in modernized grids play a crucial role in real-time switching and system reconfiguration, ensuring uninterrupted and reliable service. With utilities paying more attention to predictive maintenance and operations, sectionalizers have become an integral part of automated networks.
What are the regional trends of the Sectionalizers Market?
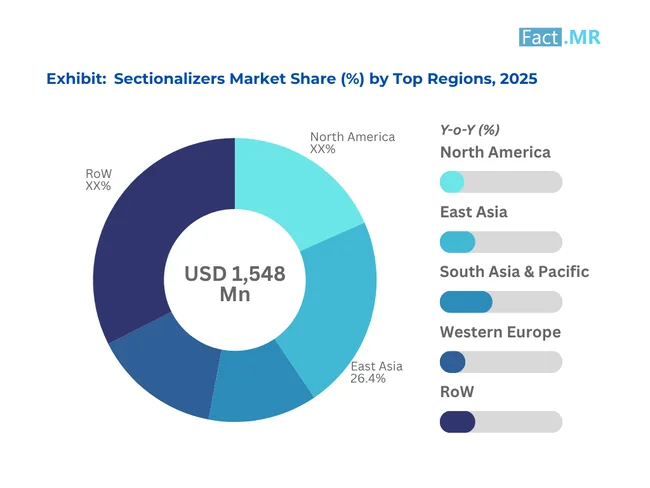
North America accounts for a respectable share of the worldwide sectionalizers market due to the maturing grid and the desire to modernize it intelligently. Other federal programs, such as the Grid Resilience and Innovation Partnership initiated by the U.S. Department of Energy, are pushing to implement intelligent switching devices in an effort to make the grid more reliable.
The largest and fastest-growing region in the sectionalizers market is the Asia-Pacific region. Nations such as China and India are investing a significant amount of money in grid modernization for rural electricity and smart cities. The growing demand for sectionalizers, as well as their advanced distribution automation, is being stimulated by government-promoted initiatives of planned projects on green hydrogen valleys and enhanced clean energy budgets in India.
The sectionalizer market, which serves Europe, is driven by strict policies that promote the use of renewable energy and the reliability of the grid. Technologies such as the smart grid will be made available to countries like Germany, France, and the UK in an effort to achieve sustainability objectives.
The sectionalizer market in Latin America is growing, driven by the push for modernization in existing electrical networks and increased grid reliability.
What are the challenges and restraining factors of the Sectionalizers Market?
The problem in the sectionalizers market is with incorporating these devices into the aging power infrastructure, especially in underdeveloped geographies. The outdated distribution systems use distribution systems that lack the digital interfaces required for advanced fault isolation and automation, posing compatibility problems to many utilities in a retrofit of the sectionalizers. That restricts the performance value of sectionalizers and regularly needs costly retrofitting of systems, hindering usage and jeopardizing the efficiency of operations on legacy networks.
A major challenge impacting the sectionalizers market is that a huge initial investment is needed to implement the devices in the rural and underdeveloped areas. Although such devices provide cost savings in the long run by being reliable and automating, they may not be affordable to mount due to installation cost, smart grid connection, and training costs that may prevent utilities with low budgets. This economic hurdle is particularly evident in areas where investment and governmental backing for grid upgradation are not stable.
Country-Wise Insights
Grid modernization drive in China catalyzing automation-led growth in sectionalizers market
The market size of sectionalizers in China is growing at a fast rate due to both country-wide smart grid projects and the adopting of renewable energy sources. With grid reliability falling under the utmost priority, utilities are embracing sophisticated sectionalizers with IoT-enabled fault indication, remote-controlled roller relays, and artificial intelligence-based surveillance.
Local manufacturers are working on free versions with real-time communication systems and edge computing controllers in order to comply with the national infrastructure requirements. Connection with SCADA systems and cloud-based diagnostics enables operators to monitor their activity, identify flaws on an early stage, and arrange predictive maintenance.
China is increasing grid automation and decreasing the duration of outages through modular and intelligent switching solutions, and making power delivery safer and more efficient. In an effort to speed up digitalization, the sectionalizers have been at the forefront of updating the power distribution scene of China in terms of power distribution across the voltage levels.
Elite utility standards in the U.S. are driving AI-integrated sectionalizer innovation
The U.S. sectionalizers market is undergoing a stage of high-performance demands from investor-owned utilities, where fault isolation precision and efficiency are essential. Manufacturers are working on implementing AI-enhanced sectionalizers that can change their trip settings based on real time grid condition,s thereby ensuring better coordination with adaptive protection systems. Urban utilities are using solid-state sectionalizers on underground space-constrained networks which provide quiet operation, Lynx quicke switching, and maintenance free.
Alongside these, utility staffs are being trained using department of energy funded programs on utility digital tools that allow them use of smart sectionalizer networks through mobile interfaces. Among the advances, collaborating with AMI (Advanced Metering Infrastructure) systems allows load balancing, forecasting outages, and customer-level diagnostics of the power quality are admitted to change the sectionalizers in the U.S. system of modernization of the grid to an active, proactive part.
Urban load growth and renewable integration reshaping sectionalizer deployment in India
-2025-2035.webp)
The Indian sectionalizers market is growing in response to the urbanization process and the increasing commercial requirements, which are prompting utilities to focus more on grid reliability in dense urban areas. As rooftop solar and EV infrastructure continues to increase, bidirectional protection sectionalizers with voltage sensing are being added as the means to control variable loads.
There have been disruptions in the peak hours in industrial corridors that time-synchronized devices are reducing. Smart cities' mission projects are expediting feeder automation, and this increases the need for compatible units.
Even manufacturers are coming up with designs that are able to survive weather effects in flood prone areas and high temperatures regions. AI-powered sectionalizers are under pilot programs whereby they can predict the faults and optimum switching sequence. All of this is making the move of India to a responsive and digital-first grid a possibility.
Category-Wise Analysis
Rural utility demand driving single phase sectionalizer adoption
In power distribution systems, single-phase sectionalizers are commonly used in rural and semi-urban areas. Such equipment is crucial in isolating faults within the shortest time possible, with the aim of reducing interruptions to supply. This is particularly critical in remote places where the grid's resilience is limited. They provide an economical solution to the feeder protection problem, allowing utilities to carry loads with minimal infrastructure.
They are small, install easily, and are suitable for areas with reduced demands (agricultural and residential). Due to increasing government involvement in rural electrification, the use of single-phase sectionalizers is expected to rise as well, with utilities focusing on selecting models that offer self-resetting and Supervisory Control and Data Acquisition (SCADA) capabilities to meet automation objectives.
Urban grid modernization is boosting demand for 15 kV sectionalizers
Medium-voltage distribution systems Sectionalizers rated up to 15 kV are normally applied to the medium-voltage distribution systems (urban and suburban grids). The devices feature effective fault isolation of primary feeders and secondary circuits, providing continuous service in commercial and light industrial areas.
As the extent of underground cabling, as well as switching on poles, extends, their demand is growing. This voltage range of devices will be used on moderate fault currents with insulation reliability and safety operation requirements.
Modern grid hardening practices, such as the installation of 15 kV sectionalizers, are becoming a reality due to the scale of load increases in cities and the integration of renewables.
Resettable technology enabling fault-tolerant power systems
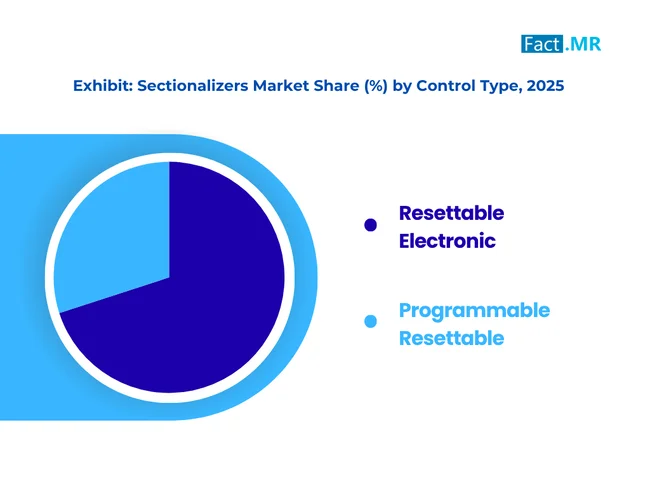
Electronic sectionalizers with resetting capability are reorganizing operational efficiency, which supports bringing reclosing and remote diagnosis, and thus cuts off the requirement for manual patrols. These sophisticated units are equipped with microprocessor-based logic, which counts faults, monitors grid behavior, and performs accurate fault isolation. They can be used effectively as they become integrated with SCADA and AMI to enable real-time control, which is crucial for smart grid performance.
The Reset capability, without physical servicing, reduces both downtime and maintenance expenses substantially. These sectionalizers are ideal for heavily populated and high-risk areas where rapid fault clearing is crucial. As more applications in power utilities transition to digitalization, future use is likely to be dominated by resettable electronic models due to their precise performance, programmability, and low total cost of ownership.
Competitive Analysis
The market of sectionalizers is not highly concentrated, with the leading players all competing based on expertise in technological innovation and proficiency in grid automation. Such manufacturers around the globe are incorporating microprocessor-based controls, SCADA compatibility, and resettable logic into their products to address the growing need for reliability and promptness in fault management. National firms, particularly in the Asia-Pacific and Latin America regions, are emerging with a business model that has reduced costs through climate-resistant products with designs based on the local voltage requirements and also local infrastructure specifications.
There is increased competition, as utilities strive to implement digital-first solutions that align with smart grids and resilience goals. While multinational companies utilize technological sophistication through advanced diagnostics, remote operability, and the use of AI solutions in fault detection to gain an upper hand as premium solution providers, locally based manufacturers enjoy government-supported procurement, shorter delivery processes, and compliance with regulations. The move to resettable electronic sectionalizers is also affecting product development priorities.
The strategic alliance between utilities and investments in edge computing, as well as remote monitoring, is defining the market development. In such a shifting environment, success becomes increasingly measured by a player's ability to maintain balance among innovation, pricing, and response in multiple grid environments.
Key players in the sectionalizers industry are Eaton, Bevins Co., Hubbell, S&C Electric Company, MAC Products Inc., Siemens, and others.
Recent Development
- In March 2025, ABB announced that it will invest USD 120 million in the United States to expand the production capacity of its low-voltage electrification products.
- In February 2025, Eaton introduces the 9395 XR Uninterruptible Power Supply (UPS) system at Elecrama, an advanced power backup solution designed to maximize energy efficiency, enhance system reliability, and ensure seamless operation for mission-critical infrastructure.
Fact.MR has provided detailed information about the price points of key manufacturers in the sectionalizers market, positioned across regions, including sales growth, production capacity, and speculative technological expansion, in the recently published report.
Methodology and Industry Tracking Approach
The global sectionalizers market report was prepared by Fact.MR is the culmination of the views of 12,500 stakeholders in 35 countries and, at the very least, 350 respondents that define each regional market. One and two-thirds of the responses were received from end users and product developers, including engineers in the utility, grid planners, maintenance heads, and equipment designers. The rest of the inputs were obtained from industry stakeholders, such as procurement managers, regulatory agencies, and compliance experts.
This study was conducted between June 2024 and May 2025 and utilized structured questionnaires to gain an understanding of real-time issues in grid operation, equipment features, infrastructure investment plans, and market inefficiencies. Analyses of responses were based on the size of individual local markets and their strategic importance. More than 300 trusted resources, such as utility infrastructure journals, patent repositories, electrical safety guidelines, and corporate disclosures, were surveyed.
The study also employed statistical simulations and regression modeling to provide practical findings that sectionalizer producers, utility operators, and policymakers can use to inform decisions that may lead to product improvements, reliability enhancements, and safety improvements in medium-voltage distribution systems.
With Fact.MR monitoring consumer behavior, product efficacy, industry trends, and market opportunities since 2018, this report is becoming an authoritative source of information that stakeholders can rely on.
Segmentation of Sectionalizers Market
-
By Phase Type :
- Single Phase
- Three Phase
-
By Voltage Rating :
- Up to 15 kV
- 16-27 Kv
- 28-38kV
-
By Control Type :
- Resettable electronic
- Programmable resettable
-
By End-User Industry :
- Manufacturing
- Healthcare
- Construction
- Food and Beverages
- Others
-
By Region :
- North America
- Latin America
- Western Europe
- Eastern Europe
- East Asia
- South Asia & Pacific
- Middle East & Africa
- Frequently Asked Questions -
What was the global sectionalizers market size reported by fact.mr for 2025?
The global sectionalizers market was valued at USD 1,548 million in 2025.
Who are the major players operating in the sectionalizers market?
Prominent players in the market are ABB, Eaton, Hubbell, S&C Electric Company, MAC Products Inc., and others.
What is the estimated valuation of the sectionalizers market in 2035?
The market is expected to reach a valuation of USD 2,746 million in 2035.
What value CAGR did the sectionalizers market exhibit over the last five years?
The historic growth rate of the sectionalizers market was 5.4% from 2020 to 2024.