- Market Value (2025): USD 3.8 Bn
- Estimated Value (2026): USD 4.0 Bn
- Forecast Value (2036): USD 7.4 Bn
- CAGR (2026-2036): 6.4%
What is the Vitamin D Therapy Market forecast to be worth by 2036?
USD 4.0 billion in 2026 to USD 7.4 billion by 2036 at 6.4% CAGR.
- The vitamin D therapy market reached USD 3.8 billion in 2025 as hospitals and pharmacies supported monitored vitamin D use.
- Demand is projected to increase from USD 4.0 billion in 2026 to USD 7.4 billion by 2036 as oral products remain easy to repeat.
- The market is forecast to record 6.4% CAGR from 2026 to 2036 owing to osteoporosis care and prescription-led follow-up.
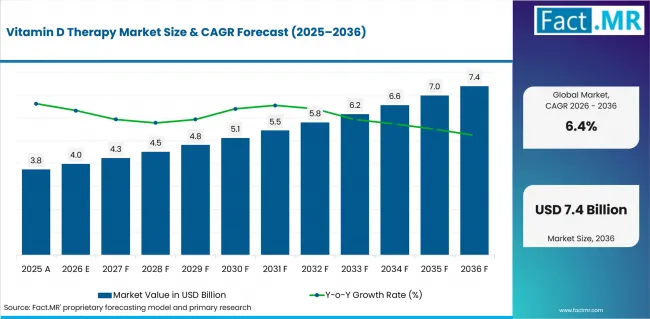
Vitamin D Therapy Market Value Analysis | Source: Fact.MR
What are the defining numbers behind Vitamin D Therapy Market growth?
USD 3.4 billion absolute opportunity by 2036.
- Demand Drivers in the Market
- Vitamin D3 Therapy is expected to remain the main product reference because cholecalciferol is familiar in clinical and consumer health settings.
- Oral delivery is projected to keep the largest route position since tablets and drops avoid visit-based administration burden.
- Osteoporosis applications are anticipated to carry steady demand where bone-health plans involve diagnosis and follow-up review.
- Key Segments Analyzed
- By Therapy Type: Vitamin D3 Therapy is projected to hold 38.6% share in 2026 because cholecalciferol products remain the clearest therapy reference.
- By Route of Administration: Oral is expected to account for 43.1% share in 2026 as repeat-use products fit daily care.
- By Application: Osteoporosis is anticipated to capture 35.4% share in 2026 since bone-health management creates repeat demand.
- By End User: Hospitals are estimated to represent 33.6% share in 2026 due to physician-led planning and pharmacy dispensing.
- By Distribution Channel: Prescription is forecast to hold 41.8% share in 2026 as higher-dose use requires clinical direction.
- Analyst Opinion at Fact.MR
- Shambhu Nath Jha, Sr. Consultant at Fact.MR, opines: “Vitamin D therapy companies are expected to win by proving product reliability and route fit. Stronger proposals connect Vitamin D3 Therapy and oral delivery with clear prescription support instead of broad wellness claims.”
- Strategic Implications
- Pharmaceutical companies gain clearer positioning when each vitamin supplement claim is tied to the actual use case.
- Channel partners need a clear boundary between therapy-led demand and the broader dietary supplements category.
- Investors can compare vitamin D therapy with bone and joint health supplement demand only when products are tied to therapeutic dosing and follow-up.
The USA is expected to record an 8.3% CAGR from 2026 to 2036 through prescription oversight and osteoporosis therapy review. Germany is projected to record 7.5% CAGR as careful product selection and pharmacy recommendation shape demand. The UK is anticipated to grow at 6.8% through pharmacy replenishment and steady bone-health product use. France is forecast at 6.0% CAGR through physician-guided therapy access. Japan is projected to record 5.3% CAGR as oral formats fit compact care routines. Canada is expected to record a 4.5% CAGR through cold-season routines and pharmacy access.
How does the Vitamin D Therapy Market break down by segment?
Vitamin D3 Therapy is expected to lead Therapy Type at 38.6% share in 2026. Oral delivery is projected to lead Route of Administration at 43.1% share in 2026.
Which Therapy Type dominates?
Vitamin D3 Therapy is projected to account for 38.6% share in 2026.
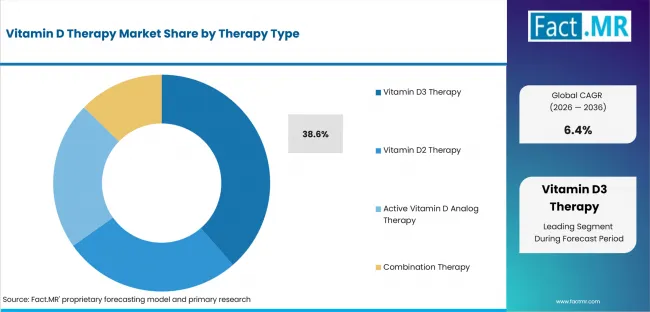
Vitamin D Therapy Market Analysis By Therapy Type | Source: Fact.MR
Cholecalciferol familiarity gives Vitamin D3 Therapy the strongest commercial base. Tablets and capsules serve standard dosing needs. Oral solutions support users who require easier dose handling. Vitamin D2 and active analog therapies remain more selective.
What leads the Route of Administration segment?
Oral is expected to hold 43.1% share in 2026.
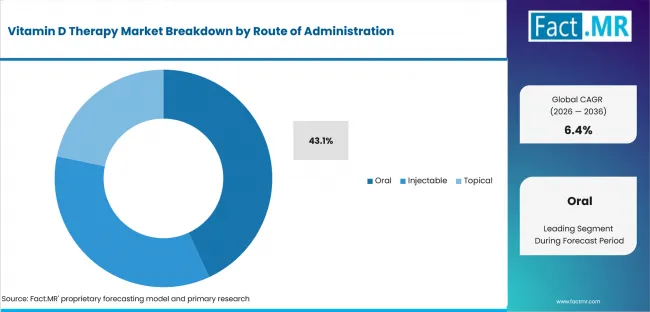
Vitamin D Therapy Market Analysis By Route Of Administration | Source: Fact.MR
Daily therapy routines favor oral products because they can move through normal pharmacy channels. Tablets help standard dosing. Capsules support convenience. Oral drops serve pediatric and geriatric users where swallowing burden affects adherence.
How does Application shape demand?
Osteoporosis is anticipated to lead with 35.4% share in 2026.
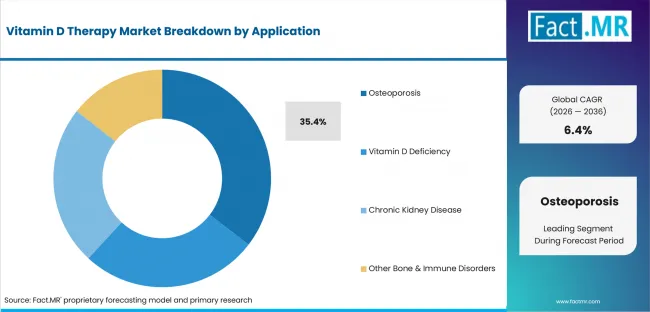
Vitamin D Therapy Market Analysis By Application | Source: Fact.MR
Bone-health review places Osteoporosis ahead of other applications. Vitamin D therapy is often used with calcium intake and bone-density review. Vitamin D deficiency and chronic kidney disease add demand where clinicians need a defined treatment reason.
What supports Hospitals within End User?
Hospitals are estimated to represent 33.6% share in 2026.
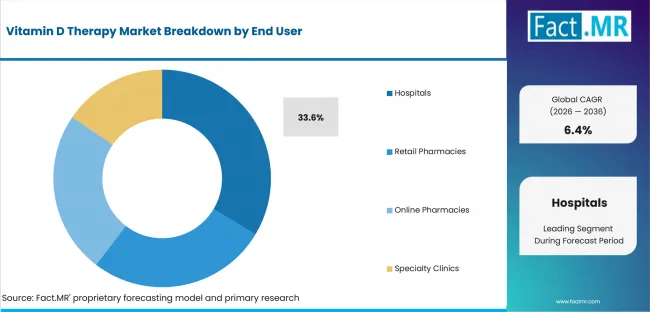
Vitamin D Therapy Market Analysis By End User | Source: Fact.MR
Higher-risk patients often enter therapy through physician review and prescription planning. Hospitals guide the first treatment decision. Pharmacies and specialty clinics then support repeat access after the dose is established.
Why does Prescription lead Distribution Channel?
Prescription is forecast to hold 41.8% share in 2026.
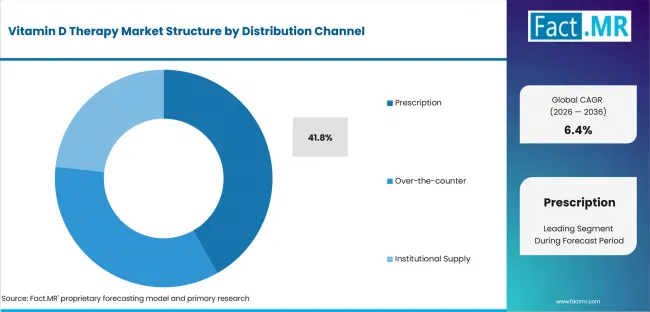
Vitamin D Therapy Market Analysis By Distribution Channel | Source: Fact.MR
High-dose therapy needs clearer medical direction than routine wellness use. Prescription channels help control dose and duration. OTC and institutional routes remain relevant where customers already understand the treatment plan.
What is accelerating Vitamin D Therapy Market adoption, and what is holding it back?
Demand will grow through familiar Vitamin D3 treatments and easy oral use. Growth may be limited by price pressure and poor follow-up without clinical supervision.
Drivers Impact Analysis
| DRIVER | (~) % IMPACT ON CAGR | GEOGRAPHIC RELEVANCE | IMPACT TIMELINE |
|---|---|---|---|
| Vitamin D3 therapy familiarity | +1.8% | Canada; USA; UK | Short term (<= 2 years) |
| Oral-route adherence fit | +1.5% | Japan; Germany; France | Short term (<= 2 years) |
| Osteoporosis repeat repeat care | +1.3% | Canada; USA; Europe | Medium term (2-4 years) |
| Prescription-led confidence | +1.0% | Hospitals and specialty clinics | Medium term (2-4 years) |
| Digital pharmacy refill access | +0.8% | Urban pharmacy channels | Long term (>= 4 years) |
Source: Fact.MR analysis. Updated Jul 30, 2026
- Vitamin D3 therapy familiarity: Cholecalciferol products are expected to help providers explain therapy choices with less education burden.
- Oral-route adherence fit: Tablets and drops are anticipated to support scheduled use since patients already know these formats.
- Osteoporosis repeat repeat care: Osteoporosis therapeutics plans are expected to create recurring use after diagnosis and review.
Opportunity Impact Analysis
| OPPORTUNITY | (~) % IMPACT ON CAGR | GEOGRAPHIC RELEVANCE | IMPACT TIMELINE |
|---|---|---|---|
| Condition-specific oral packs | +1.1% | Canada and USA | Medium term (2-4 years) |
| Hospital-to-pharmacy continuity | +0.9% | UK; Germany; France | Medium term (2-4 years) |
| Geriatric care channel expansion | +0.8% | Japan and Europe | Long term (>= 4 years) |
| Clinical refill programs | +0.6% | Digital pharmacy channels | Long term (>= 4 years) |
Source: Fact.MR analysis. Updated Jul 30, 2026
- Condition-specific oral packs: Osteoporosis testing pathways are expected to reduce confusion at dispensing.
- Hospital-to-pharmacy continuity: Providers that connect discharge advice with pharmacy refills are anticipated to improve repeat purchasing quality.
- Geriatric care channel expansion: Long-term care and geriatric clinics are projected to favor clear dosing and easy replenishment.
Restraints Impact Analysis
| RESTRAINT | (~) % IMPACT ON CAGR | GEOGRAPHIC RELEVANCE | IMPACT TIMELINE |
|---|---|---|---|
| Validation burden around dosing claims | -0.8% | Prescription-led channels | Short term (<= 2 years) |
| Price sensitivity around oral products | -0.7% | Retail and online channels | Short term (<= 2 years) |
| Substitution by wellness supplements | -0.6% | OTC-heavy markets | Medium term (2-4 years) |
| Weak follow-up after diagnosis | -0.5% | Fragmented care settings | Long term (>= 4 years) |
Source: Fact.MR analysis. Updated Jul 30, 2026
- Validation burden around dosing claims: Companies need labeling and therapy evidence before higher-dose use expands.
- Price sensitivity around oral products: Softgel dietary supplements raise price comparisons when products look similar at the pharmacy shelf.
- Substitution by wellness supplements: Therapy value is diluted when products are presented as routine wellness items instead of condition-specific care.
Which countries are scaling Vitamin D Therapy Market fastest?
The country comparison is led by the USA at 8.3% CAGR, followed by Germany at 7.5%, the UK at 6.8%, France at 6.0%, Japan at 5.3%, and Canada at 4.5%. The spread between the USA and Canada is 3.8 percentage points.
- The USA shows the leading listed pace as deficiency treatment, osteoporosis care, and prescription oversight keep therapy products visible.
- Germany follows through pharmacy trust, documented deficiency care, and careful product selection.
- The UK holds a mid-range position as pharmacy access supports repeat oral therapy while buyers compare supplement and prescription options.
- France grows through physician guidance and pharmacy-led access for oral vitamin D therapy.
- Japan is shaped by compact treatment routines and provider-led dose control.
- Canada grows through cold-season supplementation behavior and broad pharmacy access, but its listed CAGR remains below the other tracked countries.
Comparable adoption conditions create different entry paths. Commercial readiness depends on dose clarity, prescription confidence, refill access, and the ability to distinguish therapy products from routine wellness supplements.
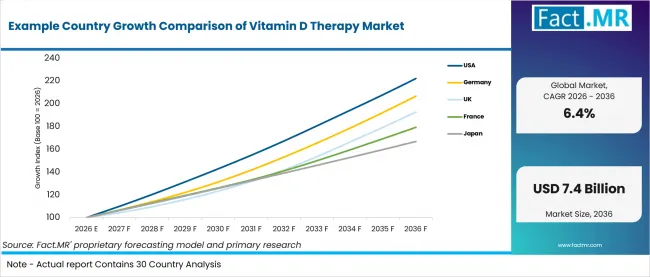
Example Country Growth Comparison Of Vitamin D Therapy Market | Source: Fact.MR
| Country | CAGR (2026-2036) |
|---|---|
| USA | 8.3% |
| Germany | 7.5% |
| UK | 6.8% |
| France | 6.0% |
| Japan | 5.3% |
| Canada | 4.5% |
Source: Fact.MR analysis. Updated Jul 30, 2026
What is driving USA growth from 2026 to 2036?
8.3% CAGR, backed by prescription oversight and osteoporosis therapy review.
USA demand is supported by deficiency treatment, bone-health monitoring and wider digital pharmacy access. Hospital recommendations can improve confidence in higher-dose therapy. Growth may remain uneven when over-the-counter alternatives weaken product differentiation.
How is Germany developing demand?
7.5% CAGR, led by regulated selection and careful pharmacy recommendation.
Germany's outlook reflects a market where clear labeling, documented deficiency and trusted pharmacy advice influence selection. Oral products fit established dispensing routines, and calcium-related care supports wider bone-health use. Newer formats may take longer to gain acceptance because buyers expect strong clinical proof.
What supports UK adoption?
6.8% CAGR, supported by pharmacy access and steady bone-health product use.
UK growth follows a familiar pharmacy-led route where oral vitamin D products remain easy to access. Prescription guidance supports clearer dosing, while osteoporosis care sustains demand among older adults. Adoption may still face pressure from premium pricing and confusion between therapy and wellness supplements.
What defines France's growth outlook?
6.0% CAGR, shaped by physician guidance and pharmacy-led therapy access.
France is expected to grow through physician recommendations and continued pharmacy visibility for oral vitamin D therapy. Familiarity with cholecalciferol supports treatment confidence, especially in osteoporosis care. Routine supplement substitution may make therapy products harder to distinguish.
How does Japan perform?
5.3% CAGR, driven by oral convenience and provider-led product selection.
Japan benefits from compact daily treatment routines that favor tablets and drops. Its aging population also supports continued vitamin D use within osteoporosis care. Pharmacy dispensing and clear dose control strengthen product confidence.
What is shaping Canada's outlook through 2036?
4.5% CAGR, supported by cold-season supplementation and strong pharmacy reach.
Canada's growth is linked to regular vitamin D use during colder months and broad pharmacy access across large service areas. Prescription channels support oversight for higher-dose products, while osteoporosis care keeps therapy visible after diagnosis.
Who leads the Vitamin D Therapy Market?
Abbott Laboratories and Pfizer Inc. support therapy-led demand through established healthcare and pharmaceutical channels, while DSM-Firmenich strengthens the vitamin D formulation and ingredient landscape.
Abbott Laboratories supports therapy demand through established nutrition and healthcare products. Pfizer Inc. contributes pharmaceutical reach and prescription-channel access. DSM-Firmenich adds vitamin D ingredient and formulation expertise. Bayer AG and Sanofi strengthen the market through consumer health and prescription portfolios. Cipla Ltd. extends competition through broad pharmaceutical distribution and affordable therapy access.
Which companies are the key providers?
Key companies include Abbott Laboratories; Pfizer Inc.; DSM-Firmenich; Bayer AG; Sanofi; and Cipla Ltd.
- Abbott Laboratories
- Pfizer Inc.
- DSM-Firmenich
- Bayer AG
- Sanofi
- Cipla Ltd.
Bibliography
- Office for Health Improvement and Disparities. (2024, May 23). Fortifying food and drink with vitamin D: A SACN rapid review. GOV.UK.
- dsm-firmenich. (2024, May 7). dsm-firmenich marks milestone in ampli-D authorization with EU approval of calcidiol as a novel food.
- Bayer AG. (2024, May 28). Bayer advances genome-editing initiatives for nutrition-enhanced vegetables.
- dsm-firmenich. (2025, April 14). From cellular aging to gut microbiome: dsm-firmenich highlights solutions to advance nutrition at Vitafoods 2025.
This Report Answers
- The report provides intelligence on Vitamin D Therapy across therapy type and route choices.
- Segment analysis covers Vitamin D3 Therapy and Oral delivery as the share leaders within the 2026 market.
- Country outlook evaluates the USA, Germany, the UK, France, Japan, and Canada.
- Competitive analysis profiles Abbott Laboratories; Pfizer Inc.; DSM-Firmenich; Bayer AG; Sanofi; and Cipla Ltd.
- Channel assessment covers Prescription and Over-the-counter routes alongside Institutional Supply.
What does the Vitamin D Therapy Market cover?
Vitamin D therapy products are used for deficiency correction and bone-health support where treatment planning requires dose clarity.
The Vitamin D Therapy Market covers Vitamin D3 Therapy and Vitamin D2 Therapy. Active analog and combination formulations are included when therapy use is tied to care planning. Oral; injectable; and topical routes are included where products are positioned for therapy use.
What is included in the scope?
Vitamin D therapy products are used across hospitals and pharmacies. Online pharmacies and specialty clinics are included when products are sold for therapy-led use.
The scope includes Therapy Type; Route of Administration; Application; End User; and Distribution Channel. Coverage spans Osteoporosis and Vitamin D Deficiency. Chronic Kidney Disease and other bone or immune disorders are included when vitamin D therapy is part of care planning.
What is excluded from the scope?
General wellness products remain outside the scope when vitamin D is not the treatment driver.
The scope excludes unrelated multivitamin purchases and raw vitamin D ingredient sales. General nutrition spending is excluded when there is no therapy attribution.
How Was the Analysis Built?
The analysis draws on more than 120 sources and 35 company portfolios. It reviews 25+ countries and more than 20 industry interviews.
- Primary Research: Primary research includes discussions with manufacturers and service providers. It also covers distributors and end users who review purchasing priorities and approval requirements.
- Desk Research: Desk research covers government statistics and regulatory publications. Company filings and trade data are reviewed alongside industry associations and public policy.
- Market Sizing and Forecasting: Market estimates combine historical performance and demand indicators. Pricing trends and segment shares are then checked against country growth and adoption barriers.
- Data Validation and Update Cycle: Findings are validated by comparing interviews with public data and company activity. Regular updates review product launches and changes in commercial adoption.
Segmentation
What is the report’s scope and coverage?
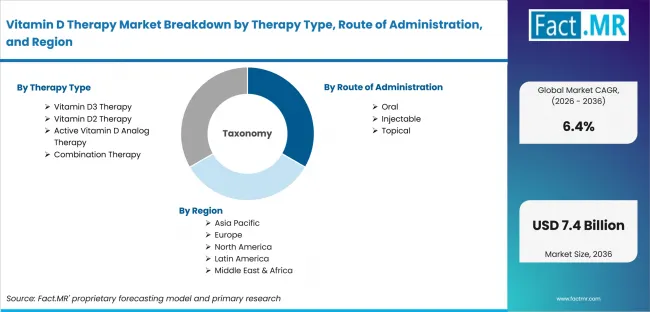
Vitamin D Therapy Market Breakdown By Therapy Type, Route Of Administration, And Region | Source: Fact.MR
| Attribute | Details |
|---|---|
| Quantitative Units | USD 4.0 billion in 2026 to USD 7.4 billion by 2036 at 6.4% CAGR |
| Market Definition | Commercial vitamin D therapy products used for deficiency correction and bone-health treatment support |
| Therapy Type | Vitamin D3 Therapy; Vitamin D2 Therapy; Active Vitamin D Analog Therapy; Combination Therapy |
| Route of Administration | Oral; Injectable; Topical |
| Application | Osteoporosis; Vitamin D Deficiency; Chronic Kidney Disease; Other Bone and Immune Disorders |
| End User | Hospitals; Retail Pharmacies; Online Pharmacies; Specialty Clinics |
| Distribution Channel | Prescription; Over-the-counter; Institutional Supply |
| Regions Covered | North America; Latin America; Europe; East Asia; South Asia and Pacific; Middle East and Africa |
| Countries Covered | Canada; Japan; USA; UK; Germany; France |
| Key Companies Profiled | Abbott Laboratories; Pfizer Inc.; DSM-Firmenich; Bayer AG; Sanofi; Cipla Ltd. |
| Forecast Period | 2026 to 2036 |
| Approach | Hybrid top-down and bottom-up approach using therapy demand; route selection; osteoporosis care pathways; prescription activity; pharmacy access; country patterns; and company portfolio review |
Source: Fact.MR analysis. Updated Jul 30, 2026
How is the market segmented?
-
By Therapy Type
- Vitamin D3 Therapy
- Vitamin D2 Therapy
- Active Vitamin D Analog Therapy
- Combination Therapy
-
By Route of Administration
- Oral
- Injectable
- Topical
-
By Application
- Osteoporosis
- Vitamin D Deficiency
- Chronic Kidney Disease
- Other Bone and Immune Disorders
-
By End User
- Hospitals
- Retail Pharmacies
- Online Pharmacies
- Specialty Clinics
-
By Distribution Channel
- Prescription
- Over-the-counter
- Institutional Supply
-
By Region
- North America
- Canada
- Europe
- UK
- Germany
- France
- East Asia
- Japan
Frequently Asked Questions
Which Therapy Type leads the market?
Which Route of Administration leads the market?
Which Application leads the market?
Which End User leads the market?
Which Distribution Channel leads the market?
Which country records the highest listed CAGR?
What is the primary driver in this market?
What is the main restraint?
Who worked on this report


Preview the report firsthand - request a free sample
Free SampleGet the brochure for pricing and purchase details
Download PDF