- Market Value (2025): USD 71.3 Mn
- Estimated Value (2026): USD 87 Mn
- Forecast Value (2036): USD 640 Mn
- CAGR (2026-2036): 22.1%
What is the AI Yield Triage Market forecast to be worth by 2036?
USD 87 million in 2026 to USD 640 million by 2036, at 22.1% CAGR.
- The AI yield triage market crossed a valuation of USD 71.3 million in 2025.
- Demand is projected to increase from USD 87 million in 2026 to USD 640 million by 2036.
- The market is forecast to record a 22.1% CAGR from 2026 to 2036 as foundries, memory makers and OSAT teams connect yield evidence before release decisions.
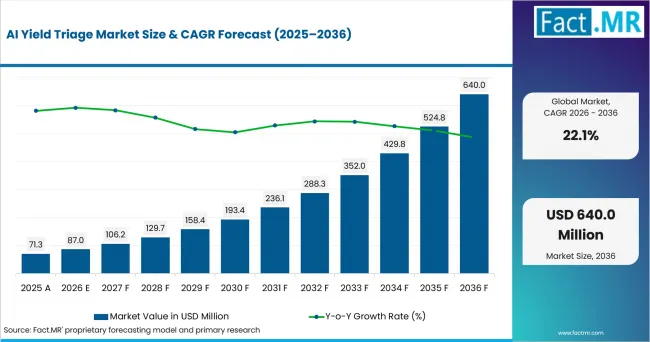
Ai Yield Triage Market Value Analysis | Source: Fact.MR
What are the defining numbers behind AI Yield Triage Market growth?
USD 553 million absolute opportunity by 2036, led by cloud deployment, foundries and multi-source correlation.
- Demand Drivers in the Market
- Yield teams need faster commonality review across lot, wafer, chamber and test data. SEMI reported in April 2026 that semiconductor equipment billings reached USD 135.1 billion in 2025.
- Process groups need root-cause suggestions tied to inspection evidence and tool history. SEMI reported in April 2026 that worldwide 300mm fab equipment spending is projected to reach USD 133 billion in 2026, USD 151 billion in 2027, and USD 155 billion in 2028.
- Fabless teams need shared triage records for supplier and customer quality reviews, especially when product data moves across foundry and OSAT partners.
- OSAT teams need early bin-shift alerts before package flows create avoidable scrap and customer containment work.
- Key Segments Analyzed
- By Triage Method: Multi-source correlation is expected to hold 37.0% share in 2026 due to mixed inspection and test datasets.
- By Data Source: Defect inspection is projected to account for 30.0% share in 2026 supported by early yield-loss visibility.
- By Deployment: Cloud is anticipated to capture 47.0% share in 2026 as multi-site teams need shared model access.
- By End User: Foundries are estimated to represent 43.0% share in 2026 owing to direct process-learning responsibility.
- Analyst Opinion at Fact.MR
- Shambhu Nath Jha, Principal Consultant at Fact.MR, states, "Yield triage is becoming the decision layer between fab data and engineering action. Adoption is expected to expand where model outputs shorten containment time and remain explainable. Suppliers should combine clean data pipelines, ranked evidence and tool context."
- Strategic Implications
- Analytics vendors should show the evidence path behind every ranked yield limiter, including the source dataset and the confidence level used for action.
- Foundry IT teams should prepare inspection, e-test, metrology and FDC connectors before model rollout so engineering reviews do not stall at data cleanup.
- Fabless customers should request triage summaries that protect unrelated process IP while still showing the reason behind yield and quality actions.
- Equipment-data teams should standardize timestamps and tool identifiers before modeling starts, since weak genealogy reduces trust in root-cause ranking.
Germany is projected to record 28.5% CAGR through 2036, followed by Czech Republic at 27.9%. South Korea is forecast at 25.5%, Japan 24.6%, the UK 22.9% and the USA 17.8% as fab data and compute access differ.
How does the AI Yield Triage Market break down by segment?
Multi-source correlation leads at 37.0%; cloud deployment leads at 47.0%.
Which Triage Method dominates?
Multi-source correlation holds 37.0% share in 2026.
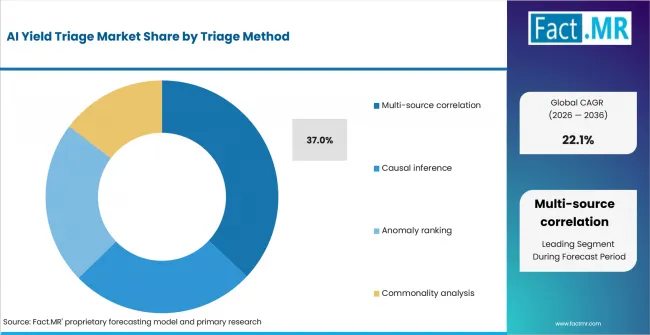
Ai Yield Triage Market Analysis By Triage Method | Source: Fact.MR
Multi-source correlation is expected to hold 37.0% share in 2026 because fabs rarely solve yield loss from one dataset. Inspection flags the event, while FDC and parametric data explain where it started. SEMI reported in June 2026 that global semiconductor equipment billings reached USD 36.55 billion in Q1 2026, up 14% year over year.
What leads the Data Source segment?
Defect inspection accounts for 30.0% share in 2026.
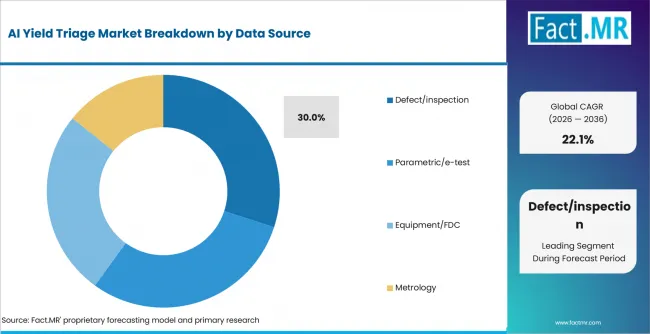
Ai Yield Triage Market Analysis By Data Source | Source: Fact.MR
Defect inspection is projected to account for 30.0% share in 2026 because image review often starts the workflow. Parametric e-test confirms electrical impact, while equipment FDC explains process context. SEMI reported in July 2026 that semiconductor test equipment sales surged 55.3% in 2025, as AI-related demand increased test and performance requirements.
How does Deployment shape demand?
Cloud leads with 47.0% share in 2026.
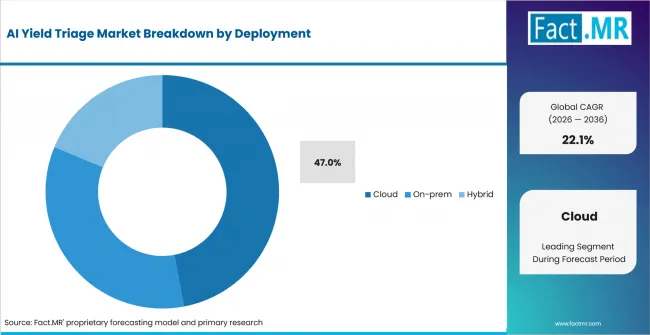
Ai Yield Triage Market Analysis By Deployment | Source: Fact.MR
Cloud deployment is anticipated to capture 47.0% share in 2026 because yield triage needs elastic compute and shared model access. On-prem remains used where IP controls block external hosting. PDF Solutions states Exensio Studio AI supports cloud applications, shop-floor endpoints and test cells.
What supports Foundries within End User?
Foundries represent 43.0% share in 2026.
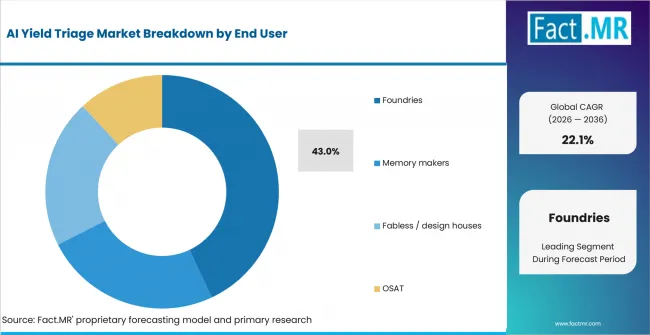
Ai Yield Triage Market Analysis By End User | Source: Fact.MR
Foundries are estimated to represent 43.0% share in 2026 because they own the process steps where yield limiters appear. Memory makers use triage for repeated bin movement. SEMI reported 300mm memory equipment investment is projected to exceed USD 50 billion in 2026.
What is accelerating AI Yield Triage Market adoption, and what is holding it back?
Multi-source fab data drives it; data quality and IP controls restrain it.
Drivers Impact Analysis
| Multi-source root-cause pressure | +2.4% | Global | Short term (<= 2 years) |
|---|---|---|---|
| Tighter process windows | +1.8% | USA, South Korea, Japan | Medium term (2-4 years) |
| Cloud model deployment | +1.3% | USA, UK, Germany | Medium term (2-4 years) |
| Fabless manufacturing visibility | +1.0% | USA, UK, Czech Republic | Long term (>= 4 years) |
| Automated excursion containment | +0.8% | Global | Short term (<= 2 years) |
Source: Fact.MR analysis. Updated Aug 21, 2026
- Multi-source root-cause pressure: Fab teams need triage outputs that rank inspection, FDC, metrology and test evidence.
- Cloud model deployment: Shared models help distributed yield teams compare excursions across fabs and products. PDF Solutions announced in October 2025 that Exensio Studio AI is architected to deploy machine-learning models across endpoints ranging from cloud applications to manufacturing shop floors and remote semiconductor test cells using secure connectivity.
- Fabless manufacturing visibility: Design houses need structured explanations from foundry and OSAT partners. NI states that OptimalPlus applications use analytics and AI-driven insights for yield management. Supplier-facing summaries are expected to gain value where customers need action evidence.
- Automated excursion containment: Early anomaly ranking helps teams hold, retest or escalate lots sooner. yieldWerx and iTest announced in November 2025 that their partnership integrates analytics into the iTest production environment.
Opportunity Impact Analysis
| OPPORTUNITY | (~) % IMPACT ON CAGR | GEOGRAPHIC RELEVANCE | IMPACT TIMELINE |
|---|---|---|---|
| Explainable triage | +1.2% | Global | Short term (<= 2 years) |
| Data harmonization | +1.0% | USA, Germany, Japan | Medium term (2-4 years) |
| OSAT bin-shift analytics | +0.8% | South Korea, Czech Republic | Medium term (2-4 years) |
| Secure yield portals | +0.6% | USA, UK, Japan | Long term (>= 4 years) |
Source: Fact.MR analysis. Updated Aug 21, 2026
- Explainable triage: Engineering sign-off improves when ranked causes show the evidence path. DR YIELD stated in December 2025 that effective AI for yield engineering requires a unified data environment combining test, inspection, and process data with full context. Transparent evidence carries more weight than black-box scoring.
- OSAT bin-shift analytics: Package-test shifts create an entry point for triage outside front-end fabs.
- Secure yield portals: Controlled customer views speed escalation while protecting process IP.
Restraints Impact Analysis
| RESTRAINT | (~) % IMPACT ON CAGR | GEOGRAPHIC RELEVANCE | IMPACT TIMELINE |
|---|---|---|---|
| Inconsistent fab data quality | -0.8% | Global | Short term (<= 2 years) |
| Recipe and customer IP controls | -0.6% | USA, Japan, South Korea | Medium term (2-4 years) |
| Shortage of yield-data specialists | -0.5% | UK, Czech Republic, Germany | Medium term (2-4 years) |
| Validation burden | -0.4% | Global | Long term (>= 4 years) |
Source: Fact.MR analysis. Updated Aug 21, 2026
- Inconsistent fab data quality: Missing timestamps and uneven genealogy weaken confidence in model outputs. The European Commission reported in June 2026 that Czechia still faces weaknesses in interoperability and data sharing.
- Recipe and customer IP controls: Security reviews slow data movement into shared analytics environments. The UK Compute Roadmap emphasizes sovereign, secure and resilient compute capability for sensitive workloads.
- Validation burden: Fabs need repeated proof before AI recommendations influence production action. proteanTecs states that its chip-production analytics retrain models on new production data.
Which countries are scaling the AI Yield Triage Market through 2036?
- The country comparison spans 10.7 percentage points across the six profiled markets.
- Germany remains 0.6 percentage point above Czech Republic due to manufacturing data-space work and electronics output.
- Czech Republic remains 2.4 percentage points above South Korea as chip investment and data infrastructure mature.
- South Korea remains 0.9 percentage point above Japan, supported by memory exports and dense fab learning loops.
- Japan remains 1.7 percentage points above the UK because semiconductor support and R&D spending reinforce local capability.
- The UK remains 5.1 percentage points above the USA as public compute access helps fabless and research teams test AI workflows.
Comparable CAGRs create different entry conditions due to fab scale, power limits, data rules and chip investment. Coverage includes North America, Latin America, Western Europe, Eastern Europe, East Asia, South Asia & Pacific, Middle East & Africa.
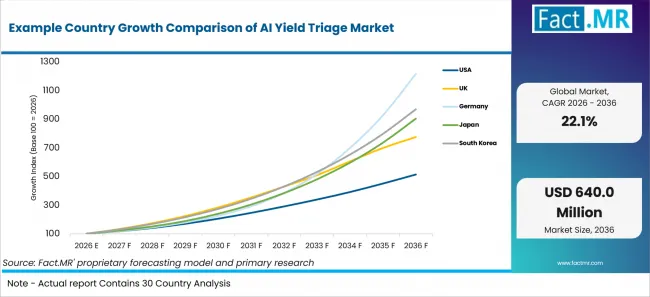
Example Country Growth Comparison Of Ai Yield Triage Market | Source: Fact.MR
| Country | CAGR (2026-2036) |
|---|---|
| Germany | 28.5% |
| Czech Republic | 27.9% |
| South Korea | 25.5% |
| Japan | 24.6% |
| UK | 22.9% |
| USA | 17.8% |
Source: Fact.MR analysis. Updated Aug 21, 2026
What supports Germany adoption?
28.5% CAGR, supported by electronics output and manufacturing data exchange.
Germany’s growth is supported by its electronics manufacturing base and expanding industrial data-sharing infrastructure. Destatis reported in December 2025 that production of computer, electronic and optical products rose 3.9% month over month in October 2025, while BMWE states that about 15 million of Germany’s just under 45 million jobs depend directly or indirectly on manufacturing. Manufacturing-X and Semiconductor-X are expected to improve the exchange of tool, process and quality records.
How is Czech Republic scaling demand?
27.9% CAGR, driven by chip investment and local data infrastructure.
The Czech Republic’s growth is tied to semiconductor investment and the development of domestic research infrastructure. MPO reported in November 2025 that onsemi planned CZK 43.4 billion of investment in Rožnov and was eligible for about CZK 12 billion of support. The Czech government also reported in April 2025 that the Czech Semiconductor Center was established as a consortium of six partners. These developments can strengthen coordination among manufacturers, universities and public programs.
How does South Korea build momentum?
25.5% CAGR, supported by memory exports and high-volume fab learning.
South Korea’s growth reflects its large memory and semiconductor manufacturing base, where high-volume production increases the need for rapid yield analysis. MOTIR and MSIT reported in January 2026 that Korea’s ICT exports reached USD 264.3 billion in 2025, up 12.4% year over year. Government industrial-activity statistics released in April 2026 also showed that March 2026 mining and manufacturing output increased 3.6% year over year. Memory, foundry and OSAT teams are expected to use triage systems to review bin shifts and production excursions across wafer sort and package test.
What supports Japan adoption?
24.6% CAGR, reinforced by semiconductor support and domestic R&D intensity.
Japan’s growth is supported by substantial semiconductor policy funding and strong domestic research activity. METI stated on its May 2026-updated framework page that Japan plans to provide more than JPY 10 trillion in public support for AI and semiconductors through FY2030. The Statistics Bureau of Japan reported in January 2026 that FY2024 R&D expenditure reached JPY 23.79 trillion, up 7.9% from the previous fiscal year. Device and equipment teams are expected to favor explainable triage systems that connect metrology, inspection and test evidence before AI recommendations enter production review.
What supports the UK outlook?
22.9% CAGR, backed by compute access and AI infrastructure investment.
The UK’s growth is supported by expanding AI compute capacity and broader investment in digital infrastructure. The UK Compute Roadmap, published in July 2025 and updated in April 2026, states that more than GBP 1 billion will be invested to expand the AI Research Resource from 21 AI ExaFLOPS in 2025 to 420 AI ExaFLOPS by 2030. GOV.UK reported in January 2026 that five AI Growth Zones are generating GBP 28.2 billion in investment and creating more than 15,000 jobs. These investments support cloud-based triage and research workflows.
What supports USA adoption?
17.8% CAGR, supported by fab data depth and production analytics discipline.
The USA’s growth reflects expanding semiconductor manufacturing activity and strong use of production analytics across fabs, foundries and outsourced assembly and test networks. The U.S. Census Bureau reported in July 2026 that computer and electronic product orders rose 3.1% to USD 31.1 billion in June 2026. BEA reported in June 2026 that greenfield expenditures in computers and electronic products manufacturing reached USD 2.0 billion in 2025. Fabless companies and domestic fabs are expected to require explainable triage outputs linking wafer, test and field-return evidence before AI guidance affects release or containment decisions.
Who leads the AI Yield Triage Market?
PDF Solutions and NI OptimalPlus have direct public yield-analytics coverage, while DR YIELD, proteanTecs, yieldWerx and Galaxy Semiconductor Inc. publish products or analytics relevant to semiconductor yield triage.
NI OptimalPlus is active through lifecycle analytics tools for yield management and scrap avoidance. Both providers fit teams that need connected data and action evidence.
DR YIELD fits the market through integrated yield intelligence and anomaly recognition. proteanTecs supports chip-production analytics through telemetry signals and machine-learning models.
Which companies are the key providers?
Key companies include PDF Solutions, NI OptimalPlus, DR YIELD, proteanTecs, yieldWerx and Galaxy Semiconductor Inc.
- PDF Solutions
- DR YIELD
- proteanTecs
- yieldWerx
- NI OptimalPlus
- Galaxy Semiconductor Inc.
Bibliography
- SEMI. (2026, April 7). SEMI reports global semiconductor equipment billings reached $135 billion in 2025, up 15% year-on-year.
- SEMI. (2025, October 8). SEMI reports global 300mm fab equipment spending expected to total $374 billion over next three years.
- SEMI. (2026, June 4). SEMI reports global semiconductor equipment billings increased 14% year-over-year in Q1 2026.
- SEMI. (2026, July 14). Global semiconductor equipment sales forecast to reach a record $229 billion in 2028, SEMI reports.
- SEMI. (2026, June 29). SEMI projects 300mm memory equipment investment to surpass $50 billion in 2026.
- U.S. Census Bureau. (2026, July 27). Monthly advance report on durable goods manufacturers' shipments, inventories and orders.
- U.S. Bureau of Economic Analysis. (2026, June 10). New foreign direct investment in the United States, 2025.
- Department for Science, Innovation and Technology, & UK Research and Innovation. (2026, April 23). UK Compute Roadmap.
- Department for Science, Innovation and Technology. (2026, January 29). AI Opportunities Action Plan: One Year On.
- Office for National Statistics. (2025, September 12). Index of Production, UK: July 2025.
- Federal Statistical Office (Destatis). (2025, December 8). Production in October 2025: +1.8% on the previous month.
- Federal Ministry for Economic Affairs and Climate Action. (2025, March 31). Manufacturing-X: The future of industrial value creation is connected.
- Federal Statistical Office (Destatis). (2025, July 4). New orders in manufacturing in May 2025: -1.4% on the previous month.
This Report Addresses
- Strategic intelligence on AI yield triage across Triage Method and Data Source.
- Segment analysis of multi-source correlation and cloud deployment.
- Country analysis across Germany, Czech Republic, South Korea, Japan, the UK and USA.
- Competitive analysis of PDF Solutions, DR YIELD, proteanTecs, yieldWerx, Optimal+ and Galaxy Semiconductor Inc..
- Technology assessment across causal inference, anomaly ranking and commonality analysis.
- Use-case assessment across defect inspection, e-test, FDC and metrology data.
What does the AI Yield Triage Market cover?
Correlation, causal inference, anomaly ranking and commonality tools used for semiconductor yield triage.
The AI Yield Triage Market covers software that ranks yield limiters and guides root-cause review in semiconductor manufacturing. It connects defect inspection, parametric e-test, equipment FDC and metrology data so engineers decide whether to hold, release, retest or escalate production lots.
The market differs from broad manufacturing analytics because the output is tied to fab and test action. General dashboards are excluded unless they provide repeatable AI triage logic inside production workflows.
What is included in the scope?
AI yield triage systems used across wafer, test and package quality workflows.
The scope includes licensed software, subscription platforms and cloud analytics used to connect semiconductor quality data with root-cause workflows. It covers yield-triage workflows adjacent to semiconductor defect inspection equipment, SoC test platforms, e-beam wafer inspection systems and known good die screening.
Coverage extends to records from metrology and inspection equipment, backside power metrology, sub-nanometer eBeam, dry etch systems, HBM stack inspection and backside via inspection.
What is excluded from the scope?
General dashboards and standalone inspection hardware are outside the scope.
The scope excludes wafer inspection tools, metrology equipment, tester hardware, base data lakes and dashboards sold without AI triage logic. AI training frameworks and consulting-only yield studies are outside scope unless they deliver production-ready outputs.
How was the analysis built?
120+ sources, 35+ company portfolios, 25+ countries and 20+ interviews.
- Primary Research: Interviews covered fab yield engineers, process integration teams, test managers, OSAT quality teams and analytics providers.
- Desk Research: Desk research covered government statistics, ministry releases, national statistics offices, company product pages, semiconductor association data and investor materials.
- Market Sizing and Forecasting: Estimates combine yield analytics budgets, deployment mix, end-user adoption, country CAGRs, segment shares and provider portfolio checks.
- Data Validation and Update Cycle: Findings are validated through provider checks, source comparisons and interviews with process-control specialists.
Segmentation
What is the report’s scope and coverage?
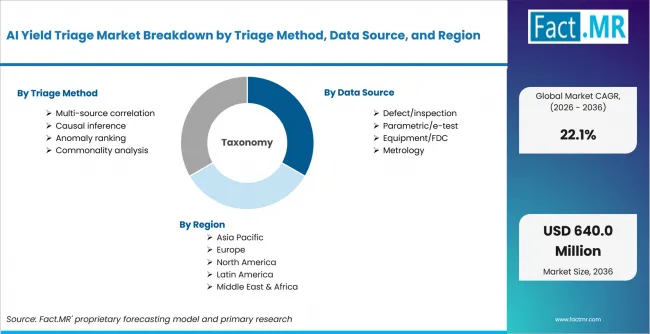
Ai Yield Triage Market Breakdown By Triage Method, Data Source, And Region | Source: Fact.MR
| Attribute | Details |
|---|---|
| Quantitative Units | USD million |
| Market Definition | Software that ranks semiconductor yield limiters and guides root-cause review. |
| Triage Method | Multi-source correlation; Causal inference; Anomaly ranking; Commonality analysis |
| Data Source | Defect inspection; Parametric e-test; Equipment FDC; Metrology |
| Deployment | Cloud; On-prem; Hybrid |
| End User | Foundries; Memory makers; Fabless and design houses; OSAT |
| Regions Covered | North America; Latin America; Western Europe; Eastern Europe; East Asia; South Asia & Pacific; Middle East & Africa |
| Countries Covered | USA; UK; Germany; Japan; South Korea; Czech Republic |
| Key Companies Profiled | PDF Solutions; DR YIELD; proteanTecs; yieldWerx; NI OptimalPlus; Galaxy Semiconductor Inc. |
| Forecast Period | 2026 to 2036 |
| Approach | Hybrid top-down and bottom-up approach using yield workflows, deployment mix, country adoption and provider portfolio review. |
Source: Fact.MR analysis. Updated Aug 21, 2026
How is the market segmented?
-
By Triage Method
- Multi-source correlation
- Causal inference
- Anomaly ranking
- Commonality analysis
-
By Data Source
- Defect inspection
- Parametric e-test
- Equipment FDC
- Metrology
-
By Deployment
- Cloud
- On-prem
- Hybrid
-
By End User
- Foundries
- Memory makers
- Fabless and design houses
- OSAT
-
By Region
- North America
- Latin America
- Western Europe
- Eastern Europe
- East Asia
- South Asia & Pacific
- Middle East & Africa
Frequently Asked Questions
How big is the AI yield triage market in 2026?
What is the CAGR of the AI yield triage market from 2026 to 2036?
Which Triage Method leads the AI yield triage market?
Which deployment leads the AI yield triage market?
Which companies are profiled in the AI yield triage market?
Who worked on this report


Preview the report firsthand - request a free sample
Free SampleGet the brochure for pricing and purchase details
Download PDF