- Market Value (2025): USD 739.1 Mn
- Estimated Value (2026): USD 850.0 Mn
- Forecast Value (2036): USD 3439.0 Mn
- CAGR (2026-2036): 15.0%
What is the Waste Bioplastics Resins Market forecast to be worth by 2036?
USD 850.0 million in 2026 to USD 3439.0 million by 2036 at a 15.0% CAGR.
- The waste bioplastics resins market crossed a valuation of USD 739.1 million in 2025.
- Demand is projected to increase from USD 850.0 million in 2026 to USD 3439.0 million by 2036.
- The market is forecast to record a 15.0% CAGR from 2026 to 2036 as packaging converters and resin compounders use waste-fed polymers in applications with tighter material-origin proof.
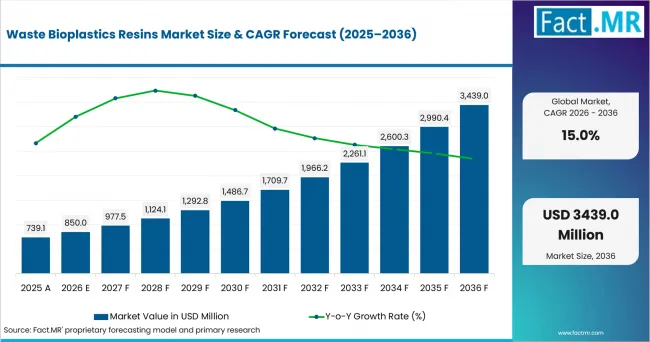
Waste Bioplastics Resins Market Value Analysis | Source: Fact.MR
What are the defining numbers behind Waste Bioplastics Resins Market growth?
An absolute opportunity of USD 2,589.0 million is expected between 2026 and 2036.
- Demand Drivers in the Market
- Packaging converters need resins that reduce fossil input while retaining sealability and film handling on existing lines. European Bioplastics reported in December 2025 that global biobased plastics production capacity represented roughly 0.5% of the 431 million tonnes of plastics produced annually worldwide.
- Food processors need higher-value outlets for residue streams. USDA Agricultural Research Service documented FY 2025 work to convert food waste and under-valued byproducts into PHA and related bioplastics.
- Resin compounders need neat pellet grades that blend predictably because downstream customers test odor, seal strength and process temperature before approval.
- Brand product teams need clear proof of material origin because claims must match feedstock records and end-of-life labeling before larger orders.
- Key Segments Analyzed
- By Polymer Family: PHA and PHB are expected to hold 36.0% share in 2026 because microbial conversion routes fit waste carbon and compostability positioning.
- By Waste Feedstock: Food-processing waste is projected to account for 50.0% share in 2026 due to recurring residue streams from prepared-food and beverage operations.
- By Resin Form: Neat pellets are anticipated to capture 51.0% share in 2026, supported by direct use in films and molded packaging trials.
- By Application: Flexible packaging is estimated to represent 44.0% share in 2026 owing to lightweight formats where resin substitution is evaluated first.
- Analyst Opinion at Fact.MR
- Shambhu Nath Jha, Principal Consultant at Fact.MR states, "Waste bioplastics resins draw attention because the feedstock story is visible to customers and regulators. Adoption is expected to move faster where suppliers document carbon source and conversion route beside the end-of-life path. Resin vendors should combine polymer consistency with certification support before arguing for broader substitution through converter trials."
- Strategic Implications
- Resin producers should publish feedstock traceability and batch-property windows for every commercial grade.
- Converters should qualify waste-fed pellets against line speed, seal strength and odor performance before switching larger volumes.
- Brand owners should map applications to local collection routes before scaling claims into multinational packaging programs.
- Waste managers should separate food residues and used oils more cleanly where polymer producers need low-contaminant feedstock.
The USA is projected to record 18.3% CAGR through 2036 supported by resin-manufacturing depth and waste-carbon research. Japan is forecast to post 16.5% CAGR owing to plastic resource-circulation projects and biomass polymer policy. Germany is anticipated to advance at 15.0% CAGR due to packaging recycling discipline and biowaste systems. The UK is estimated to hold 13.6% CAGR, reinforced by food manufacturing and tax reporting for plastic packaging. South Korea is expected to reach 12.9% CAGR because plastic reduction policy turns waste resources into resin feedstock.
How does the Waste Bioplastics Resins Market break down by segment?
PHA and PHB lead Polymer Family at 36.0%; Neat pellets lead Resin Form at 51.0%.
Which Polymer Family dominates?
PHA and PHB hold 36.0% share in 2026.
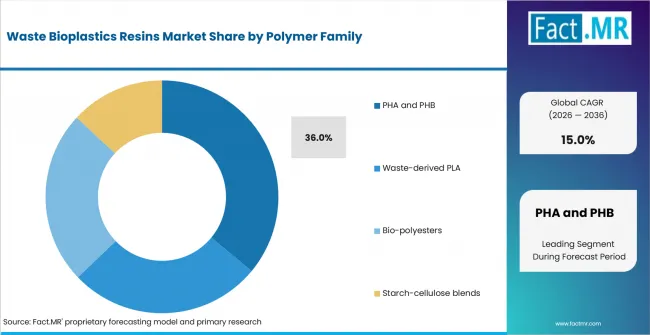
Waste Bioplastics Resins Market Analysis By Polymer Family | Source: Fact.MR
PHA and PHB lead because microbial routes use organic carbon from residue streams and can support compostability claims where testing is available. European Bioplastics reported average 2025 bioplastics-capacity utilization of 72%, with actual production of about 1.67 million tonnes.
What leads the Waste Feedstock segment?
Food-processing waste accounts for 50.0% share in 2026.
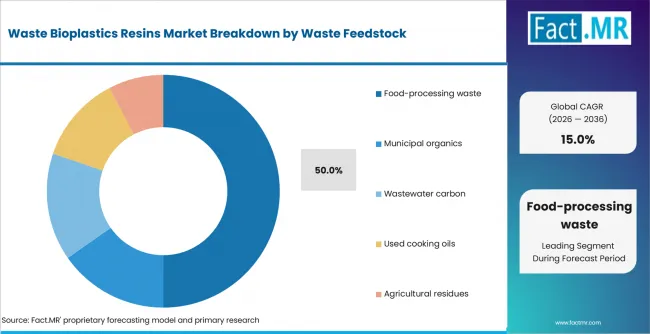
Waste Bioplastics Resins Market Analysis By Waste Feedstock | Source: Fact.MR
Food-processing waste leads because it offers recurring streams from plants that already measure quality and contamination. ONS reported on July 24, 2026 that food manufacturing represented 22.9% of UK manufacturers' sales in 2025.
How does Resin Form shape demand?
Neat pellets account for 51.0% share in 2026.
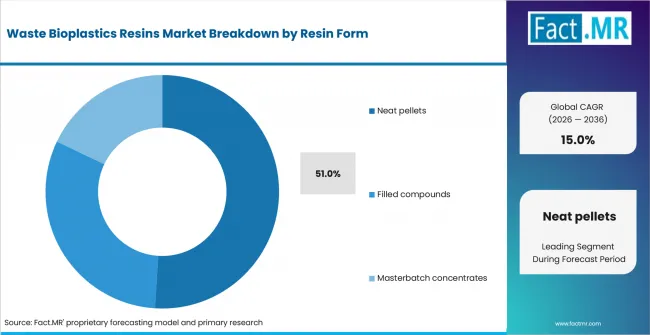
Waste Bioplastics Resins Market Analysis By Resin Form | Source: Fact.MR
Neat pellets are preferred when converters compare waste-fed grades with fossil-derived materials on the same equipment. They reduce formulation variables during film and thermoforming trials. Masterbatch concentrates still require extra letdown control before buyers accept a resin change.
What supports Flexible packaging within Application?
Flexible packaging holds 44.0% share in 2026.
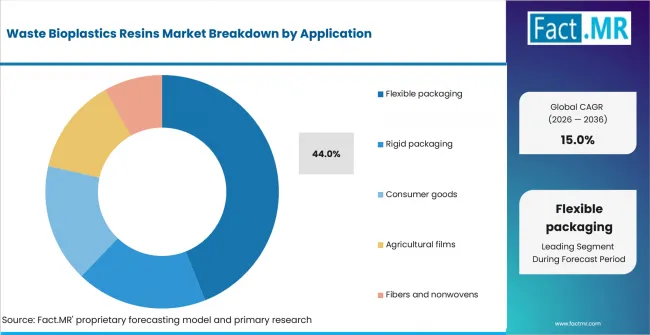
Waste Bioplastics Resins Market Analysis By Application | Source: Fact.MR
Flexible packaging leads because lightweight formats put resin choice into cost and sealing decisions. European Bioplastics reported in December 2025 that packaging remained the largest bioplastics application in 2025, accounting for 41.3% of global production capacity, or 0.95 million tonnes.
What is accelerating Waste Bioplastics Resins Market adoption, and what is holding it back?
Demand is expected to rise through food-waste feedstock use and packaging reformulation. Growth is limited by feedstock variability, certification gaps and cost pressure.
Drivers Impact Analysis
| DRIVER | (~) % IMPACT ON CAGR | GEOGRAPHIC RELEVANCE | IMPACT TIMELINE |
|---|---|---|---|
| Food-processing waste converted into PHA and PHB feedstock | +1.9% | North America, Europe, East Asia | Short term (<= 2 years) |
| Packaging converters seeking lower fossil-resin exposure | +1.4% | Global | Medium term (2-4 years) |
| Brand demand for certified compostable formats | +1.0% | Europe, Japan, USA | Medium term (2-4 years) |
Source: Fact.MR analysis. Updated Aug 21, 2026
- Food-processing waste converted into PHA and PHB feedstock: Consistent organic residues help fermentation-based resin producers reduce feedstock uncertainty. USDA ARS documented FY 2025 work on waste and byproduct conversion into PHA bioplastics.
- Packaging converters seeking lower fossil-resin exposure: Resin substitution is being tested first in bags and liners where converters compare gauge, odor and heat sealing.
- Brand demand for certified compostable formats: Brand owners need grades that meet certification rules and behave consistently in conversion. The European Commission notes that Regulation (EU) 2025/40 entered into force in February 2025.
Opportunity Impact Analysis
| OPPORTUNITY | (~) % IMPACT ON CAGR | GEOGRAPHIC RELEVANCE | IMPACT TIMELINE |
|---|---|---|---|
| Neat pellet grades for flexible packaging trials | +1.2% | USA, UK, Japan | Short term (<= 2 years) |
| PHA blends for coatings and molded serviceware | +0.9% | South Korea, Japan, Europe | Medium term (2-4 years) |
| Used cooking oil and agricultural residue streams | +0.7% | South Korea, Germany, USA | Long term (>= 4 years) |
Source: Fact.MR analysis. Updated Aug 21, 2026
- Neat pellet grades for flexible packaging trials: Pellet suppliers gain earlier specification work when grades run through existing extrusion lines.
- PHA coatings for paper and foodservice packaging: Coated paper and board provide a current PHA application route before higher-volume film adoption. TripleW introduced a PHA extrusion-coating platform in October 2025 targeting paper and board used in food serviceware and food packaging.
- Used cooking oil and agricultural residue streams: Waste-oil and residue routes widen feedstock options. South Korea’s environment ministry proposed adding waste cooking oil, coffee grounds and rice husks as circular resources in July 2025.
Restraints Impact Analysis
| RESTRAINT | (~) % IMPACT ON CAGR | GEOGRAPHIC RELEVANCE | IMPACT TIMELINE |
|---|---|---|---|
| Feedstock contamination and uneven composition | -0.8% | Global | Short term (<= 2 years) |
| Higher resin cost versus fossil-based materials | -0.6% | North America, Europe, East Asia | Medium term (2-4 years) |
| End-of-life claims dependent on local collection systems | -0.5% | Europe, Japan, South Korea | Long term (>= 4 years) |
Source: Fact.MR analysis. Updated Aug 21, 2026
- Feedstock contamination and uneven composition: Waste-derived inputs vary by season and processor. Umweltbundesamt published a September 2025 study examining measures to increase the quantity and purity of separately collected biowaste.
- Higher resin cost versus fossil-based materials: Higher cost relative to established fossil-based resins is expected to constrain substitution where converters cannot recover the material premium.
- End-of-life claims dependent on local collection systems: Resin claims weaken when recovery routes do not match product labels. Eurostat reported in October 2025 that EU residents generated 35.3 kg of plastic packaging waste per person in 2023.
Which countries are scaling the Waste Bioplastics Resins Market through 2036?
- The country comparison spans 5.4 percentage points and forms three practical growth bands across the forecast period.
- The USA remains 1.8 percentage points above Japan through resin-manufacturing depth and renewed waste-carbon research.
- Japan remains 1.5 percentage points above Germany through plastic resource-circulation projects and biomass polymer policy.
- Germany remains 1.4 percentage points above the UK through packaging recycling discipline and biowaste systems.
- The UK remains 0.7 percentage point above South Korea as food manufacturing and packaging-tax reporting support controlled trials.
- South Korea closes the displayed range because plastic-reduction policy is expected to create selective feedstock openings.
Comparable CAGRs can create different entry conditions due to feedstock availability, conversion cost and packaging regulation. Full report coverage includes North America, Latin America, Western Europe, Eastern Europe, East Asia, South Asia & Pacific, Middle East & Africa.
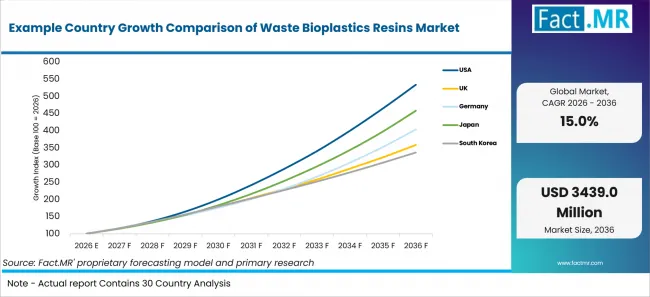
Example Country Growth Comparison Of Waste Bioplastics Resins Market | Source: Fact.MR
| Country | CAGR (2026-2036) |
|---|---|
| USA | 18.3% |
| Japan | 16.5% |
| Germany | 15.0% |
| UK | 13.6% |
| South Korea | 12.9% |
Source: Fact.MR analysis. Updated Aug 21, 2026
What supports USA adoption?
18.3% CAGR, supported by resin-manufacturing depth and waste-carbon research.
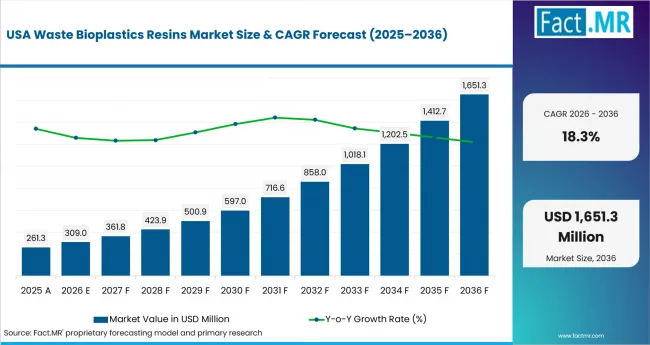
Waste Bioplastics Resins Market Country Value Analysis | Source: Fact.MR
U.S. Census Bureau County Business Patterns provides establishment data for NAICS 325211, Plastics Material and Resin Manufacturing. EPA’s containers and packaging data, updated in October 2025, reports that 14.5 million tons of plastic containers and packaging were generated in 2018. The USA is projected to record 18.3% CAGR as converters test neat pellets where line performance and claim proof can be checked together.
How is Japan scaling demand?
16.5% CAGR, backed by plastic resource-circulation projects and biomass polymer policy.
Japan is aligning resin adoption with plastic resource-circulation policy. The Ministry of the Environment selected 8 FY2025 advanced social implementation projects for plastic resource circulation in August 2025. Japan's 2026 Environment White Paper reports that renewable and circular resources accounted for about 30.1% of total resource inputs in FY2023. Japan is forecast to post 16.5% CAGR as packaging users seek certified grades with stronger claim discipline.
What supports Germany adoption?
15.0% CAGR, driven by packaging recycling discipline and biowaste handling systems.
Germany gives waste-fed resin suppliers a strict packaging test market. Umweltbundesamt and the Central Agency Packaging Register reported in January 2026 that around 5.5 million tonnes of packaging waste collected through Germany’s dual systems were recovered in 2024. They also reported that, for the first time, more than 70% of plastic packaging was sent for material recycling. Germany is anticipated to advance at 15.0% CAGR because converters must prove sorting compatibility before broader substitution.
How is the UK developing demand?
13.6% CAGR, supported by food manufacturing and plastic packaging tax reporting.
The UK combines food manufacturing residue with tighter packaging reporting. Defra reported in March 2026 that separately collected food waste sent for recycling in England reached 535 thousand tonnes in 2024, up 6.7% from 2023. HMRC reported in August 2025 that 38% of total plastic packaging tonnage manufactured in and imported into the UK in 2024/25 was declared taxable under the Plastic Packaging Tax. The UK is estimated to hold 13.6% CAGR as brand owners compare waste-fed resin claims with tax and compliance files.
How is South Korea scaling participation?
12.9% CAGR, reinforced by plastic reduction policy and waste-resource designation.
South Korea is turning plastic reduction into a feedstock policy question. The Ministry of Climate, Energy and Environment reported in April 2026 that household and business plastic waste was approximately 7.8 million tons in 2024 and is projected to reach about 10 million tons in 2030. In July 2025, its predecessor, the Ministry of Environment, proposed adding waste cooking oil, coffee grounds, and rice husks and bran as designated circular resources.
Who leads the Waste Bioplastics Resins Market?
Specialized PHA, PHB and PLA resin providers define current commercialization activity.
Teknor Apex (Danimer Scientific) is treated under Teknor Apex following its June 2025 acquisition, although Danimer continues to operate as a separate entity under its own name. The combination adds PHA, PLA and custom formulation know-how for converters that need waste-fed resins ready for qualification.
TripleW is active through PHACT PHA grades. TotalEnergies Corbion supports PLA development through Luminy PLA for rigid and foam applications.
Newlight Technologies, Genecis Bioindustries Inc. and Full Cycle Bioplastics remain relevant because they focus on waste carbon, organic residues or PHA routes. Competition is expected to center on feedstock traceability, polymer consistency and converter support.
Which companies are the key providers?
Key companies include Teknor Apex (Danimer Scientific); TripleW; Newlight Technologies; Genecis Bioindustries Inc.; Full Cycle Bioplastics; and TotalEnergies Corbion.
- Teknor Apex (Danimer Scientific)
- TripleW
- Newlight Technologies
- Genecis Bioindustries Inc.
- Full Cycle Bioplastics
- TotalEnergies Corbion
Bibliography
- CJ Biomaterials, Inc. (2025a, October 1). CJ Biomaterials launches new PHA platform for extrusion coatings.
- Department for Environment, Food & Rural Affairs. (2026, March 31). Local authority collected waste management – annual results 2024/25.
- European Bioplastics e.V. (2025, December 2). Bioplastics Market Development Update 2025.
- European Commission, Directorate-General for Environment. (2025, February 11). New rules enter into force for a more sustainable and competitive packaging economy.
- Eurostat. (2025, October 22). Plastic packaging waste in the EU: 35.3 kg per person.
- German Environment Agency, & Central Agency Packaging Register. (2026, January 27). Facts against myths: Packaging waste recycling in Germany is working.
- Ministry of Climate, Energy and Environment. (2026, April 28). Breaking free from oil imports: Toward a sustainable, plastic-free circular economy.
- Ministry of Environment, Republic of Korea. (2025, July 20). Recycling eased as waste cooking oil and two other items designated as circular resources.
- Office for National Statistics. (2026, July 24). UK manufacturers' sales by product: 2025.
- TotalEnergies Corbion. (2025, April 15). Expanded PLA a new type of molded foams.
- U.S. Census Bureau. (2025, June 26). County Business Patterns: 2023 [Data set].
- U.S. Department of Agriculture, Agricultural Research Service. (2025). Zero Waste Agricultural Processing: 2025 annual report.
- U.S. Environmental Protection Agency. (2025, October 23). Containers and packaging: Product-specific data.
This Report Answers
- The report explains where waste bioplastics resins are used across polymer family, waste feedstock, resin form and application.
- Segment analysis identifies the leading subsegments and the operational reasons converters prioritize them.
- Country analysis examines the listed markets and the feedstock or policy mechanisms supporting resin deployment.
- Competitive analysis reviews current providers across PHA, PHB, PLA and waste-carbon conversion routes.
- Application analysis assesses how packaging, consumer goods and films shape qualification decisions.
What does the Waste Bioplastics Resins Market cover?
The Waste Bioplastics Resins Market covers bioplastics materials produced from waste or recovered biogenic carbon streams. It includes PHA and PHB, waste-derived PLA, bio-polyesters and starch-cellulose blends used as resin inputs.
The assessment covers neat pellets, filled compounds and masterbatch concentrates. It connects demand with biodegradable packaging materials and bioplastics for packaging where converters need resin qualification evidence.
What is included in the scope?
The scope includes waste-derived polymers sold to converters, compounders and product manufacturers. It includes bio-based plastics when the feedstock route uses organic waste, wastewater carbon, used oils or agricultural residues.
Included applications cover films, molded packaging, coated structures, consumer goods and agriculture-related formats. The analysis connects resin adoption with plant based packaging, sustainable plastic packaging and sustainable packaging formats.
What is excluded from the scope?
The scope excludes conventional fossil-based plastics sold without waste-fed or biogenic carbon content. It also excludes recycled plastic resins when the product is conventional recycled polymer without a bioplastic resin route.
Waste collection services and plastic waste management systems are covered only as feedstock and end-of-life context. Finished biopolymer films are excluded when they are sold as converted packaging instead of resin feedstock.
How Was the Analysis Built?
The analysis draws on 120+ sources, 35+ company portfolios, 25+ countries and 20+ industry interviews.
- Primary Research: Primary research includes discussions with resin producers, compounders, converters, packaging brands, waste managers and procurement teams. These conversations examine feedstock sourcing, adoption, qualification barriers and cost pressure.
- Desk Research: Desk research covers government statistics, regulatory publications, company releases, trade data, technical studies, standards and public policy. Every source is documented in the bibliography.
- Market Sizing and Forecasting: Market estimates combine historical performance, feedstock availability, pricing trends, segment shares, application demand, company participation and barriers to expansion.
- Data Validation and Update Cycle: Findings are validated by comparing interviews with public data, company activity, regulatory changes and waste-stream evidence. Updates review launches, feedstock contracts and certifications.
Segmentation
What is the report’s scope and coverage?
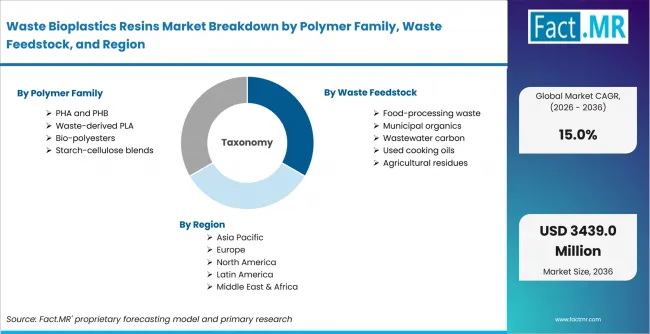
Waste Bioplastics Resins Market Breakdown By Polymer Family, Waste Feedstock, And Region | Source: Fact.MR
| Attribute | Details |
|---|---|
| Quantitative Units | USD million in 2026 to USD million by 2036 at a CAGR |
| Market Definition | Resins made from waste or recovered biogenic carbon streams, including PHA, PHB, waste-derived PLA, bio-polyesters and starch-cellulose blends. |
| Polymer Family | PHA and PHB; Waste-derived PLA; Bio-polyesters; Starch-cellulose blends |
| Waste Feedstock | Food-processing waste; Municipal organics; Wastewater carbon; Used cooking oils; Agricultural residues |
| Resin Form | Neat pellets; Filled compounds; Masterbatch concentrates |
| Application | Flexible packaging; Rigid packaging; Consumer goods; Agricultural films; Fibers and nonwovens |
| Regions Covered | North America; Latin America; Western Europe; Eastern Europe; East Asia; South Asia & Pacific; Middle East & Africa |
| Countries Covered | USA; UK; Germany; Japan; South Korea |
| Key Companies Profiled | Teknor Apex (Danimer Scientific); TripleW; Newlight Technologies; Genecis Bioindustries Inc.; Full Cycle Bioplastics; TotalEnergies Corbion |
| Forecast Period | 2026 to 2036 |
| Approach | Hybrid top-down and bottom-up approach using polymer family, waste feedstock, resin form, application demand and provider portfolio review. |
Source: Fact.MR analysis. Updated Aug 21, 2026
How is the market segmented?
-
By Polymer Family
- PHA and PHB
- Waste-derived PLA
- Bio-polyesters
- Starch-cellulose blends
-
By Waste Feedstock
- Food-processing waste
- Municipal organics
- Wastewater carbon
- Used cooking oils
- Agricultural residues
-
By Resin Form
- Neat pellets
- Filled compounds
- Masterbatch concentrates
-
By Application
- Flexible packaging
- Rigid packaging
- Consumer goods
- Agricultural films
- Fibers and nonwovens
-
By Region
- North America
- Latin America
- Western Europe
- Eastern Europe
- East Asia
- South Asia & Pacific
- Middle East & Africa
Frequently Asked Questions
How big is the waste bioplastics resins market in 2026?
What is the CAGR of the waste bioplastics resins market from 2026 to 2036?
Which polymer family leads the waste bioplastics resins market?
Which waste feedstock leads the waste bioplastics resins market?
Who are the leading companies in the waste bioplastics resins market?
Who worked on this report


Preview the report firsthand - request a free sample
Free SampleGet the brochure for pricing and purchase details
Download PDF