Allergy Care Market

Allergy Care Market Analysis, By Type, By Product Type, By Form, By Sales Channel, and Region - Market Insights 2025 to 2035

The eye allergy segment is projected to grow at a CAGR of 6.7%, whereas another segment skin allergy is likely to grow at 6.8%. In terms of countries USA is projected to grow at 6.2%, followed by Germany at 7.3% and Japan to grow at 7.7%.

Allergy Care Market Outlook (2025 to 2035)

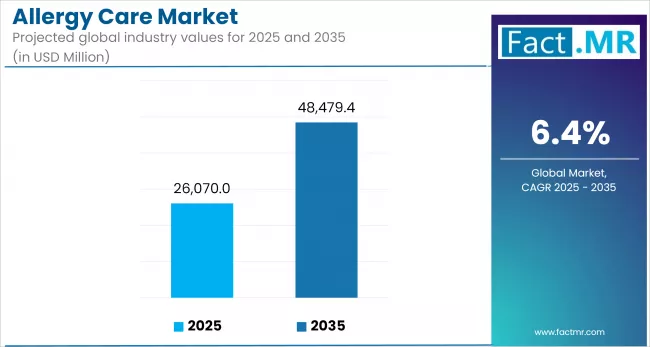
The global allergy care market expected to reach USD 48,479 Million by 2035, up from USD 24,688 million in 2024. During the forecast period 2025 to 2035, the industry is projected to register at a CAGR of 6.4%.

Rising allergy prevalence due to pollution, climate change, and dietary shifts, combined with pharmaceutical innovations such as biologics and advanced antihistamines, is boosting market growth. Digital health tools, early pediatric diagnosis, and increased government support for healthcare are further accelerating the allergy care market.

Allergy Care Market

What are the drivers of Allergy Care Market?

The market for allergy care is also experiencing solid development, driven by the growing prevalence of allergies worldwide. Allergies occur as a consequence of elevated pollution levels, changes in diet, and exposure to allergens. Cities and climate change are also exacerbating outcomes such as asthma, hay fever, and food allergies, thereby increasing the demand for efficient allergy treatment and diagnostics.

Another driver is innovation in the pharmaceutical sector. The increase in the application of immunotherapy, advancements in biologics, and the use of follow-up antihistamines with minimal side effects have been tremendous in improving patient outcomes and promoting further use. Increasing consumer awareness and self-diagnosis of allergies, facilitated by the use of over-the-counter (OTC) allergy therapies, is also contributing to market growth, particularly in developed economies.

Online consultations and allergy tracking apps are part of digital health tools that help introduce early intervention and better adherence to treatment. In addition, the rate at which allergies in pediatrics are being detected has accelerated, prompting the use of hypoallergenic products and individualized attention. The governments and medical organizations are also increasing their assistance in terms of funding allergy research and enhanced access to healthcare services in emerging areas.

What are the regional trends of Allergy Care Market?

The North American continent occupies the largest share of the allergy care market, triggered by a high prevalence of allergies, healthcare systems, and availability of OTC drugs. Immunotherapy and allergy diagnostics are widely used combined with wide insurance covers of chronic allergic disorders in the USA

European countries such as Germany, France and the UK are investing in new biologics/ allergen immunotherapy. Growth is further being facilitated by government-funded allergy awareness campaigns and reimbursement policies within the EU. The pace of allergy-causing conditions is also increasing in urban cities due to rising urban pollution and varying climates.

The growth is also a reality in forming a high-growth region, as demonstrated by Asia-Pacific is characterized by the increasing disposable incomes, affordability of healthcare coverage, and awareness regarding allergies in nations such as China, India and Japan. Allergic conditions have surged due to the high rate of rapid urbanization and Westernized living, and there is an immediate need for anti-allergy drugs and anti-allergy equipment.

Latin America, the Middle East, and Africa regions are also experiencing a gradual growth in allergy testing services as well as penetration by international pharmaceutical companies into local markets, usually through strategic alliances and affordability-friendly formulations.

What are the challenges and restraining factors of Allergy Care Market?

The allergy care market faces several restraints, and the first is the high price of advanced biologics and immunotherapy, which makes it inaccessible to lower- and middle-income countries. Chronic allergies also have complex treatments, so patient adherence is poor since they require long-term treatment effectiveness and demand.

Another issue that has remained prevalent is inconsistent allergy diagnosis, particularly in rural and underdeveloped regions. Diverse allergic states remain unreported or misdiagnosed because of the poor availability of experts and medical equipment. Additionally, a lack of knowledge about contemporary allergy treatments among both patients and healthcare professionals also limits the market.

Innovative therapies take a long time to be approved due to regulatory problems as well. Drug approval variations of different countries and the use of different standards in relation to allergens present a challenge to a firm with global ambitions. Additionally, the issue of side effects of using some of the treatments that include the risks of use of corticosteroids and immunotherapy also puts away some consumers.

The cyclical nature of the demand, therefore, means that the level of allergy prevalence varies seasonally, which hinders the ability to generate consistent sales for the manufacturers and has an effect on the commitment to making long-term research and development investments.

Country-Wise Outlook

Innovation-Driven Access and Digital Tools Elevate USA Allergy Care

Allergy Care Market Cagr Analysis By Country

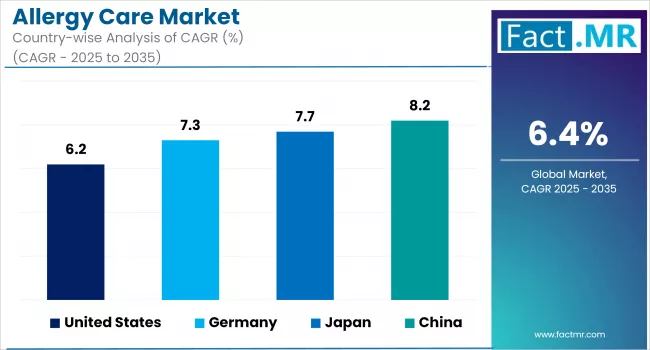
The market driven by high prevalence of allergic rhinitis, food allergies, and asthma and significant R&D and biotech innovativeness makes United States a global leader in the allergy care market. The CDC stated that more than 50 million Americans develop allergies annually, which generates stable demand in diagnostics and immunotherapies.

The market is characterized by robust insurance coverage, FDA regulation of biologics and fast adoption of digital health. Early detection and treatment compliance are shifting with the help of tele-allergy testing, home allergen testing, and AI-supported EHR integration. Prominent developments are that sublingual immunotherapy (SLIT) becomes more popular and the use of monoclonal antibody therapies (omalizumab, etc.). There is also some regional inequality, and rural populations have less precision diagnostic services and allergy specialists.

Germany Champions Standardized Diagnostics and Environmental Allergy Control

The European countries have competitors in the field of allergy care with Germany positioned as the most powerful one because of the policy in terms of health of the population, the wide allergen surveillance, the uniformity of its diagnostic approaches. Hay fever and atopic dermatitis are also allergic diseases that are becoming more and more popular, especially in children and teenagers, which promotes the need to introduce interventions as early as possible.

The country has national allergen exposure mapping, cross-system care pathways and the national coverage of reimbursement of skin prick tests, serum-specific IgE, and spirometry. Germany also uses the digital systems of prescription and allergy registries that aid in more specific immunotherapy tracking. Systemic prevention of allergy through the use of public health programs, such as community health and school-based awareness and indoor air quality policies, is possible.

Japan Prioritizes Urban Allergen Response and Tech-Enabled Monitoring

Japan is the most developed allergy care market in the Asia-Pacific region, especially against seasonal allergens which are airborne, such as the cedar pollens, which affect more than 25 percent of the population. The pandemic of allergy has been escalated by the rapid urbanization and climate change processes, which provided an impetus to government-funded research and diagnostic novelty.

The early testing is encouraged by the Ministry of Health with the help of CAP-RAST and CRD. The Japanese pharma firms are also in the process of producing innovative treatment like peptide-based immune-modulators. The Society 5.0 endeavor of Japan also lends a helping hand to allergy forecasting applications with AI and smart wearable that monitors environmental trigger and changes in symptoms. Good mobile health adoption and health literacy enhance the compliance of treatments and patient self-management.

Category-Wise Analysis

Rising urban allergens drive demand in eye allergy treatments

Allergy Care Market Analysis By Type

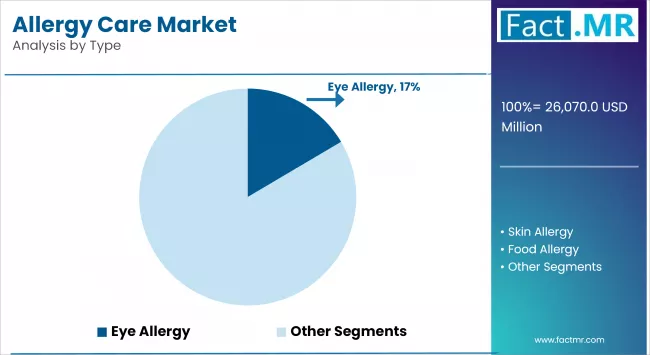
The incidence of eye allergies is on the rise due to the urbanization of populations, which exposes them to more environmental irritants through air pollution. The presented segment addresses symptoms such as itching, redness, and tearing, which are often triggered by pollen, dust mites, and pet dander. It is treated using antihistamine and mast cell stabilizer drops and recently shifted towards preservative-free and single-dose preparations in an attempt to minimize irritancy of the eyes.

Nasal sprays dominate allergy relief with direct action and accessibility

Allergy Care Market Analysis By Product Type

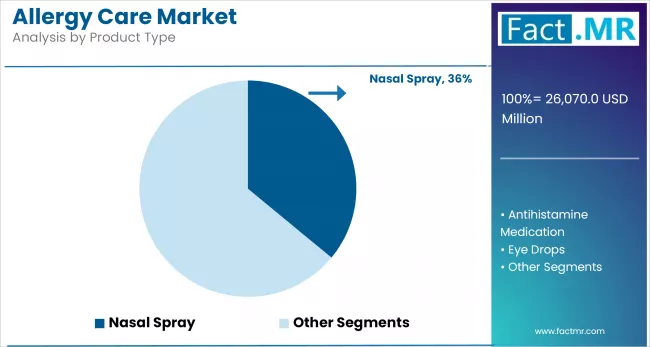
A key product type within the sphere of allergy care is nasal sprays, which act specifically and quickly because of their local effect on nasal inflammation and clogging. They are used to treat allergic rhinitis and administer corticosteroids or antihistamines into the nasal mucosa and reduce systemic exposure.

As OTC medications, as well as prescribing products, are at their highest degree of utilization during seasonal increases in allergens. Other technological developments involve the combination formulas that improve efficacy and compliance especially within North America and Europe.

Tablets, gels, and pills remain a pillar of systemic allergy management

Tablets, gels, and pills, as oral forms of allergy relief, provide a convenient daily solution to various allergy symptoms, including sneezing and skin irritation. Non-sedating second-generation antihistamines, whose use is on the increase in the working adult and children population, have propelled this segment. There are chewable and long-acting forms to meet the flexibility of dosing. Growth is facilitated by the regulatory acceptance of long-acting antihistamines in major markets, particularly in Asia-Pacific and Latin America, where there is an increasing need for the oral form of drugs.

Competitive Analysis

The allergy care market is best described as dynamic and to some extent fragmented with the rising competition being witnessed in all the pharmaceutical, nutraceutical and the biotechnology sectors. The firms are competing over market shares by innovating immunotherapy solutions, over-the-counter antihistamines and biological treatments. Increasing generic product introduction, together with patent expirations on several important branded products, has been putting pressure on margins, and the pressure results in manufacturers extending their product range as well as outreach to further regions.

Digital Health Integration is turning into the tactical lever. Competitors are using telehealth platforms and AIs in diagnosis to increase patient engagement, patient adherence, and treatment, especially in chronic illnesses such as allergic rhinitis and asthma. Regulatory pathways are also very rigorous, particularly in the case of biologics and new therapies, which further increases the level of the R&D wall and make a moat around products that are differentiated.

In the meantime, the regional competitors in Asia-Pacific and Latin America are disrupting the conventional brand-veracious markets with low-cost-based generics and herbal substitutes. Another opportunity that companies are contending with is the increasing demand of consumers toward non-pharmaceutical solutions, and that is leading to strategic fitment of wellness and functional food industries. Following the changes in reimbursement patterns and the emerging paradigm of care individualization, flexibility and innovativeness become the core of competitive survival.

Key players in the allergy care industry include Johnson & Johnson Services, Inc., Sanofi Aventis USA LLC, Bayer AG, Spirit Pharmaceuticals LLC, Abbott, Merck & Co., Inc., GlaxoSmithKline plc, LETI Pharma, Genentech USA, Inc., ALK-Abelló A/S, and other notable companies.

Recent Development

  • In March 2025, a National Institutes of Health (NIH) clinical trial revealed that omalizumab is more effective than oral immunotherapy (OIT) in treating multi-food allergies. Participants receiving omalizumab tolerated higher amounts of allergens like peanuts, milk, and eggs compared to those undergoing OIT, which had higher dropout rates due to adverse reactions.
  • In February 2024, the USA Food and Drug Administration approved Xolair (omalizumab) for reducing allergic reactions, including anaphylaxis, in adults and children aged 1 year and older with IgE-mediated food allergies. This marks the first FDA-approved treatment to address multiple food allergies beyond peanut, such as milk, egg, and tree nuts. Patients must continue to avoid allergenic foods, as Xolair is not a cure but a preventive measure against accidental exposures.

Fact.MR has provided detailed information about the price points of key manufacturers in the Allergy Care Market, positioned across regions, including sales growth, production capacity, and speculative technological expansion, as recently published in the report.

Methodology and Industry Tracking Approach

In 2025, Fact. MR polled an estimated 3,780 registered stakeholders in the Allergy Care Market of different countries, amounting to 23. To guarantee the involvement of a minimum of 120 subject-matter experts in each of the countries, the survey was filled out by November 2020, including immunopathology gurus, biotech formulators, and digital health innovators. Vertical representation extended to wearable AI-based allergen detection, regional pollen forecasting, and OTC dish-sensing the adaptive diagnostics range within poly-allergic subjects.

The main tendencies of June 2024-May 2025 are multilingual teleconsultation centers addressing allergic diaspora, carbon-reducing antihistamine packs, and self-regulatory home filtration sets. Also, the rise of networks of allergy-safe products, which have been vetted by the community itself and locally-based micro-distributions of hypoallergenic products is transforming affordability and responsiveness.

Major investment booms were reported in immune-biotic R&D pipelines, subscription-based allergen alerts and open-source allergy severity scoring models, especially within East Asia and Central Europe, which are forecasted to be at the center of personalized allergy treatments by 2025.

Fact.MR, tracking this ecosystem since 2018, also highlights intersections in sensory-linked diagnostics, behavioral allergen avoidance systems, and scalable relief protocols adapting to real-time bioenvironmental inputs.

Segmentation of Allergy Care Market

  • By Type :

    • Eye Allergy
    • Skin Allergy
    • Food Allergy
    • Other Allergies
  • By Product Type :

    • Nasal Spray
    • Antihistamine Medication
    • Eye Drops
  • By Form :

    • Tablet/Gels/Pills
    • Sprays
    • Liquids
  • By Sales Channel :

    • Drug & Pharmacies Stores
    • Modern Trade
    • Departmental Stores
    • Institutional Sales
    • Monobrand Stores
    • Online Retailers
  • By Region :

    • North America
    • Latin America
    • Western Europe
    • Eastern Europe
    • East Asia
    • South Asia & Pacific
    • Middle East & Africa

Table of Content

  1. Executive Summary
    • Global Market Outlook
    • Demand-side Trends
    • Supply-side Trends
    • Technology Roadmap Analysis
    • Analysis and Recommendations
  2. Market Overview
    • Market Coverage / Taxonomy
    • Market Definition / Scope / Limitations
  3. Market Background
    • Market Dynamics
      • Drivers
      • Restraints
      • Opportunity
      • Trends
    • Scenario Forecast
      • Demand in Optimistic Scenario
      • Demand in Likely Scenario
      • Demand in Conservative Scenario
    • Opportunity Map Analysis
    • Product Life Cycle Analysis
    • Supply Chain Analysis
      • Supply Side Participants and their Roles
        • Producers
        • Mid-Level Participants (Traders/ Agents/ Brokers)
        • Wholesalers and Distributors
      • Value Added and Value Created at Node in the Supply Chain
      • List of Raw Material Suppliers
      • List of Existing and Potential Buyers
    • Investment Feasibility Matrix
    • Value Chain Analysis
      • Profit Margin Analysis
      • Wholesalers and Distributors
      • Retailers
    • PESTLE and Porter’s Analysis
    • Regulatory Landscape
      • By Key Regions
      • By Key Countries
    • Production and Consumption Statistics
    • Import and Export Statistics
  4. Global Market Analysis 2020 to 2024 and Forecast, 2025 to 2035
    • Historical Market Size Value (USD Mn) & Volume (Units) Analysis, 2020 to 2024
    • Current and Future Market Size Value (USD Mn) & Volume (Units) Projections, 2025 to 2035
      • Y-o-Y Growth Trend Analysis
      • Absolute $ Opportunity Analysis
  5. Global Market Pricing Analysis 2020 to 2024 and Forecast 2025 to 2035
  6. Global Market Analysis 2020 to 2024 and Forecast 2025 to 2035, By Type
    • Introduction / Key Findings
    • Historical Market Size Value (USD Mn) & Volume (Units) Analysis By Type, 2020 to 2024
    • Current and Future Market Size Value (USD Mn) & Volume (Units) Analysis and Forecast By Type, 2025 to 2035
      • Eye Allergy
      • Skin Allergy
      • Food Allergy
      • Other Allergies
    • Y-o-Y Growth Trend Analysis By Type, 2020 to 2024
    • Absolute $ Opportunity Analysis By Type, 2025 to 2035
  7. Global Market Analysis 2020 to 2024 and Forecast 2025 to 2035, By Product Type
    • Introduction / Key Findings
    • Historical Market Size Value (USD Mn) & Volume (Units) Analysis By Product Type, 2020 to 2024
    • Current and Future Market Size Value (USD Mn) & Volume (Units) Analysis and Forecast By Product Type, 2025 to 2035
      • Nasal Spray
      • Antihistamine Medication
      • Eye Drops
    • Y-o-Y Growth Trend Analysis By Product Type, 2020 to 2024
    • Absolute $ Opportunity Analysis By Product Type, 2025 to 2035
  8. Global Market Analysis 2020 to 2024 and Forecast 2025 to 2035, By Form
    • Introduction / Key Findings
    • Historical Market Size Value (USD Mn) & Volume (Units) Analysis By Form, 2020 to 2024
    • Current and Future Market Size Value (USD Mn) & Volume (Units) Analysis and Forecast By Form, 2025 to 2035
      • Tablet/Gels/Pills
      • Sprays
      • Liquids
    • Y-o-Y Growth Trend Analysis By Form, 2020 to 2024
    • Absolute $ Opportunity Analysis By Form, 2025 to 2035
  9. Global Market Analysis 2020 to 2024 and Forecast 2025 to 2035, By Sales Channel
    • Introduction / Key Findings
    • Historical Market Size Value (USD Mn) & Volume (Units) Analysis By Sales Channel, 2020 to 2024
    • Current and Future Market Size Value (USD Mn) & Volume (Units) Analysis and Forecast By Sales Channel, 2025 to 2035
      • Drug & Pharmacies Stores
      • Modern Trade
      • Departmental Stores
      • Institutional Sales
      • Monobrand Stores
      • Online Retailers
    • Y-o-Y Growth Trend Analysis By Sales Channel, 2020 to 2024
    • Absolute $ Opportunity Analysis By Sales Channel, 2025 to 2035
  10. Global Market Analysis 2020 to 2024 and Forecast 2025 to 2035, By Region
    • Introduction
    • Historical Market Size Value (USD Mn) & Volume (Units) Analysis By Region, 2020 to 2024
    • Current Market Size Value (USD Mn) & Volume (Units) Analysis and Forecast By Region, 2025 to 2035
      • North America
      • Latin America
      • Europe
      • East Asia
      • South Asia
      • Oceania
      • MEA
    • Market Attractiveness Analysis By Region
  11. North America Market Analysis 2020 to 2024 and Forecast 2025 to 2035, By Country
    • Historical Market Size Value (USD Mn) & Volume (Units) Trend Analysis By Market Taxonomy, 2020 to 2024
    • Market Size Value (USD Mn) & Volume (Units) Forecast By Market Taxonomy, 2025 to 2035
      • By Country
        • USA
        • Canada
      • By Type
      • By Product Type
      • By Form
      • By Sales Channel
    • Market Attractiveness Analysis
      • By Country
      • By Type
      • By Product Type
      • By Form
      • By Sales Channel
    • Key Takeaways
  12. Latin America Market Analysis 2020 to 2024 and Forecast 2025 to 2035, By Country
    • Historical Market Size Value (USD Mn) & Volume (Units) Trend Analysis By Market Taxonomy, 2020 to 2024
    • Market Size Value (USD Mn) & Volume (Units) Forecast By Market Taxonomy, 2025 to 2035
      • By Country
        • Brazil
        • Mexico
        • Argentina
        • Chile
        • Peru
        • Rest of Latin America
      • By Type
      • By Product Type
      • By Form
      • By Sales Channel
    • Market Attractiveness Analysis
      • By Country
      • By Type
      • By Product Type
      • By Form
      • By Sales Channel
    • Key Takeaways
  13. Europe Market Analysis 2020 to 2024 and Forecast 2025 to 2035, By Country
    • Historical Market Size Value (USD Mn) & Volume (Units) Trend Analysis By Market Taxonomy, 2020 to 2024
    • Market Size Value (USD Mn) & Volume (Units) Forecast By Market Taxonomy, 2025 to 2035
      • By Country
        • Germany
        • Italy
        • France
        • UK
        • Spain
        • Russia
        • BENELUX
        • Rest of Europe
      • By Type
      • By Product Type
      • By Form
      • By Sales Channel
    • Market Attractiveness Analysis
      • By Country
      • By Type
      • By Product Type
      • By Form
      • By Sales Channel
    • Key Takeaways
  14. East Asia Market Analysis 2020 to 2024 and Forecast 2025 to 2035, By Country
    • Historical Market Size Value (USD Mn) & Volume (Units) Trend Analysis By Market Taxonomy, 2020 to 2024
    • Market Size Value (USD Mn) & Volume (Units) Forecast By Market Taxonomy, 2025 to 2035
      • By Country
        • China
        • Japan
        • South Korea
      • By Type
      • By Product Type
      • By Form
      • By Sales Channel
    • Market Attractiveness Analysis
      • By Country
      • By Type
      • By Product Type
      • By Form
      • By Sales Channel
    • Key Takeaways
  15. South Asia Market Analysis 2020 to 2024 and Forecast 2025 to 2035, By Country
    • Historical Market Size Value (USD Mn) & Volume (Units) Trend Analysis By Market Taxonomy, 2020 to 2024
    • Market Size Value (USD Mn) & Volume (Units) Forecast By Market Taxonomy, 2025 to 2035
      • By Country
        • India
        • Thailand
        • Malaysia
        • Indonesia
        • Rest of South Asia
      • By Type
      • By Product Type
      • By Form
      • By Sales Channel
    • Market Attractiveness Analysis
      • By Country
      • By Type
      • By Product Type
      • By Form
      • By Sales Channel
    • Key Takeaways
  16. Oceania Market Analysis 2020 to 2024 and Forecast 2025 to 2035, By Country
    • Historical Market Size Value (USD Mn) & Volume (Units) Trend Analysis By Market Taxonomy, 2020 to 2024
    • Market Size Value (USD Mn) & Volume (Units) Forecast By Market Taxonomy, 2025 to 2035
      • By Country
        • Australia
        • New Zealand
      • By Type
      • By Product Type
      • By Form
      • By Sales Channel
    • Market Attractiveness Analysis
      • By Country
      • By Type
      • By Product Type
      • By Form
      • By Sales Channel
    • Key Takeaways
  17. MEA Market Analysis 2020 to 2024 and Forecast 2025 to 2035, By Country
    • Historical Market Size Value (USD Mn) & Volume (Units) Trend Analysis By Market Taxonomy, 2020 to 2024
    • Market Size Value (USD Mn) & Volume (Units) Forecast By Market Taxonomy, 2025 to 2035
      • By Country
        • GCC
        • Rest of MEA
      • By Type
      • By Product Type
      • By Form
      • By Sales Channel
    • Market Attractiveness Analysis
      • By Country
      • By Type
      • By Product Type
      • By Form
      • By Sales Channel
    • Key Takeaways
  18. Key Countries Market Analysis
    • Value (USD Mn) & Volume (Units)ed States
      • Pricing Analysis
      • Market Share Analysis, 2024
        • By Type
        • By Product Type
        • By Form
        • By Sales Channel
    • Germany
      • Pricing Analysis
      • Market Share Analysis, 2024
        • By Type
        • By Product Type
        • By Form
        • By Sales Channel
    • Japan
      • Pricing Analysis
      • Market Share Analysis, 2024
        • By Type
        • By Product Type
        • By Form
        • By Sales Channel
    • China
      • Pricing Analysis
      • Market Share Analysis, 2024
        • By Type
        • By Product Type
        • By Form
        • By Sales Channel
    • India
      • Pricing Analysis
      • Market Share Analysis, 2024
        • By Type
        • By Product Type
        • By Form
        • By Sales Channel
  19. Market Structure Analysis
    • Competition Dashboard
    • Competition Benchmarking
    • Market Share Analysis of Top Players
      • By Regional
      • By Type
      • By Product Type
      • By Form
      • By Sales Channel
  20. Competition Analysis
    • Competition Deep Dive
      • Johnson & Johnson Services, Inc.
        • Overview
        • Product Portfolio
        • Profitability by Market Segments (Product/Age /Sales Channel/Region)
        • Sales Footprint
        • Strategy Overview
          • Marketing Strategy
          • Product Strategy
          • Channel Strategy
      • Sanofi Aventis USA LLC
        • Overview
        • Product Portfolio
        • Profitability by Market Segments (Product/Age /Sales Channel/Region)
        • Sales Footprint
        • Strategy Overview
          • Marketing Strategy
          • Product Strategy
          • Channel Strategy
      • Bayer AG
        • Overview
        • Product Portfolio
        • Profitability by Market Segments (Product/Age /Sales Channel/Region)
        • Sales Footprint
        • Strategy Overview
          • Marketing Strategy
          • Product Strategy
          • Channel Strategy
      • Spirit Pharmaceuticals LLC
        • Overview
        • Product Portfolio
        • Profitability by Market Segments (Product/Age /Sales Channel/Region)
        • Sales Footprint
        • Strategy Overview
          • Marketing Strategy
          • Product Strategy
          • Channel Strategy
      • Abbott
        • Overview
        • Product Portfolio
        • Profitability by Market Segments (Product/Age /Sales Channel/Region)
        • Sales Footprint
        • Strategy Overview
          • Marketing Strategy
          • Product Strategy
          • Channel Strategy
      • Merck & Co. Inc.
        • Overview
        • Product Portfolio
        • Profitability by Market Segments (Product/Age /Sales Channel/Region)
        • Sales Footprint
        • Strategy Overview
          • Marketing Strategy
          • Product Strategy
          • Channel Strategy
      • GlaxoSmithKline plc
        • Overview
        • Product Portfolio
        • Profitability by Market Segments (Product/Age /Sales Channel/Region)
        • Sales Footprint
        • Strategy Overview
          • Marketing Strategy
          • Product Strategy
          • Channel Strategy
      • LETIPharma
        • Overview
        • Product Portfolio
        • Profitability by Market Segments (Product/Age /Sales Channel/Region)
        • Sales Footprint
        • Strategy Overview
          • Marketing Strategy
          • Product Strategy
          • Channel Strategy
      • Genentech USA, Inc.
        • Overview
        • Product Portfolio
        • Profitability by Market Segments (Product/Age /Sales Channel/Region)
        • Sales Footprint
        • Strategy Overview
          • Marketing Strategy
          • Product Strategy
          • Channel Strategy
      • ALK-Abelló A/S
        • Overview
        • Product Portfolio
        • Profitability by Market Segments (Product/Age /Sales Channel/Region)
        • Sales Footprint
        • Strategy Overview
          • Marketing Strategy
          • Product Strategy
          • Channel Strategy
  21. Assumptions & Acronyms Used
  22. Research Methodology

List Of Table

  • Table 1: Global Market Value (USD Mn) Forecast by Region, 2020 to 2035
  • Table 2: Global Market Volume (Units) Forecast by Region, 2020 to 2035
  • Table 3: Global Market Value (USD Mn) Forecast by Type, 2020 to 2035
  • Table 4: Global Market Volume (Units) Forecast by Type, 2020 to 2035
  • Table 5: Global Market Value (USD Mn) Forecast by Product Type, 2020 to 2035
  • Table 6: Global Market Volume (Units) Forecast by Product Type, 2020 to 2035
  • Table 7: Global Market Value (USD Mn) Forecast by Form, 2020 to 2035
  • Table 8: Global Market Volume (Units) Forecast by Form, 2020 to 2035
  • Table 9: Global Market Value (USD Mn) Forecast by Sales Channel, 2020 to 2035
  • Table 10: Global Market Volume (Units) Forecast by Sales Channel, 2020 to 2035
  • Table 11: North America Market Value (USD Mn) Forecast by Country, 2020 to 2035
  • Table 12: North America Market Volume (Units) Forecast by Country, 2020 to 2035
  • Table 13: North America Market Value (USD Mn) Forecast by Type, 2020 to 2035
  • Table 14: North America Market Volume (Units) Forecast by Type, 2020 to 2035
  • Table 15: North America Market Value (USD Mn) Forecast by Product Type, 2020 to 2035
  • Table 16: North America Market Volume (Units) Forecast by Product Type, 2020 to 2035
  • Table 17: North America Market Value (USD Mn) Forecast by Form, 2020 to 2035
  • Table 18: North America Market Volume (Units) Forecast by Form, 2020 to 2035
  • Table 19: North America Market Value (USD Mn) Forecast by Sales Channel, 2020 to 2035
  • Table 20: North America Market Volume (Units) Forecast by Sales Channel, 2020 to 2035
  • Table 21: Latin America Market Value (USD Mn) Forecast by Country, 2020 to 2035
  • Table 22: Latin America Market Volume (Units) Forecast by Country, 2020 to 2035
  • Table 23: Latin America Market Value (USD Mn) Forecast by Type, 2020 to 2035
  • Table 24: Latin America Market Volume (Units) Forecast by Type, 2020 to 2035
  • Table 25: Latin America Market Value (USD Mn) Forecast by Product Type, 2020 to 2035
  • Table 26: Latin America Market Volume (Units) Forecast by Product Type, 2020 to 2035
  • Table 27: Latin America Market Value (USD Mn) Forecast by Form, 2020 to 2035
  • Table 28: Latin America Market Volume (Units) Forecast by Form, 2020 to 2035
  • Table 29: Latin America Market Value (USD Mn) Forecast by Sales Channel, 2020 to 2035
  • Table 30: Latin America Market Volume (Units) Forecast by Sales Channel, 2020 to 2035
  • Table 31: Europe Market Value (USD Mn) Forecast by Country, 2020 to 2035
  • Table 32: Europe Market Volume (Units) Forecast by Country, 2020 to 2035
  • Table 33: Europe Market Value (USD Mn) Forecast by Type, 2020 to 2035
  • Table 34: Europe Market Volume (Units) Forecast by Type, 2020 to 2035
  • Table 35: Europe Market Value (USD Mn) Forecast by Product Type, 2020 to 2035
  • Table 36: Europe Market Volume (Units) Forecast by Product Type, 2020 to 2035
  • Table 37: Europe Market Value (USD Mn) Forecast by Form, 2020 to 2035
  • Table 38: Europe Market Volume (Units) Forecast by Form, 2020 to 2035
  • Table 39: Europe Market Value (USD Mn) Forecast by Sales Channel, 2020 to 2035
  • Table 40: Europe Market Volume (Units) Forecast by Sales Channel, 2020 to 2035
  • Table 41: East Asia Market Value (USD Mn) Forecast by Country, 2020 to 2035
  • Table 42: East Asia Market Volume (Units) Forecast by Country, 2020 to 2035
  • Table 43: East Asia Market Value (USD Mn) Forecast by Type, 2020 to 2035
  • Table 44: East Asia Market Volume (Units) Forecast by Type, 2020 to 2035
  • Table 45: East Asia Market Value (USD Mn) Forecast by Product Type, 2020 to 2035
  • Table 46: East Asia Market Volume (Units) Forecast by Product Type, 2020 to 2035
  • Table 47: East Asia Market Value (USD Mn) Forecast by Form, 2020 to 2035
  • Table 48: East Asia Market Volume (Units) Forecast by Form, 2020 to 2035
  • Table 49: East Asia Market Value (USD Mn) Forecast by Sales Channel, 2020 to 2035
  • Table 50: East Asia Market Volume (Units) Forecast by Sales Channel, 2020 to 2035
  • Table 51: South Asia Market Value (USD Mn) Forecast by Country, 2020 to 2035
  • Table 52: South Asia Market Volume (Units) Forecast by Country, 2020 to 2035
  • Table 53: South Asia Market Value (USD Mn) Forecast by Type, 2020 to 2035
  • Table 54: South Asia Market Volume (Units) Forecast by Type, 2020 to 2035
  • Table 55: South Asia Market Value (USD Mn) Forecast by Product Type, 2020 to 2035
  • Table 56: South Asia Market Volume (Units) Forecast by Product Type, 2020 to 2035
  • Table 57: South Asia Market Value (USD Mn) Forecast by Form, 2020 to 2035
  • Table 58: South Asia Market Volume (Units) Forecast by Form, 2020 to 2035
  • Table 59: South Asia Market Value (USD Mn) Forecast by Sales Channel, 2020 to 2035
  • Table 60: South Asia Market Volume (Units) Forecast by Sales Channel, 2020 to 2035
  • Table 61: Oceania Market Value (USD Mn) Forecast by Country, 2020 to 2035
  • Table 62: Oceania Market Volume (Units) Forecast by Country, 2020 to 2035
  • Table 63: Oceania Market Value (USD Mn) Forecast by Type, 2020 to 2035
  • Table 64: Oceania Market Volume (Units) Forecast by Type, 2020 to 2035
  • Table 65: Oceania Market Value (USD Mn) Forecast by Product Type, 2020 to 2035
  • Table 66: Oceania Market Volume (Units) Forecast by Product Type, 2020 to 2035
  • Table 67: Oceania Market Value (USD Mn) Forecast by Form, 2020 to 2035
  • Table 68: Oceania Market Volume (Units) Forecast by Form, 2020 to 2035
  • Table 69: Oceania Market Value (USD Mn) Forecast by Sales Channel, 2020 to 2035
  • Table 70: Oceania Market Volume (Units) Forecast by Sales Channel, 2020 to 2035
  • Table 71: MEA Market Value (USD Mn) Forecast by Country, 2020 to 2035
  • Table 72: MEA Market Volume (Units) Forecast by Country, 2020 to 2035
  • Table 73: MEA Market Value (USD Mn) Forecast by Type, 2020 to 2035
  • Table 74: MEA Market Volume (Units) Forecast by Type, 2020 to 2035
  • Table 75: MEA Market Value (USD Mn) Forecast by Product Type, 2020 to 2035
  • Table 76: MEA Market Volume (Units) Forecast by Product Type, 2020 to 2035
  • Table 77: MEA Market Value (USD Mn) Forecast by Form, 2020 to 2035
  • Table 78: MEA Market Volume (Units) Forecast by Form, 2020 to 2035
  • Table 79: MEA Market Value (USD Mn) Forecast by Sales Channel, 2020 to 2035
  • Table 80: MEA Market Volume (Units) Forecast by Sales Channel, 2020 to 2035

List Of Figures

  • Figure 1: Global Market Volume (Units) Forecast 2020 to 2035
  • Figure 2: Global Market Pricing Analysis
  • Figure 3: Global Market Value (USD Mn) Forecast 2020 to 2035
  • Figure 4: Global Market Value Share and BPS Analysis by Type, 2025 and 2035
  • Figure 5: Global Market Y-o-Y Growth Comparison by Type, 2025 to 2035
  • Figure 6: Global Market Attractiveness Analysis by Type
  • Figure 7: Global Market Value Share and BPS Analysis by Product Type, 2025 and 2035
  • Figure 8: Global Market Y-o-Y Growth Comparison by Product Type, 2025 to 2035
  • Figure 9: Global Market Attractiveness Analysis by Product Type
  • Figure 10: Global Market Value Share and BPS Analysis by Form, 2025 and 2035
  • Figure 11: Global Market Y-o-Y Growth Comparison by Form, 2025 to 2035
  • Figure 12: Global Market Attractiveness Analysis by Form
  • Figure 13: Global Market Value Share and BPS Analysis by Sales Channel, 2025 and 2035
  • Figure 14: Global Market Y-o-Y Growth Comparison by Sales Channel, 2025 to 2035
  • Figure 15: Global Market Attractiveness Analysis by Sales Channel
  • Figure 16: Global Market Value (USD Mn) Share and BPS Analysis by Region, 2025 and 2035
  • Figure 17: Global Market Y-o-Y Growth Comparison by Region, 2025 to 2035
  • Figure 18: Global Market Attractiveness Analysis by Region
  • Figure 19: North America Market Incremental $ Opportunity, 2025 to 2035
  • Figure 20: Latin America Market Incremental $ Opportunity, 2025 to 2035
  • Figure 21: Europe Market Incremental $ Opportunity, 2025 to 2035
  • Figure 22: East Asia Market Incremental $ Opportunity, 2025 to 2035
  • Figure 23: South Asia Market Incremental $ Opportunity, 2025 to 2035
  • Figure 24: Oceania Market Incremental $ Opportunity, 2025 to 2035
  • Figure 25: MEA Market Incremental $ Opportunity, 2025 to 2035
  • Figure 26: North America Market Value Share and BPS Analysis by Country, 2025 and 2035
  • Figure 27: North America Market Value Share and BPS Analysis by Type, 2025 and 2035
  • Figure 28: North America Market Y-o-Y Growth Comparison by Type, 2025 to 2035
  • Figure 29: North America Market Attractiveness Analysis by Type
  • Figure 30: North America Market Value Share and BPS Analysis by Product Type, 2025 and 2035
  • Figure 31: North America Market Y-o-Y Growth Comparison by Product Type, 2025 to 2035
  • Figure 32: North America Market Attractiveness Analysis by Product Type
  • Figure 33: North America Market Value Share and BPS Analysis by Form, 2025 and 2035
  • Figure 34: North America Market Y-o-Y Growth Comparison by Form, 2025 to 2035
  • Figure 35: North America Market Attractiveness Analysis by Form
  • Figure 36: North America Market Value Share and BPS Analysis by Sales Channel, 2025 and 2035
  • Figure 37: North America Market Y-o-Y Growth Comparison by Sales Channel, 2025 to 2035
  • Figure 38: North America Market Attractiveness Analysis by Sales Channel
  • Figure 39: Latin America Market Value Share and BPS Analysis by Country, 2025 and 2035
  • Figure 40: Latin America Market Value Share and BPS Analysis by Type, 2025 and 2035
  • Figure 41: Latin America Market Y-o-Y Growth Comparison by Type, 2025 to 2035
  • Figure 42: Latin America Market Attractiveness Analysis by Type
  • Figure 43: Latin America Market Value Share and BPS Analysis by Product Type, 2025 and 2035
  • Figure 44: Latin America Market Y-o-Y Growth Comparison by Product Type, 2025 to 2035
  • Figure 45: Latin America Market Attractiveness Analysis by Product Type
  • Figure 46: Latin America Market Value Share and BPS Analysis by Form, 2025 and 2035
  • Figure 47: Latin America Market Y-o-Y Growth Comparison by Form, 2025 to 2035
  • Figure 48: Latin America Market Attractiveness Analysis by Form
  • Figure 49: Latin America Market Value Share and BPS Analysis by Sales Channel, 2025 and 2035
  • Figure 50: Latin America Market Y-o-Y Growth Comparison by Sales Channel, 2025 to 2035
  • Figure 51: Latin America Market Attractiveness Analysis by Sales Channel
  • Figure 52: Europe Market Value Share and BPS Analysis by Country, 2025 and 2035
  • Figure 53: Europe Market Value Share and BPS Analysis by Type, 2025 and 2035
  • Figure 54: Europe Market Y-o-Y Growth Comparison by Type, 2025 to 2035
  • Figure 55: Europe Market Attractiveness Analysis by Type
  • Figure 56: Europe Market Value Share and BPS Analysis by Product Type, 2025 and 2035
  • Figure 57: Europe Market Y-o-Y Growth Comparison by Product Type, 2025 to 2035
  • Figure 58: Europe Market Attractiveness Analysis by Product Type
  • Figure 59: Europe Market Value Share and BPS Analysis by Form, 2025 and 2035
  • Figure 60: Europe Market Y-o-Y Growth Comparison by Form, 2025 to 2035
  • Figure 61: Europe Market Attractiveness Analysis by Form
  • Figure 62: Europe Market Value Share and BPS Analysis by Sales Channel, 2025 and 2035
  • Figure 63: Europe Market Y-o-Y Growth Comparison by Sales Channel, 2025 to 2035
  • Figure 64: Europe Market Attractiveness Analysis by Sales Channel
  • Figure 65: East Asia Market Value Share and BPS Analysis by Country, 2025 and 2035
  • Figure 66: East Asia Market Value Share and BPS Analysis by Type, 2025 and 2035
  • Figure 67: East Asia Market Y-o-Y Growth Comparison by Type, 2025 to 2035
  • Figure 68: East Asia Market Attractiveness Analysis by Type
  • Figure 69: East Asia Market Value Share and BPS Analysis by Product Type, 2025 and 2035
  • Figure 70: East Asia Market Y-o-Y Growth Comparison by Product Type, 2025 to 2035
  • Figure 71: East Asia Market Attractiveness Analysis by Product Type
  • Figure 72: East Asia Market Value Share and BPS Analysis by Form, 2025 and 2035
  • Figure 73: East Asia Market Y-o-Y Growth Comparison by Form, 2025 to 2035
  • Figure 74: East Asia Market Attractiveness Analysis by Form
  • Figure 75: East Asia Market Value Share and BPS Analysis by Sales Channel, 2025 and 2035
  • Figure 76: East Asia Market Y-o-Y Growth Comparison by Sales Channel, 2025 to 2035
  • Figure 77: East Asia Market Attractiveness Analysis by Sales Channel
  • Figure 78: South Asia Market Value Share and BPS Analysis by Country, 2025 and 2035
  • Figure 79: South Asia Market Value Share and BPS Analysis by Type, 2025 and 2035
  • Figure 80: South Asia Market Y-o-Y Growth Comparison by Type, 2025 to 2035
  • Figure 81: South Asia Market Attractiveness Analysis by Type
  • Figure 82: South Asia Market Value Share and BPS Analysis by Product Type, 2025 and 2035
  • Figure 83: South Asia Market Y-o-Y Growth Comparison by Product Type, 2025 to 2035
  • Figure 84: South Asia Market Attractiveness Analysis by Product Type
  • Figure 85: South Asia Market Value Share and BPS Analysis by Form, 2025 and 2035
  • Figure 86: South Asia Market Y-o-Y Growth Comparison by Form, 2025 to 2035
  • Figure 87: South Asia Market Attractiveness Analysis by Form
  • Figure 88: South Asia Market Value Share and BPS Analysis by Sales Channel, 2025 and 2035
  • Figure 89: South Asia Market Y-o-Y Growth Comparison by Sales Channel, 2025 to 2035
  • Figure 90: South Asia Market Attractiveness Analysis by Sales Channel
  • Figure 91: Oceania Market Value Share and BPS Analysis by Country, 2025 and 2035
  • Figure 92: Oceania Market Value Share and BPS Analysis by Type, 2025 and 2035
  • Figure 93: Oceania Market Y-o-Y Growth Comparison by Type, 2025 to 2035
  • Figure 94: Oceania Market Attractiveness Analysis by Type
  • Figure 95: Oceania Market Value Share and BPS Analysis by Product Type, 2025 and 2035
  • Figure 96: Oceania Market Y-o-Y Growth Comparison by Product Type, 2025 to 2035
  • Figure 97: Oceania Market Attractiveness Analysis by Product Type
  • Figure 98: Oceania Market Value Share and BPS Analysis by Form, 2025 and 2035
  • Figure 99: Oceania Market Y-o-Y Growth Comparison by Form, 2025 to 2035
  • Figure 100: Oceania Market Attractiveness Analysis by Form
  • Figure 101: Oceania Market Value Share and BPS Analysis by Sales Channel, 2025 and 2035
  • Figure 102: Oceania Market Y-o-Y Growth Comparison by Sales Channel, 2025 to 2035
  • Figure 103: Oceania Market Attractiveness Analysis by Sales Channel
  • Figure 104: MEA Market Value Share and BPS Analysis by Country, 2025 and 2035
  • Figure 105: MEA Market Value Share and BPS Analysis by Type, 2025 and 2035
  • Figure 106: MEA Market Y-o-Y Growth Comparison by Type, 2025 to 2035
  • Figure 107: MEA Market Attractiveness Analysis by Type
  • Figure 108: MEA Market Value Share and BPS Analysis by Product Type, 2025 and 2035
  • Figure 109: MEA Market Y-o-Y Growth Comparison by Product Type, 2025 to 2035
  • Figure 110: MEA Market Attractiveness Analysis by Product Type
  • Figure 111: MEA Market Value Share and BPS Analysis by Form, 2025 and 2035
  • Figure 112: MEA Market Y-o-Y Growth Comparison by Form, 2025 to 2035
  • Figure 113: MEA Market Attractiveness Analysis by Form
  • Figure 114: MEA Market Value Share and BPS Analysis by Sales Channel, 2025 and 2035
  • Figure 115: MEA Market Y-o-Y Growth Comparison by Sales Channel, 2025 to 2035
  • Figure 116: MEA Market Attractiveness Analysis by Sales Channel
  • Figure 117: Global Market - Tier Structure Analysis
  • Figure 118: Global Market - Company Share Analysis

- FAQs -

What was the global Allergy Care Market size reported by Fact.MR for 2025?

The Global Allergy Care Market was valued at USD 26,070 Million in 2025.

Who are the major players operating in the Allergy Care Market?

Prominent players in the market are Johnson & Johnson Services, Inc., Sanofi Aventis USA LLC, Bayer AG, Spirit Pharmaceuticals LLC, Abbott, Merck & Co. Inc., GlaxoSmithKline plc, LETIPharma, Genentech USA, Inc., and ALK-Abelló A/S.

What is the Estimated Valuation of the Allergy Care Market in 2035?

The market is expected to reach a valuation of USD 48,479 Million in 2035.

What value CAGR did the Allergy Care Market exhibit over the last five years?

The historic growth rate of the Allergy Care Market was 5.3% from 2020 to 2024.

- Also of Interest -

Skincare Consultation Platform Market

Skincare Consultation Platform Market Analysis, By Consultation Mode, By Skin Concern, By End-Use, By Platform Type and Region - Market Insights 2025 to 2035

Gun Care Product Market

Gun Care Product Market Study by Cleaning Rods, Brushes, Solvents, Lubricants, Wool/ Cotton Swabs, and Others for Individual, Security Agencies, Police Personals, and Others From 2024 to 2034

Lip Care Products Market

Lip Care Products Market Analysis by Lip Balms, Lip Butter, Lip Conditioners, and Lip Scrubs from 2023 to 2033

Sun-Care Wipes Market

Sun-Care Wipes Market Share, Size & Trends Analysis By SPF (SPF 4, SPF 15, SPF 30, SPF 50, SPF 50+), By Skin Type (Normal, Dry, Oily) & By Region - Global Insights 2021 to 2031

Allergy Care Market

Schedule a Call