- Market Value (2025): USD 1.8 Bn
- Estimated Value (2026): USD 2.2 Bn
- Forecast Value (2036): USD 17.8 Bn
- CAGR (2026-2036): 23.0%
What is the AI Logistics Orchestrators Market forecast to be worth by 2036?
USD 2.2 billion in 2026 to USD 17.8 billion by 2036 at a 23.0% CAGR.
- The AI logistics orchestrators market reached USD 1.8 billion in 2025.
- Demand is projected to increase from USD 2.2 billion in 2026 to USD 17.8 billion by 2036.
- The market is forecast to record a 23.0% CAGR from 2026 to 2036 as shippers, 3PLs and large retailers automate planning decisions across complex logistics networks.
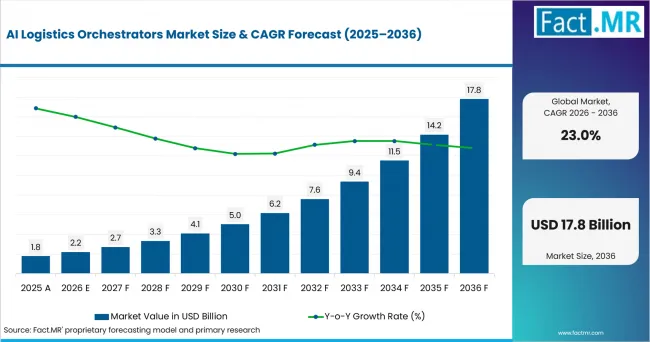
Ai Logistics Orchestrators Market Value Analysis | Source: Fact.MR
What are the defining numbers behind AI Logistics Orchestrators Market growth?
USD 15.5 billion absolute opportunity by 2036, led by software platforms, cloud deployment and large enterprises.
- Demand Drivers in the Market
- E-commerce order complexity is increasing the need for coordinated logistics decisions.
- Cloud-based logistics integration is strengthening adoption across distributed supply networks.
- AI agents are creating a faster route from planning insight to operational action.
- Cross-border transport and supplier visibility needs are supporting orchestration demand.
- Large enterprises are adopting orchestration platforms to reduce manual coordination across complex networks.
- Key Segments Analyzed
- By Offering: Software platform is projected to hold 37.0% share in 2026 because logistics teams need one execution layer for planning signals, exception alerts and workflow decisions.
- By Deployment: Cloud is anticipated to account for 46.0% share in 2026, supported by multi-site access and faster links with carrier, warehouse and commerce systems.
- By Capability: Forecasting is estimated to capture 41.0% share in 2026 since route, inventory and labor plans depend on earlier demand signals.
- By Customer: Large enterprise is forecast to represent 44.0% share in 2026 owing to wider supplier bases, larger order volumes and dedicated planning teams.
- Analyst Opinion at Fact.MR
- Shambhu Nath Jha, Principal Consultant at Fact.MR, states, “AI logistics orchestration is drawing attention because the decision layer is moving closer to daily execution. Demand is expected to rise where planning data, carrier constraints and warehouse status are reviewed in one workflow. Suppliers should combine explainable recommendations, connector depth and measurable service-level outcomes.”
- Strategic Implications
- Platform vendors should connect forecasting, order promising and transport execution so customers can respond before service failures reach the buyer.
- Cloud providers should document uptime and data residency controls.
- System integrators should build repeatable templates for carrier, ERP and warehouse connections so deployment work stays practical for enterprise accounts.
- Enterprise logistics teams should measure orchestration results through fill rate, dwell time, expedited freight cost and forecast error.
Japan is projected to post 28.6% CAGR through 2036, supported by e-commerce scale and logistics labor pressure. The USA is forecast to reach 26.1% CAGR, led by retail e-commerce volume and cross-border truck flow. The UK is anticipated to record 24.8% CAGR as supply-chain concerns push firms toward better data use. South Korea is estimated to advance at 23.9% CAGR, shaped by online shopping and small-business digitization. Germany is expected to hold 21.4% CAGR as cloud use and industrial logistics volumes support enterprise orchestration.
How does the AI Logistics Orchestrators Market break down by segment?
Software platform leads at 37.0%; cloud leads at 46.0%.
Which Offering leads?
Software platform holds 37.0% share in 2026.
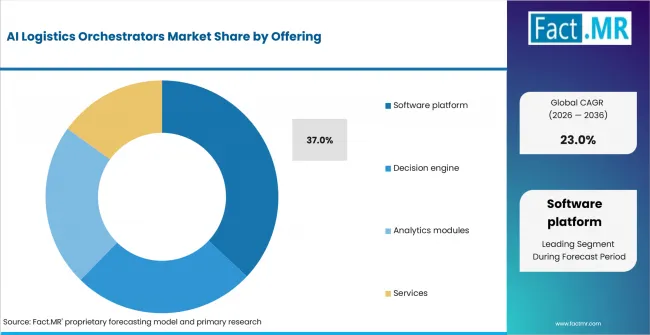
Ai Logistics Orchestrators Market Analysis By Offering | Source: Fact.MR
Software platforms lead because logistics orchestration works above several operating systems. The platform layer gathers demand forecasts, order status and carrier updates before recommending an action. U.S. Census Bureau analysis released on September 17, 2025 found that most businesses reported specialized software (58.9%) was “very important” to their processes or methods.
What leads the Deployment segment?
Cloud accounts for 46.0% share in 2026.
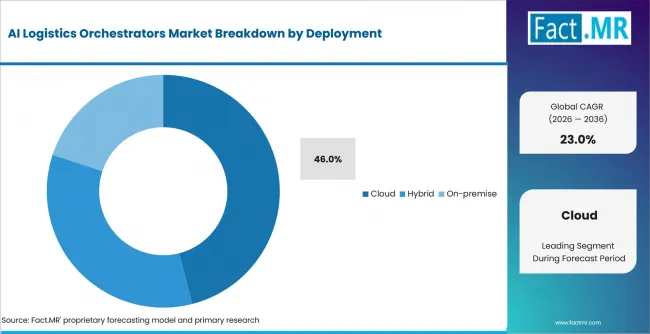
Ai Logistics Orchestrators Market Analysis By Deployment | Source: Fact.MR
Cloud deployment leads because logistics networks extend across plants, warehouses and external carriers. Hosted architecture helps teams add locations and partners without rebuilding each local connection. Destatis reported on November 24, 2025 that 54% of enterprises in Germany with at least 10 employees used paid cloud services in 2025.
How does Capability shape demand?
Forecasting captures 41.0% share in 2026.
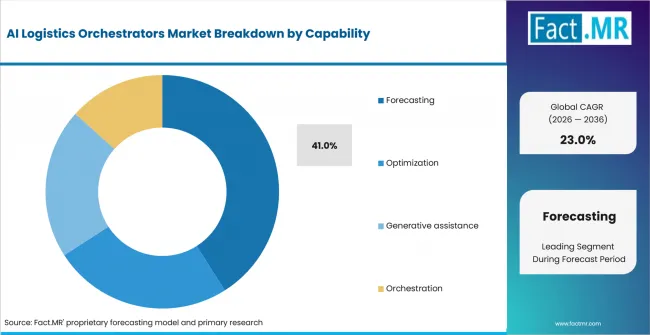
Ai Logistics Orchestrators Market Analysis By Capability | Source: Fact.MR
Forecasting leads because orchestration depends on the first signal about demand or service risk. Better forecasts guide labor, replenishment and transport allocation before exceptions become expensive. o9 Solutions announced specialized AI agents and self-learning models for its Digital Brain Platform in June 2025.
What supports Large enterprise within Customer?
Large enterprise represents 44.0% share in 2026.
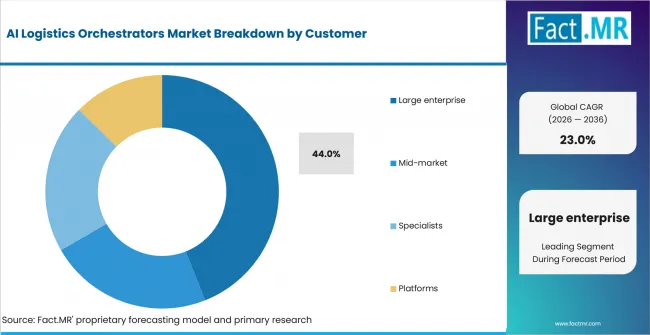
Ai Logistics Orchestrators Market Analysis By Customer | Source: Fact.MR
Large enterprises lead direct spending because they run more nodes across several order channels. Their logistics teams justify orchestration when one platform reduces manual follow-up across planning and transport. DSIT found in June 2026 that 57% of large UK AI-using businesses had AI integrated into existing systems.
What is accelerating AI Logistics Orchestrators Market adoption, and what is holding it back?
Demand is expected to rise through e-commerce scale, transport complexity and agentic supply-chain platforms.
Drivers Impact Analysis
| DRIVER | (~) % IMPACT ON CAGR | GEOGRAPHIC RELEVANCE | IMPACT TIMELINE |
|---|---|---|---|
| E-commerce order complexity and delivery promises | +2.4% | North America, East Asia | Short term (<= 2 years) |
| Cloud-based logistics and ERP integration | +1.8% | North America, Europe | Medium term (2-4 years) |
| AI agents for planning and exception response | +1.5% | Global | Medium term (2-4 years) |
| Cross-border transport and supplier visibility needs | +1.1% | USA, UK, Germany, Japan, South Korea | Long term (>= 4 years) |
- E-commerce order complexity and delivery promises: Higher online order volumes increase the delivery commitments that planners balance against stock, warehouse labor and carrier capacity.
- Cloud-based logistics and ERP integration: Cloud deployment allows multi-site users to connect carrier data, ERP records and warehouse events inside a shared workflow.
- AI agents for planning and exception response: Agentic tools are expected to scan constraints and recommend actions when orders, transport capacity or supplier commitments shift.
- Cross-border transport and supplier visibility needs: Border and supplier networks require earlier exception alerts when transport timing affects order promises.
Opportunity Impact Analysis
| OPPORTUNITY | (~) % IMPACT ON CAGR | GEOGRAPHIC RELEVANCE | IMPACT TIMELINE |
|---|---|---|---|
| Control towers with AI recommendation layers | +1.6% | Global | Medium term (2-4 years) |
| Generative assistance for planners and dispatchers | +1.2% | North America, Europe, East Asia | Short term (<= 2 years) |
| Mid-market packaged orchestration templates | +0.9% | USA, UK, South Korea | Long term (>= 4 years) |
- Control towers with AI recommendation layers: Logistics teams are expected to move from visibility dashboards to decision workflows when predicted risk links to a next action.
- Generative assistance for planners and dispatchers: Natural-language interfaces can shorten training time for users who need route, order and inventory answers quickly.
- Mid-market packaged orchestration templates: Smaller operators can adopt orchestration faster when vendors offer prebuilt workflows for order release, replenishment and transport exceptions.
Restraints Impact Analysis
| RESTRAINT | (~) % IMPACT ON CAGR | GEOGRAPHIC RELEVANCE | IMPACT TIMELINE |
|---|---|---|---|
| Data quality gaps across legacy systems | -0.8% | Global | Short term (<= 2 years) |
| Cybersecurity and data-sharing concerns | -0.6% | North America, Europe, East Asia | Medium term (2-4 years) |
| Change-management burden for planners | -0.5% | Global | Long term (>= 4 years) |
- Data quality gaps across legacy systems: Orchestration tools need clean item, order and carrier data before recommendations can be trusted in daily execution.
- Cybersecurity and data-sharing concerns: Shared logistics workflows expose partner data, which raises security review requirements before implementation.
- Change-management burden for planners: Teams that rely on spreadsheet routines need process redesign before automated recommendations become part of daily work.
Which countries are scaling the AI Logistics Orchestrators Market through 2036?
- The country comparison spans 7.2 percentage points between Japan and Germany across the forecast period.
- Japan remains 2.5 percentage points above the USA as e-commerce scale and logistics workforce pressure support orchestration demand.
- The USA remains 1.3 percentage points above the UK through e-commerce volume and cross-border truck-flow complexity.
- The UK remains 0.9 percentage point above South Korea as business data use and supply-chain risk concerns support adoption.
- South Korea remains 2.5 percentage points above Germany through online shopping scale and digital-tool adoption among small businesses.
- Germany closes the displayed range while cloud use and industrial freight activity sustain enterprise demand.
Comparable CAGRs create different entry conditions because e-commerce scale, transport intensity and AI maturity vary by country. Full report coverage includes North America, Latin America, Western Europe, Eastern Europe, East Asia, South Asia & Pacific, Middle East & Africa.
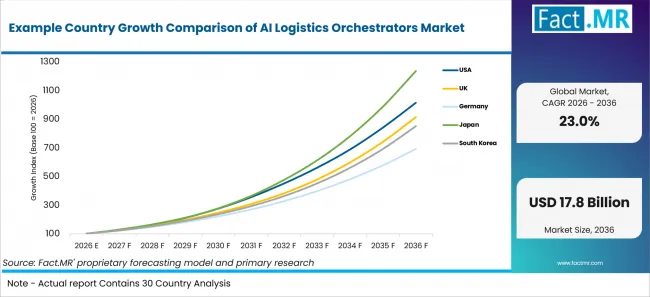
Example Country Growth Comparison Of Ai Logistics Orchestrators Market | Source: Fact.MR
| Country | CAGR (2026-2036) |
|---|---|
| Japan | 28.6% |
| USA | 26.1% |
| UK | 24.8% |
| South Korea | 23.9% |
| Germany | 21.4% |
What supports Japan adoption?
28.6% CAGR, supported by e-commerce scale and logistics labor pressure.
Japan’s retail and logistics teams are using digital commerce signals to plan order flow more tightly. METI reported in August 2025 that Japan’s domestic B-to-C e-commerce market reached JPY 26.1 trillion in 2024. MLIT reported on July 10, 2026, that average truck-driver binding time was 10 hours and 13 minutes per operation in its FY2025 survey.
What supports USA adoption?
26.1% CAGR, led by e-commerce volume and cross-border freight complexity.
U.S. shippers need orchestration where online order density meets border and carrier constraints. The U.S. Census Bureau reported on August 18, 2026 that retail e-commerce sales reached USD 340.2 billion in the second quarter of 2026. BTS reported on February 20, 2026 that Laredo handled 38.8% of all inbound trucks from Mexico in 2025.
What supports the UK outlook?
24.8% CAGR, backed by integrated AI use and road-freight coordination needs.
UK enterprise accounts are moving AI into operating systems that already manage logistics decisions. DSIT reported on June 18, 2026 that 21% of AI-using businesses had AI tools integrated into existing systems in 2025 to 2026. The Department for Transport reported on May 27, 2026 that Great Britain-registered HGVs moved 162 billion tonne kilometres in 2025.
How is South Korea scaling demand?
23.9% CAGR, shaped by online shopping and digital small-business adoption.
South Korea combines dense online retail activity with a growing base of digitally enabled small businesses. The Ministry of Data and Statistics reported in July 2026 that online shopping value reached KRW 25.0130 trillion in May 2026. MSS and SEMAS reported on March 13, 2026 that 27.2% of small businesses used digital and smart technologies in 2024.
What is supporting Germany’s adoption?
21.4% CAGR, supported by cloud use and industrial logistics volume.
Germany’s industrial companies already operate the cloud and ERP foundations needed for logistics orchestration. Destatis reported on November 24, 2025 that 54% of enterprises with at least 10 employees used paid cloud services in 2025. Destatis’s goods-transport table lists a provisional 3.3384 billion tonnes of road goods transport by German and foreign lorries in 2025.
Who leads the AI Logistics Orchestrators Market?
Blue Yonder Group, Inc. competes through planning, execution and its multi-enterprise network. Its May 2025 Cognitive Solutions launch added AI agents and a supply chain knowledge graph, supporting recommendation-led decision making and action across planning and execution workflows.
Kinaxis Inc. is active through Maestro, where Maestro Agents bring decision support directly into live planning environments. The October 2025 launch described these agents as context-aware, able to understand constraints and trade-offs, and designed to help planners move from issue to action.
o9 Solutions, SAP SE, Oracle Corporation and Manhattan Associates Inc. span enterprise planning, ERP-connected supply-chain applications and execution systems. SAP SE announced SAP SE Supply Chain Orchestration in October 2025, Oracle Corporation announced new supply-chain AI agents in February 2026, and Manhattan Associates Inc. unveiled Agentic AI support within Manhattan Active solutions in May 2025.
Which companies are the key providers?
Key companies include Blue Yonder Group, Inc.; Kinaxis Inc.; o9 Solutions; SAP SE; Oracle Corporation; and Manhattan Associates Inc.
- Blue Yonder Group, Inc.
- Kinaxis Inc.
- o9 Solutions
- SAP SE
- Oracle Corporation
- Manhattan Associates Inc.
Bibliography
- Blue Yonder. (2025, May 5). Blue Yonder transforms supply chain management with new AI agents and supply chain knowledge graph at ICON 2025.
- Bureau of Transportation Statistics. (2026, February 20). Border Crossing Data Annual Release: 2025.
- Department for Science, Innovation and Technology. (2026, June 18). UK Business Data Survey 2026. GOV.UK.
- Department for Transport. (2026, May 27). Road freight statistics: 2025. GOV.UK.
- Federal Statistical Office (Destatis). (2025, November 24). Jedes zweite Unternehmen nutzt kostenpflichtige Cloud-Services.
- Federal Statistical Office (Destatis). (2025, November 24). Reasons against the use of artificial intelligence technologies, by employment size class.
- Federal Statistical Office (Destatis). (2026, April 20). Goods transport: Transport, performance.
- Kinaxis Inc. (2025, October 17). Kinaxis accelerates agentic era for supply chain orchestration with the launch of Maestro Agents.
- Manhattan Associates, Inc. (2025, May 20). Manhattan Associates unveils agentic AI innovation at Momentum 2025.
- Ministry of Data and Statistics. (2026, July 1). Online shopping in May 2026.
- Ministry of Economy, Trade and Industry. (2025, August 26). Results of FY2024 E-Commerce Market Survey compiled.
- Ministry of SMEs and Startups. (2026, March 13). New survey offers detailed look at Korea’s small business landscape in 2024.
- o9 Solutions. (2025, June 3). o9 is raising the bar for enterprise planning and execution.
- Oracle. (2026, February 10). Oracle AI agents help supply chain leaders boost efficiency and strengthen resiliency.
This Report Addresses
- The report explains how AI logistics orchestrators are used across offering, deployment, capability and customer groups. Adjacent demand links to artificial intelligence supply chain systems.
- Segment analysis identifies the leading subsegments and the operating reasons enterprise accounts prioritize logistics automation in daily execution.
- Country analysis examines policy, e-commerce and transport mechanisms that support logistics AI co-pilot adoption.
- Competitive analysis reviews providers across planning, ERP-linked workflows, warehouse digital twin tools and execution orchestration.
- Application analysis assesses how service risk, inventory visibility and delivery commitments shape spending on supply resilience platforms and related decision layers.
What does the AI Logistics Orchestrators Market cover?
The AI Logistics Orchestrators Market covers software that coordinates supply-chain decisions across planning and execution. It includes platforms that combine demand signals, route constraints and exception alerts into recommended actions for logistics teams.
The assessment covers cloud, hybrid and on-premise deployment across forecasting, optimization, generative assistance and orchestration. Use cases link to omni-channel fulfillment, marketplace logistics orchestration and enterprise transport workflows.
What is included in the scope?
The scope includes licensed and subscription software that orchestrates logistics decisions using AI, rules engines or optimization models. It covers control-tower systems, planning overlays, execution recommendation tools and applications linked to terminal orchestration where logistics workflow decisions are a core function.
The scope also includes software modules that support order promising, replenishment planning, transport exception management, seasonal peak planning and B2B delivery scheduling when they provide AI-based orchestration.
What is excluded from the scope?
The scope excludes standalone warehouse hardware, vehicle telematics devices, basic route-planning tools and general ERP modules sold separately from logistics orchestration. It also excludes freight brokerage services unless a software product provides AI-based workflow coordination.
General business-intelligence dashboards fall outside the scope when they only report logistics status. Consulting-only projects are excluded unless they include a recurring software subscription that orchestrates logistics decisions.
How Was the Analysis Built?
The analysis draws on 120+ sources, 35+ company portfolios, 25+ countries, and more than 20 industry interviews.
- Primary Research: Primary research includes discussions with manufacturers, service providers, technology developers, distributors, end users, procurement teams, and subject-matter experts. These conversations examine purchasing priorities, product adoption, operational challenges, approval requirements, competitive positioning, and the factors that influence wider market acceptance.
- Desk Research: Desk research covers government statistics, regulatory publications, company filings, trade data, technical studies, industry associations, standards, public policy, and other authoritative sources. Every source used in the analysis is documented in the bibliography.
- Market Sizing and Forecasting: Market estimates combine historical performance, demand indicators, pricing and volume trends, segment shares, company participation, country-level growth, adoption patterns, investment activity, and barriers to market expansion.
- Data Validation and Update Cycle: Findings are validated by comparing primary interviews with public data, company activity, regulatory changes, trade patterns, and industry developments. Regular updates review new product launches, capacity changes, partnerships, approvals, procurement trends, and shifts in commercial adoption.
What is the report’s scope and coverage?
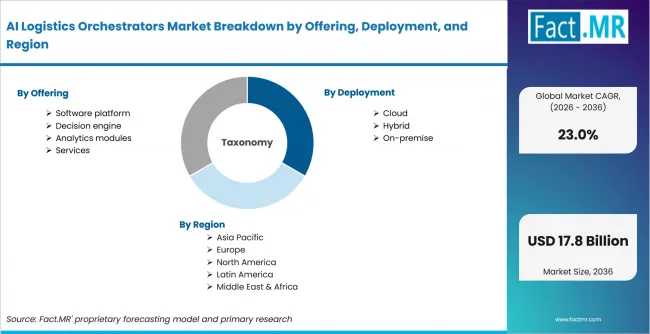
Ai Logistics Orchestrators Market Breakdown By Offering, Deployment, And Region | Source: Fact.MR
| Attribute | Details |
|---|---|
| Quantitative Units | USD billion |
| Market Definition | Software that uses AI to coordinate logistics planning, exception response, transport execution, inventory decisions and workflow recommendations across enterprise supply chains. |
| Offering | Software platform; Decision engine; Analytics modules; Services |
| Deployment | Cloud; Hybrid; On-premise |
| Capability | Forecasting; Optimization; Generative assistance; Orchestration |
| Customer | Large enterprise; Mid-market; Specialists; Platforms |
| Regions Covered | North America; Latin America; Western Europe; Eastern Europe; East Asia; South Asia & Pacific; Middle East & Africa |
| Countries Covered | United States; United Kingdom; Germany; Japan; South Korea |
| Key Companies Profiled | Blue Yonder Group, Inc.; Kinaxis Inc.; o9 Solutions; SAP SE; Oracle Corporation; Manhattan Associates Inc. |
| Forecast Period | 2026 to 2036 |
| Approach | Hybrid top-down and bottom-up approach using logistics software revenue, order-flow intensity, deployment mix, customer size, country adoption and provider portfolio review. |
How is the market segmented?
-
By Offering
- Software platform
- Decision engine
- Analytics modules
- Services
-
By Deployment
- Cloud
- Hybrid
- On-premise
-
By Capability
- Forecasting
- Optimization
- Generative assistance
- Orchestration
-
By Customer
- Large enterprise
- Mid-market
- Specialists
- Platforms
-
By Region
- North America
- Latin America
- Western Europe
- Eastern Europe
- East Asia
- South Asia & Pacific
- Middle East & Africa