- Market Value (2025): USD 215.5 Mn
- Estimated Value (2026): USD 250 Mn
- Forecast Value (2036): USD 1103 Mn
- CAGR (2026-2036): 16.0%
What is the Bio Marine Composites Market forecast to be worth by 2036?
USD 250 million in 2026 to USD 1103 million by 2036, at a 16.0% CAGR.
- The bio marine composites market crossed a valuation of USD 215.5 million in 2025.
- Demand is projected to increase from USD 250 million in 2026 to USD 1103 million by 2036.
- The market is forecast to record a 16.0% CAGR from 2026 to 2036 as shipyards and refit teams test lighter laminates in lower-risk parts first.
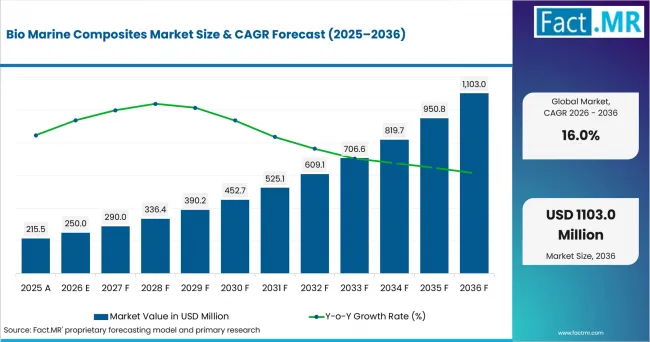
Bio Marine Composites Market Value Analysis | Source: Fact.MR
What are the defining numbers behind Bio Marine Composites Market growth?
USD 853 million absolute opportunity by 2036, led by Flax, Bio-epoxy and Interior panels.
- Demand Drivers in the Market
- Boatbuilders need lighter laminates that reduce part weight without forcing a complete tooling change in small hull and panel programs.
- Repair yards need drop-in resin and fiber systems because refit work favors materials that can use familiar layup and curing routines.
- Vessel owners need lower-petrochemical material options where passenger cabins and leisure decks make finish quality visible to customers.
- Composite engineers need marine-grade test data as natural fibers must prove moisture stability before wider exterior use.
- Key Segments Analyzed
- By Reinforcement: Flax is expected to hold 36.0% share in 2026, supported by stiffness-to-weight advantages and maturing flax fiber supply for visible panels.
- By Matrix: Bio-epoxy is projected to account for 45.0% share in 2026 owing to familiar processing and compatibility with established epoxy resin systems.
- By Part: Interior panels are anticipated to capture 44.0% share in 2026, reinforced by lower structural risk and easier owner acceptance.
- By Vessel: Leisure boats are estimated to represent 31.0% share in 2026 because premium builders can test bio-composite finishes before workboat fleets adopt them.
- Analyst Opinion at Fact.MR
- Shambhu Nath Jha, Principal Consultant at Fact.MR, states, “Bio marine composites are moving through a qualification bottleneck, not a simple material swap. Demand is expected to concentrate first in panels, leisure craft and replaceable parts where performance evidence is easier to gather. Suppliers need to pair marine-grade testing with clear resin chemistry and repeatable processing support.”
- Strategic Implications
- Material suppliers should document saltwater exposure and fatigue performance so yards can compare bio-based laminates with established polymer composite systems.
- Resin formulators should link bio-carbon content to curing behavior because marine yards need practical evidence before changing shop routines.
- Boatbuilders should test panels under recognized composites testing services before moving bio-composites into decks or appendages.
- Investors should separate visible-panel adoption from structural-hull approval since the second path needs longer validation and higher liability coverage.
Germany is forecast to record 19.5% CAGR through 2036, supported by port-linked vessel activity and engineering-led material substitution. The USA is projected to post 17.3% CAGR as recreational boating scale gives suppliers a broad base for panels and refit parts. Japan is anticipated to reach 15.8% CAGR, owing to cruise recovery and local FRP vessel tracking. South Korea is estimated to advance at 12.6% CAGR because harbor fleets and marina monitoring create targeted trial routes. The UK is expected to register 11.7% CAGR due to passenger-route demand and selective decarbonisation reviews.
How does the Bio Marine Composites Market break down by segment?
Flax leads Reinforcement at 36.0%; Bio-epoxy leads Matrix at 45.0%.
Which reinforcement dominates?
Flax is expected to hold 36.0% share in 2026.
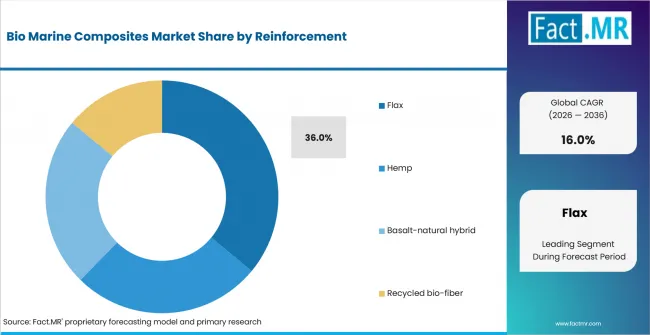
Bio Marine Composites Market Analysis By Reinforcement | Source: Fact.MR
Flax leads reinforcement demand because it combines low density with a finish that premium marine interiors can display without heavy paint layers. BMW Group said in June 2025 that natural-fiber composites developed with Bcomp had reached series maturity for automotive applications.
What leads the Matrix segment?
Bio-epoxy is projected to account for 45.0% share in 2026.
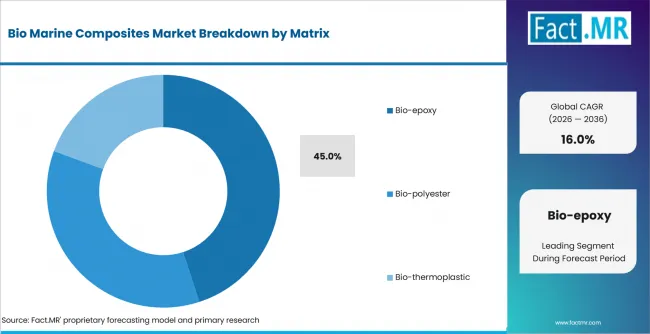
Bio Marine Composites Market Analysis By Matrix | Source: Fact.MR
Bio-epoxy leads because boatyards already understand epoxy handling and post-cure behavior in structural and semi-structural laminates. Sicomin’s SR GreenPoxy 550 provides a direct marine example of a bio-based epoxy used for bonding and laminating timber-and-fibre composites.
How does Part shape demand?
Interior panels are anticipated to capture 44.0% share in 2026.
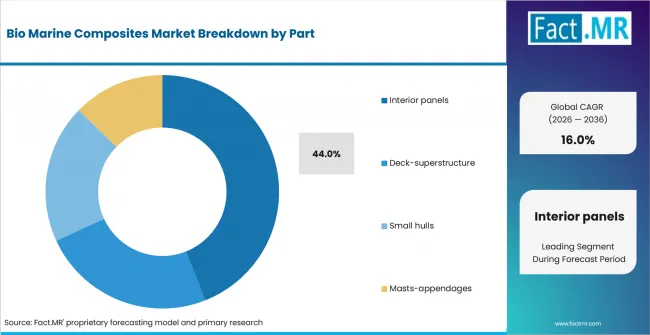
Bio Marine Composites Market Analysis By Part | Source: Fact.MR
Interior panels lead because they deliver weight reduction while carrying lower structural exposure than hull skins or appendages. This makes them practical for early bio-composite adoption in cabins and passenger areas, where manufacturers can validate appearance, durability, fire performance and installation requirements before broader use.
What supports Leisure boats within Vessel?
Leisure boats are estimated to represent 31.0% share in 2026.
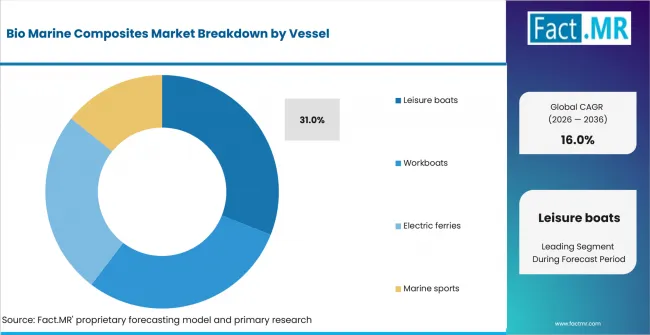
Bio Marine Composites Market Analysis By Vessel | Source: Fact.MR
Leisure boats lead because private owners and premium yards evaluate visible surfaces, weight and brand story alongside service life. The U.S. Coast Guard reported 11,674,073 registered recreational vessels in 2024. Structural substitution remains slower than cabin and deck trials.
What is accelerating Bio Marine Composites Market adoption, and what is holding it back?
Demand is expected to rise through lightweighting and bio-resin validation; growth is constrained by certification cost and moisture durability.
Drivers Impact Analysis
| DRIVER | (~) % IMPACT ON CAGR |
GEOGRAPHIC RELEVANCE |
IMPACT TIMELINE |
|---|---|---|---|
| Leisure craft panels and visible interiors | +1.9% | North America, Europe | Short term (<= 2 years) |
| Bio-epoxy formulations for marine laminates | +1.5% | Europe, East Asia | Medium term (2-4 years) |
| Lightweight parts for electric ferries and workboats | +1.2% | East Asia, Western Europe | Medium term (2-4 years) |
| Refit demand for replaceable composite parts | +0.8% | Global | Long term (>= 4 years) |
Source: Fact.MR analysis. Updated Aug 24, 2026
- Leisure craft panels and visible interiors: Premium builders are expected to approve bio-composites first where finish quality and lower part weight can be evaluated without primary-hull risk.
- Bio-epoxy formulations for marine laminates: Sicomin launched SR GreenPoxy 550 in October 2025, a bio-based epoxy system engineered for bonding and laminating timber-and-fibre composites, with the resin already integrated into racing-yacht construction by the Kaori Concept boatyard.
- Lightweight parts for electric ferries and workboats: Battery weight is expected to push designers toward lighter panels and deck components where qualification limits are manageable.
Opportunity Impact Analysis
| OPPORTUNITY | (~) % IMPACT ON CAGR |
GEOGRAPHIC RELEVANCE |
IMPACT TIMELINE |
|---|---|---|---|
| Natural-fiber cabin packages for premium boats | +1.3% | North America, Europe | Short term (<= 2 years) |
| Bio-epoxy repair kits for refit yards | +1.0% | Global | Medium term (2-4 years) |
| Hybrid basalt-natural reinforcement in small hulls | +0.7% | East Asia, Europe | Long term (>= 4 years) |
Source: Fact.MR analysis. Updated Aug 24, 2026
- Natural-fiber cabin packages for premium boats: Interior packages create a route for bio-composites that limits water exposure and lets owners see the material difference.
- Bio-epoxy repair kits for refit yards: Suppliers can use epoxy adhesive systems and matched fabrics to reduce mixing risk for smaller yards.
- Hybrid basalt-natural reinforcement in small hulls: Hybrid designs can improve impact behavior while keeping natural-fiber content visible in closed molding processes.
Restraints Impact Analysis
| RESTRAINT | (~) % IMPACT ON CAGR |
GEOGRAPHIC RELEVANCE |
IMPACT TIMELINE |
|---|---|---|---|
| Moisture absorption and laminate aging risk | -0.8% | Global | Short term (<= 2 years) |
| Certification cost for exposed structural parts | -0.6% | Europe, North America | Medium term (2-4 years) |
| Small-batch material cost versus fiberglass | -0.4% | Global | Long term (>= 4 years) |
Source: Fact.MR analysis. Updated Aug 24, 2026
- Moisture absorption and laminate aging risk: Natural fibers need marine aging evidence before they can replace conventional glass fiber in exposed decks or appendages.
- Certification cost for exposed structural parts: Fire, impact and fatigue testing raises approval cost when a bio-composite moves beyond interior panels.
- Small-batch material cost versus fiberglass: Conventional fiberglass remains cheaper in many boatyards, so bio-composite suppliers must justify cost through weight or finish gains.
Which countries are scaling the Bio Marine Composites Market through 2036?
- The country comparison spans 7.8 percentage points and forms three practical growth bands across the forecast period.
- Germany remains 2.2 percentage points above the USA through port-linked vessel activity and engineering-led material substitution.
- The USA remains 1.5 percentage points above Japan as recreational boating scale keeps small-craft material trials visible.
- Japan remains 3.2 percentage points above South Korea through cruise recovery and local FRP vessel production tracking.
- South Korea remains 0.9 percentage point above the UK through port throughput and marina-sector monitoring.
- The UK closes the displayed range through passenger-route demand and decarbonisation review pathways.
Comparable CAGRs can create different entry conditions due to boatbuilding scale, port activity, leisure-craft demand and material certification. Full report coverage includes North America, Latin America, Western Europe, Eastern Europe, East Asia, South Asia & Pacific, Middle East & Africa.
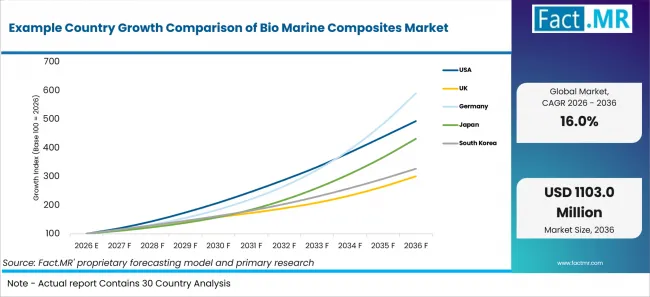
Example Country Growth Comparison Of Bio Marine Composites Market | Source: Fact.MR
| Country | CAGR (2026-2036) |
|---|---|
| Germany | 19.5% |
| USA | 17.3% |
| Japan | 15.8% |
| South Korea | 12.6% |
| UK | 11.7% |
Source: Fact.MR analysis. Updated Aug 24, 2026
What supports Germany adoption?
19.5% CAGR through 2036, supported by port-linked vessel activity and engineering-led material substitution.
Germany’s growth is supported by strong seaport activity and an engineering base capable of evaluating alternative marine materials. Destatis reported that German seaports handled 284.4 million tonnes of goods in 2025, up 3.8% from 2024. This activity provides a broad operating base for vessel construction, maintenance and material qualification.
What supports USA adoption?
17.3% CAGR through 2036, led by recreational boating volume and refit activity.
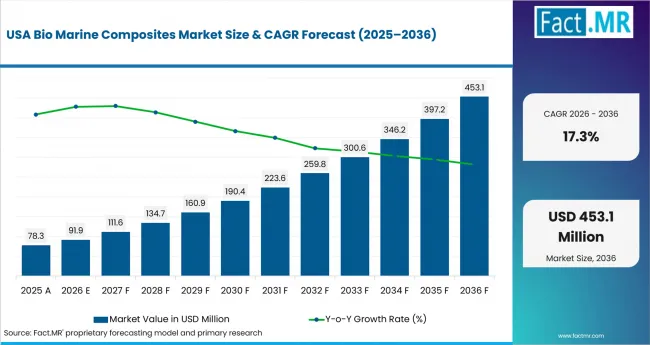
Bio Marine Composites Market Country Value Analysis | Source: Fact.MR
The USA’s growth reflects a large recreational boating base and continued demand for vessel maintenance and refurbishment. The U.S. Coast Guard recorded 3,887 recreational boating incidents and approximately USD 88 million in property damage in 2024.
How does Japan perform?
15.8% CAGR through 2036, driven by cruise recovery and local vessel production tracking.
Japan’s growth is supported by recovering cruise activity and a marine manufacturing ecosystem that values controlled material qualification. MLIT reported provisional 2025 figures of 1.767 million inbound cruise passengers and 3,117 cruise-ship port calls. Rising cruise traffic can support refurbishment and interior-material demand across passenger vessels.
How is South Korea scaling demand?
12.6% CAGR through 2036, backed by port throughput and marina-sector monitoring.
South Korea’s growth reflects substantial port activity and a large marine industrial base. The Ministry of Oceans and Fisheries reported that Korean trade ports handled 1.57101 billion tonnes of cargo in 2025, down 0.9% from 2024, while container throughput increased 1.2%. This operating scale supports shipbuilding, repair and marine-equipment demand where alternative materials can be evaluated.
What supports the UK’s growth?
11.7% CAGR through 2036, driven by passenger routes and decarbonisation review pathways.
The UK’s growth is supported by active domestic passenger shipping and growing attention to lower-emission marine operations. The Department for Transport reported that domestic sea passenger numbers increased 2% from 38.3 million in 2024 to 39.2 million in 2025. Ferry and passenger-vessel operators provide potential routes for lightweight cabin, panel and interior material trials where durability and sustainability can be demonstrated.
Who leads the Bio Marine Composites Market?
Bcomp Ltd. is profiled for flax-composite capability through ampliTex and powerRibs technologies. BMW Group reported in June 2025 that natural-fiber composites developed in collaboration with Bcomp had reached series maturity for use in future series-production vehicle models.
Sicomin launched SR GreenPoxy 550 in October 2025, a bio-based epoxy system engineered for bonding and lamination of timber-and-fibre composites, with applications including offshore racing-yacht construction. Arkema reported in February 2026 that a boat-hull component and a speed board manufactured with Elium® resins would be showcased at JEC World 2026 to demonstrate progress in composite circularity.
Competition is expected to depend on test data, marine approvals and processing support. Suppliers that can connect bio-resin chemistry with broader biocomposites sourcing and boatyard handling are better placed for early panel programs.
Which companies are the key providers?
Key companies include Bcomp Ltd., Gurit Holding AG, Sicomin Epoxy Systems, Arkema S.A.
- Bcomp Ltd.
- Gurit Holding AG
- Sicomin Epoxy Systems
- Arkema S.A.
Bibliography
- Arkema. (2026, February 24). Arkema at JEC World 2026: Lighter, more efficient, and sustainable innovations in specialty materials.
- BMW Group. (2025, June 17). Ready for series production: BMW Group achieves major breakthrough with utilization of natural fiber composites.
- Department for Transport. (2026, July 29). Sea Passenger Statistics: Domestic sea passengers 2025.
- Federal Statistical Office (Destatis). (2026, March 10). Seeverkehr 2025: Güterumschlag steigt um 3,8 % gegenüber dem Vorjahr [Sea transport 2025: Cargo handling rises by 3.8% year on year].
- Gurit Holding AG. (2025, September 1). Gurit announces multi-year contract to subsea sector.
- Sicomin. (2025, October 27). Sicomin unveils bio-based SR GreenPoxy 550 wood coating resin system enabling high-performance sustainable raceboat construction.
- U.S. Coast Guard. (2025, June 24). Recreational Boating Statistics 2024 (COMDTPUB P16754.38).
- U.S. Coast Guard. (2025, July 1). Coast Guard reports fewest boating fatalities in more than 50 years.
This Report Answers
- The report explains where bio marine composites are used across reinforcement, matrix, part and vessel categories.
- Segment analysis identifies the leading subsegments and the practical reasons boatbuilders approve them first.
- Country analysis examines the listed markets and the marine activity supporting trial routes for bio-composite parts.
- Competitive analysis reviews current providers across flax reinforcement, bio-epoxy chemistry, core materials and natural-fiber panels.
- Application analysis considers how moisture exposure, part criticality and vessel type influence purchase decisions.
What does the Bio Marine Composites Market cover?
The Bio Marine Composites Market covers natural-fiber and bio-resin composite materials used in boat and vessel parts. It includes flax, hemp, hybrid reinforcements and recycled bio-fiber when these materials are paired with marine-suitable resin systems. Adjacent agrifiber product streams are included only when they feed marine composite supply chains.
The assessment covers interior panels, deck-superstructure parts, small hulls and masts or appendages across leisure boats, workboats, electric ferries and marine sports. Demand is assessed by material fit, processing route and country-level adoption conditions.
What is included in the scope?
The scope includes bio-epoxy, bio-polyester and bio-thermoplastic matrix systems used with natural or recycled reinforcements in marine parts. It includes materials sold as laminates, fabrics, resin systems, panels and engineered composite inputs for boatbuilding or refit work.
It includes commercial composite materials used by shipyards, repair yards, specialist boatbuilders and component suppliers. The scope also covers supplier support tied to testing, processing and part qualification.
What is excluded from the scope?
The scope excludes conventional fiberglass sold without bio-based reinforcement or resin content. It also excludes raw agricultural fiber that has not been processed for composite reinforcement use.
Carbon fiber composites are excluded unless they are part of a bio-based hybrid system. General marine coatings, adhesives sold without composite material use and unrelated construction biocomposites are outside the market boundary.
How Was the Analysis Built?
The analysis draws on 120+ sources, 35+ company portfolios, 25+ countries, and more than 20 industry interviews.
- Primary Research: Primary research includes discussions with manufacturers, material suppliers, boatbuilders, repair yards, distributors, procurement teams and subject-matter experts. These conversations examine purchasing priorities, product adoption, operational barriers, approval requirements and wider market acceptance.
- Desk Research: Desk research covers government statistics, regulatory publications, company filings, technical studies, industry associations, standards and public policy. Selected public evidence sources cited in the analysis are documented in the bibliography.
- Market Sizing and Forecasting: Market estimates combine historical performance, demand indicators, pricing and volume trends, segment shares, company participation, country-level growth and barriers to market expansion.
- Data Validation and Update Cycle: Findings are validated by comparing primary interviews with public data, company activity, regulatory changes and industry developments. Regular updates review launches, capacity changes, partnerships, approvals and shifts in commercial adoption.
Segmentation
What is the report’s scope and coverage?
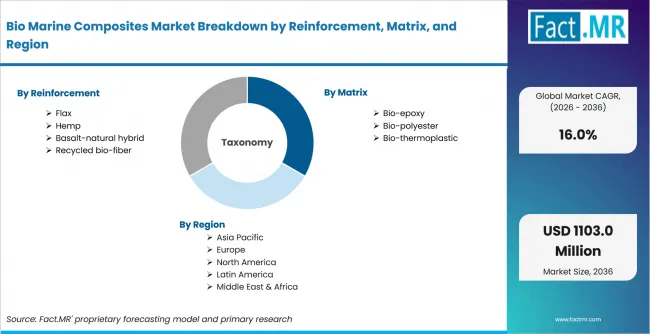
Bio Marine Composites Market Breakdown By Reinforcement, Matrix, And Region | Source: Fact.MR
| Attribute | Details |
|---|---|
| Quantitative Units | USD million in 2026 to USD million by 2036 at a CAGR |
| Market Definition | Bio marine composites are natural-fiber, bio-resin and recycled bio-fiber composite materials used in marine interiors, deck-superstructure parts, small hulls, masts, appendages and selected vessel components. |
| Reinforcement | Flax; Hemp; Basalt-natural hybrid; Recycled bio-fiber |
| Matrix | Bio-epoxy; Bio-polyester; Bio-thermoplastic |
| Part | Interior panels; Deck-superstructure; Small hulls; Masts-appendages |
| Vessel | Leisure boats; Workboats; Electric ferries; Marine sports |
| Regions Covered | North America; Latin America; Western Europe; Eastern Europe; East Asia; South Asia & Pacific; Middle East & Africa |
| Countries Covered | USA; UK; Germany; Japan; South Korea |
| Key Companies Profiled | Bcomp Ltd., Gurit Holding AG, Sicomin Epoxy Systems, Arkema S.A. |
| Forecast Period | 2026 to 2036 |
| Approach | Hybrid top-down and bottom-up approach using marine vessel activity, material qualification routes, segment adoption, country growth and provider portfolio review. |
Source: Fact.MR analysis. Updated Aug 24, 2026
How is the market segmented?
-
By Reinforcement:
- Flax
- Hemp
- Basalt-natural hybrid
- Recycled bio-fiber
-
By Matrix:
- Bio-epoxy
- Bio-polyester
- Bio-thermoplastic
-
By Part:
- Interior panels
- Deck-superstructure
- Small hulls
- Masts-appendages
-
By Vessel:
- Leisure boats
- Workboats
- Electric ferries
- Marine sports
-
By Region:
- North America
- Latin America
- Western Europe
- Eastern Europe
- East Asia
- South Asia & Pacific
- Middle East & Africa
Frequently Asked Questions
How big is the bio marine composites market in 2026?
What is the CAGR of the bio marine composites market from 2026 to 2036?
Which reinforcement leads the bio marine composites market?
Which matrix leads the bio marine composites market?
Who are the leading companies in the bio marine composites market?
Who worked on this report


Preview the report firsthand - request a free sample
Free SampleGet the brochure for pricing and purchase details
Download PDF