- Market Value (2025): USD 209.0 Bn
- Estimated Value (2026): USD 224.7 Bn
- Forecast Value (2036): USD 463.1 Bn
- CAGR (2026-2036): 7.5%
What is the Carbon Neutral Fuels Market forecast to be worth by 2036?
USD 224.7 billion in 2026 to USD 463.1 billion by 2036, at a 7.5% CAGR.
The fuel-substitution case should be read with Fact.MR's Biofuels Market, since carbon neutral fuel adoption starts with feedstock availability and blending economics.
- The carbon neutral fuels market reached USD 209.0 billion in 2025 as fuel producers and policy teams spent against a clear use case: lower-carbon liquid and gaseous fuels that can be blended, certified, supplied and contracted into existing transport and industrial fuel systems.
- Demand is projected to increase from USD 224.7 billion in 2026 to USD 463.1 billion by 2036, at a 7.5% CAGR.
- The market is forecast to record a 7.5% CAGR from 2026 to 2036. Demand depends on certified lower-carbon liquid and gaseous fuels that can move through existing transport and industrial fuel systems.
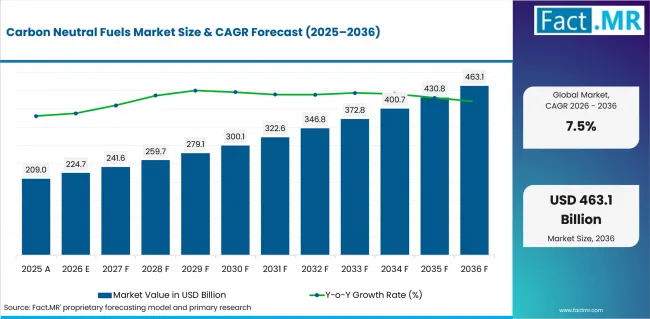
Carbon Neutral Fuels Market Value Analysis | Source: Fact.MR
What are the defining numbers behind Carbon Neutral Fuels Market growth?
USD 238.4 billion absolute opportunity is expected by 2036.
Heating demand connects with Fact.MR's Renewable Heating Fuels Market, where buyers judge fuel change by equipment fit and delivered energy cost.
- Demand Drivers in the Market
- Biofuels lead as they are already blended into road transport, aviation trials, marine fuel programs and industrial fuel pools. The segment has a clearer route to volume than many synthetic fuels because feedstock collection, conversion assets and distribution rules already exist.
- Transportation leads because liquid fuels are hardest to replace in aviation, heavy-duty vehicles, marine applications and long-distance mobility. Carbon-neutral fuel demand therefore concentrates.
- Automotive remains the largest end-use block because bioethanol, biodiesel, renewable diesel and low-carbon blends can move through established vehicle and fuel-distribution systems.
- Direct fuel supply contracts lead as large buyers need volume assurance, carbon-intensity documentation, offtake terms and compliance evidence. Spot purchasing cannot carry the same decarbonization claim.
- Key Segments Analyzed
- By Product Type: Biofuels is projected to hold 39.2% share in 2026. Biofuels lead as they have the most mature production base, blending rules and downstream handling knowledge among carbon-neutral fuel options.
- By End Use: Automotive is projected to hold 30.0% share in 2026. Automotive leads because road-fuel blending and renewable diesel use already give companies a high-volume route to demand.
- By Distribution Channel: Direct Fuel Supply Contracts is projected to hold 30.3% share in 2026. Direct fuel supply contracts lead as customers need traceability, audited emissions attributes and dependable volumes tied to their own climate targets.
- By Feedstock: Biomass and Organic Waste is projected to hold 33.8% share in 2026. Biomass and organic waste lead as they connect fuel production to available agricultural residues, municipal waste, used oils and other lower-carbon feedstock streams.
- Analyst Opinion at Fact.MR
- Shambhu Nath Jha, Sr. Consultant at Fact.MR, opines, "Carbon-neutral fuel demand is strongest where the buyer can use the fuel now and defend the emissions claim later. The market will reward companies that control feedstock, certification and offtake discipline, not those that sell decarbonization language alone."
- Strategic Implications
- Fuel companies should sell verified carbon intensity, feedstock origin and delivery assurance with the fuel contract.
- Refiners should prioritize drop-in fuels where existing tanks, pipelines and fleet assets can be used with minimal operational disruption.
- Corporate buyers should separate fuel availability from climate-claim eligibility because both decide whether procurement can scale.
USA records the highest listed country CAGR at 9.79% from 2026 to 2036; other key markets include Japan, Germany, UK, Canada, Brazil and Australia.
How does the Carbon Neutral Fuels Market break down by segment?
Biofuels leads Product Type at 39.2%.
Hydrogen pathways should be compared with Fact.MR's Green Hydrogen Market, because low-carbon supply depends on power cost and offtake certainty.
Why does Biofuels lead Product Type?
Biofuels is projected to account for 39.2% share in 2026.
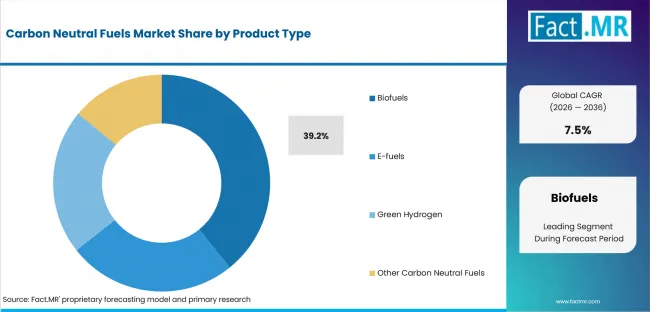
Carbon Neutral Fuels Market Analysis By Product Type | Source: Fact.MR
Biofuels lead as they have the most mature production base, blending rules and downstream handling knowledge among carbon-neutral fuel options.
Why does Automotive lead End Use?
Automotive is projected to account for 30.0% share in 2026.
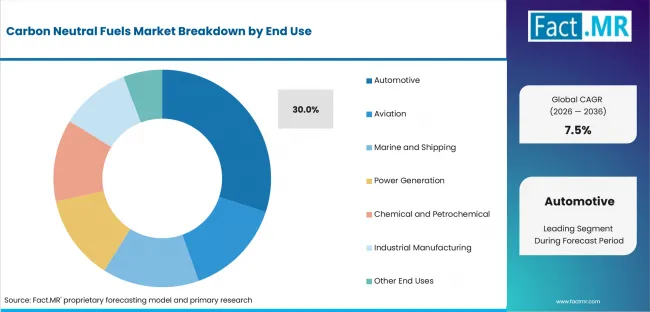
Carbon Neutral Fuels Market Analysis By End Use | Source: Fact.MR
Automotive leads because road-fuel blending and renewable diesel use already give companies a high-volume route to demand.
Why does Direct Fuel Supply Contracts lead Distribution Channel?
Direct Fuel Supply Contracts is projected to account for 30.3% share in 2026.
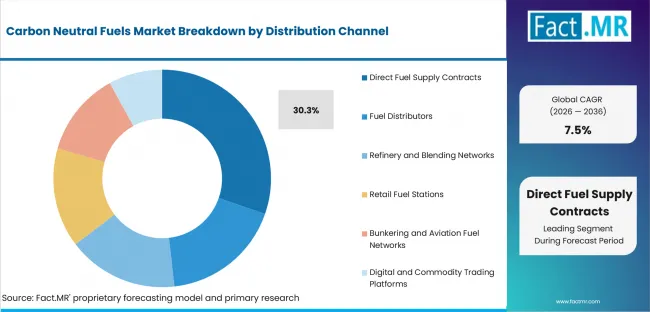
Carbon Neutral Fuels Market Analysis By Distribution Channel | Source: Fact.MR
Direct fuel supply contracts lead as customers need traceability, audited emissions attributes and dependable volumes tied to their own climate targets.
Why does Biomass and Organic Waste lead Feedstock?
Biomass and Organic Waste is projected to account for 33.8% share in 2026.
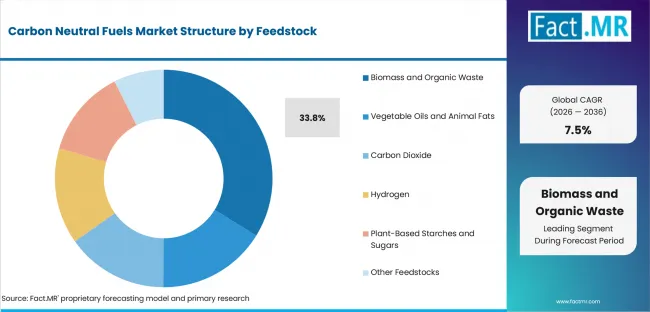
Carbon Neutral Fuels Market Analysis By Feedstock | Source: Fact.MR
Biomass and organic waste lead as they connect fuel production to available agricultural residues, municipal waste, used oils and other lower-carbon feedstock streams.
What is accelerating Carbon Neutral Fuels Market adoption, and what is holding it back?
Adoption is strongest where buyers can document carbon intensity, secure feedstock traceability and rely on contracted fuel volumes. Certification cost, feedstock availability and fuel-availability proof slow procurement.
Input security links directly to Fact.MR's Bio-Feedstock Market, since feedstock quality affects both carbon accounting and fuel yield.
Drivers Impact Analysis
| DRIVER | QUALITATIVE RELEVANCE | GEOGRAPHIC RELEVANCE | IMPACT TIMELINE |
|---|---|---|---|
| Mature biofuel blending routes | High | Brazil | Short term (<=2 years) |
| Hard-to-electrify transport demand | High | USA | Short term (<=2 years) |
| SAF and renewable diesel offtake | Moderate | UK | Medium term (2-4 years) |
| Carbon-intensity certification | Selective | Germany | Medium term (2-4 years) |
Source: Fact.MR analysis. Updated Jul 30, 2026
- Mature biofuel blending routes: Biofuels lead as they are already blended into road transport, aviation trials, marine fuel programs and industrial fuel pools. The segment has a clearer route to volume than many synthetic fuels because feedstock collection, conversion assets and distribution rules already exist.
- Hard-to-electrify transport demand: Transportation leads because liquid fuels are hardest to replace in aviation, heavy-duty vehicles, marine applications and long-distance mobility. Carbon-neutral fuel demand therefore concentrates.
- SAF and renewable diesel offtake: Automotive remains the largest end-use block because bioethanol, biodiesel, renewable diesel and low-carbon blends can move through established vehicle and fuel-distribution systems.
- Carbon-intensity certification: Direct fuel supply contracts lead as large buyers need volume assurance, carbon-intensity documentation, offtake terms and compliance evidence. Spot purchasing cannot carry the same decarbonization claim.
Opportunity Impact Analysis
| OPPORTUNITY | QUALITATIVE RELEVANCE | GEOGRAPHIC RELEVANCE | IMPACT TIMELINE |
|---|---|---|---|
| Aviation and fleet fuel contracts | High | USA | Medium term (2-4 years) |
| Residue and waste-to-fuel pathways | Moderate | Brazil | Medium term (2-4 years) |
| Book-and-claim and audit services | Selective | UK | Medium term (2-4 years) |
Source: Fact.MR analysis. Updated Jul 30, 2026
- Aviation and fleet fuel contracts: SAF and renewable diesel offtake agreements can pull investment into biorefineries when airlines and fleets need credible Scope 1 reduction tools.
- Residue and waste-to-fuel pathways: Waste-to-fuel and residue-based pathways can improve the carbon story where food-crop competition is sensitive.
- Book-and-claim and audit services: Book-and-claim, certification and carbon-intensity documentation services can become a commercial differentiator alongside the fuel itself.
Restraints Impact Analysis
| RESTRAINT | QUALITATIVE RELEVANCE | GEOGRAPHIC RELEVANCE | IMPACT TIMELINE |
|---|---|---|---|
| Certified feedstock shortage | High | Brazil | Short term (<=2 years) |
| Inconsistent carbon accounting | Moderate | USA | Medium term (2-4 years) |
| High synthetic-fuel production cost | Selective | Germany | Medium term (2-4 years) |
Source: Fact.MR analysis. Updated Jul 30, 2026
- Certified feedstock shortage: Feedstock availability limits scale because waste oils, residues and certified biomass are unevenly distributed and already contested by several fuel pathways.
- Inconsistent carbon accounting: Carbon accounting rules can slow adoption when buyers cannot compare lifecycle emissions or claim treatment across markets.
- High synthetic-fuel production cost: Infrastructure and blending constraints hold back hydrogen-derived and synthetic fuels until production cost, storage and end-use compatibility improve.
Which countries are scaling Carbon Neutral Fuels Market fastest?
Country rates show where buying conditions and supplier proof are already stronger.
Synthetic route assumptions should be checked against Fact.MR's Industrial CO2-to-Fuels Direct Air Capture Market, where captured carbon supply shapes e-fuel feasibility.
- Brazil: The market is expected to grow at a CAGR of 6.03% from 2026 to 2036. Brazil's growth is helped by an established biofuel base, sugarcane ethanol experience and policy familiarity with transport blending. Feedstock economics still decide how much incremental fuel can move into higher-value export or aviation uses.
- UK: The market is expected to grow at a CAGR of 7.52% from 2026 to 2036. UK demand is shaped by aviation decarbonization, refinery transition plans and carbon-reporting pressure on fleets. Buyers will look for traceable SAF and renewable diesel volumes rather than broad offset-style claims.
- USA: The market is expected to grow at a CAGR of 9.79% from 2026 to 2036. USA growth is supported by renewable diesel, ethanol, SAF investment and large fleet-fuel demand. The strongest companies will link offtake contracts with eligible feedstocks and credible lifecycle accounting.
- Australia: The market is expected to grow at a CAGR of 5.25% from 2026 to 2036. Australia's opportunity is tied to aviation, mining fleets and export-oriented clean-fuel projects. Long logistics chains make local feedstock aggregation and fuel certification important.
- Germany: The market is expected to grow at a CAGR of 8.28% from 2026 to 2036. Germany's adoption depends on EU fuel rules, industrial decarbonization demand and strict sustainability documentation. Synthetic fuels matter strategically, but cost and renewable-power supply remain constraints.
- Canada: The market is expected to grow at a CAGR of 6.72% from 2026 to 2036. Canada benefits from clean fuel rules, biomass resources and heavy-transport demand. Cold-weather fuel performance and regional feedstock logistics influence procurement.
- Japan: The market is expected to grow at a CAGR of 8.98% from 2026 to 2036. Japan's outlook is tied to import partnerships, aviation fuel planning and hydrogen-related fuel strategies. Supply security and certification are more important than speculative domestic production volume.
The full report provides country-level CAGR analysis across North America, Latin America, Europe, East Asia, South Asia and Oceania, and the Middle East and Africa.
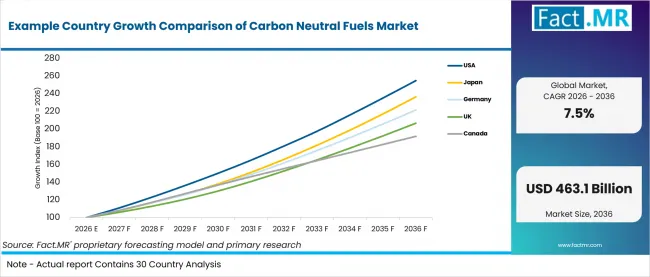
Example Country Growth Comparison Of Carbon Neutral Fuels Market | Source: Fact.MR
| Country | CAGR (2026-2036) |
|---|---|
| Brazil | 6.03% |
| UK | 7.52% |
| USA | 9.79% |
| Australia | 5.25% |
| Germany | 8.28% |
| Canada | 6.72% |
| Japan | 8.98% |
Source: Fact.MR analysis. Updated Jul 30, 2026
What is shaping Brazil's outlook through 2036?
6.03% CAGR from 2026 to 2036.
Brazil's growth is helped by an established biofuel base, sugarcane ethanol experience and policy familiarity with transport blending. Feedstock economics still decide how much incremental fuel can move into higher-value export or aviation uses.
What is shaping UK's outlook through 2036?
7.52% CAGR from 2026 to 2036.
UK demand is shaped by aviation decarbonization, refinery transition plans and carbon-reporting pressure on fleets. Buyers will look for traceable SAF and renewable diesel volumes rather than broad offset-style claims.
What is shaping USA's outlook through 2036?
9.79% CAGR from 2026 to 2036.
USA growth is supported by renewable diesel, ethanol, SAF investment and large fleet-fuel demand. The strongest companies will link offtake contracts with eligible feedstocks and credible lifecycle accounting.
What is shaping Australia's outlook through 2036?
5.25% CAGR from 2026 to 2036.
Australia's opportunity is tied to aviation, mining fleets and export-oriented clean-fuel projects. Long logistics chains make local feedstock aggregation and fuel certification important.
What is shaping Germany's outlook through 2036?
8.28% CAGR from 2026 to 2036.
Germany's adoption depends on EU fuel rules, industrial decarbonization demand and strict sustainability documentation. Synthetic fuels matter strategically, but cost and renewable-power supply remain constraints.
Who leads the Carbon Neutral Fuels Market?
Neste Oyj; Archer Daniels Midland Company; Cargill, Incorporated; Gevo, Inc. are among the visible providers in the carbon neutral fuels market.
Neste Oyj and Archer Daniels Midland Company are among the most visible providers. Competition is shaped by product proof, channel access and buyer trust.
Between 2026 and 2036, market rivalry is likely to center on clearer positioning around Biofuels, stronger documentation and better support at the point of purchase.
Which companies are the key providers?
Key companies include Neste Oyj; Archer Daniels Midland Company; Cargill, Incorporated; Gevo, Inc.; LanzaTech Global, Inc.; Carbon Engineering ULC, an Oxy Low Carbon Ventures subsidiary; Exxon Mobil Corporation; Shell plc.
- Neste Oyj
- Archer Daniels Midland Company
- Cargill, Incorporated
- Gevo, Inc.
- LanzaTech Global, Inc.
- Carbon Engineering ULC, an Oxy Low Carbon Ventures subsidiary
- Exxon Mobil Corporation
- Shell plc
Bibliography
- International Energy Agency, Net Zero by 2050.
- International Energy Agency, Bioenergy.
- International Energy Agency, Global Biofuel Demand in Transport.
- U.S. Department of Energy, Sustainable Aviation Fuel Initiative.
- U.S. Department of Energy, SAF Grand Challenge Roadmap.
- European Commission, Renewable Hydrogen.
- Fact.MR, Biofuels Market.
This Report Answers
- The report provides strategic intelligence on the Carbon Neutral Fuels Market across segment choices that shape the 2026 market structure.
- Segment analysis covers Biofuels and Transportation as the share leaders within the 2026 market.
- Country outlook evaluates the listed markets by CAGR and explains the adoption conditions in each country.
- Competitive analysis profiles the named providers and evaluates competition around product proof, channel access and buyer trust.
- Related coverage connects this report with adjacent fuel, feedstock and energy-transition markets.
What does the Carbon Neutral Fuels Market cover?
The Carbon Neutral Fuels Market covers biofuels, synthetic fuels, renewable diesel, renewable methanol, green hydrogen-derived fuels and other lower-carbon fuels used across transportation, industrial, power and heating applications.
The Carbon Neutral Fuels Market covers biofuels, synthetic fuels, renewable diesel, renewable methanol, green hydrogen-derived fuels and other lower-carbon fuels used across transportation, industrial, power and heating applications.
Adjacent spending is included only when it is part of the same purchase decision or operating use case.
What is included in the scope?
The scope includes Product Type, Application, End Use, Distribution Channel, Feedstock and regional demand.
Coverage includes adjacent segment options only when they are purchased for the same defined market use.
What is excluded from the scope?
carbon offsets without fuel delivery, conventional fossil fuels sold without verified low-carbon attributes, battery-electric systems, and unrelated renewable electricity equipment.
The scope excludes carbon offsets without fuel delivery, conventional fossil fuels sold without verified low-carbon attributes, battery-electric systems, and unrelated renewable electricity equipment.
How Was the Analysis Built?
The analysis combines primary research with desk research focused on the carbon neutral fuels market, its segment structure and country-level demand.
- Primary Research: Interviews and validation discussions test buyer priorities, adoption barriers, pricing logic and operating requirements.
- Desk Research: The assessment reviews company disclosures, public datasets, regulatory material, technical literature and industry records relevant to the market.
- Market Sizing and Forecasting: Estimates combine top-down and bottom-up checks across demand signals, segment shares, country activity, company participation and adoption constraints.
- Data Validation and Update Cycle: Findings are validated against public evidence, company activity and country-level adoption patterns before final use.
Segmentation
What is the report's scope and coverage?
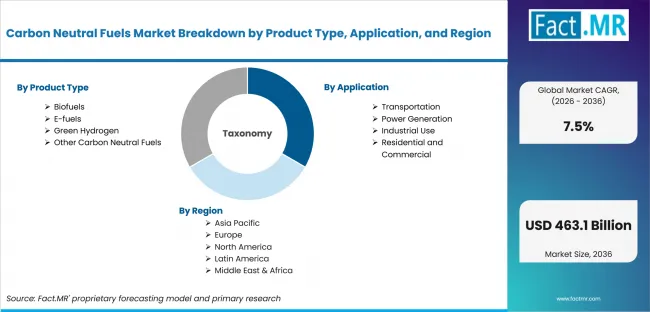
Carbon Neutral Fuels Market Breakdown By Product Type, Application, And Region | Source: Fact.MR
| Attribute | Details |
|---|---|
| Quantitative Units | USD 224.7 billion in 2026 to USD 463.1 billion by 2036, at a 7.5% CAGR. |
| Market Definition | Carbon Neutral Fuels Market covers biofuels, synthetic fuels, renewable diesel, renewable methanol, green hydrogen-derived fuels and other lower-carbon fuels used across transportation, industrial, power and heating applications. |
| Product Type | Biofuels; Biodiesel; Bioethanol; E-fuels; E-Methanol; E-Synthetic Hydrocarbon Fuels; Green Hydrogen; Green Hydrogen for Mobility; Green Hydrogen for Industrial Applications; Other Carbon Neutral Fuels; Renewable Methanol; Bio-Based Synthetic Fuels |
| Application | Transportation; Road Transportation; Aviation and Marine Transportation; Power Generation; Gas Turbine Power Generation; Backup and Distributed Power Generation; Industrial Use; Chemicals and Petrochemicals; Iron, Steel and Other Heavy Industries; Residential and Commercial; Residential Heating; Commercial Heating and Power |
| End Use | Automotive; Passenger Vehicles; Heavy-Duty Commercial Vehicles; Aviation; Commercial Aviation; Defense and General Aviation; Marine and Shipping; Container and Cargo Shipping; Cruise and Passenger Vessels; Power Generation; Utility-Scale Power Plants; Distributed and Backup Generation; Chemical and Petrochemical; Chemical Feedstock; Petrochemical Processing; Industrial Manufacturing; Metal and Steel Manufacturing; Cement and Other Industrial Processes; Other End Uses; Agriculture and Farm Equipment; Residential and Commercial Energy |
| Distribution Channel | Direct Fuel Supply Contracts; Long-Term Offtake Agreements; Direct Industrial Supply; Fuel Distributors; Regional Fuel Distributors; Specialty Renewable Fuel Distributors; Refinery and Blending Networks; Refinery-Based Blending; Terminal-Based Fuel Distribution; Retail Fuel Stations; Branded Fuel Stations; Independent Fuel Retailers; Bunkering and Aviation Fuel Networks; Marine Bunkering; Aviation Fuel Supply Networks; Digital and Commodity Trading Platforms; Digital Fuel Trading; Online Commodity Procurement |
| Feedstock | Biomass and Organic Waste; Agricultural Residues; Forestry and Municipal Organic Waste; Vegetable Oils and Animal Fats; Vegetable Oils; Animal Fats and Used Cooking Oils; Carbon Dioxide; Industrial Captured CO2; Direct Air Capture CO2; Hydrogen; Green Hydrogen; Recycled and Low-Carbon Hydrogen; Plant-Based Starches and Sugars; Corn and Sugarcane; Cellulosic Biomass; Other Feedstocks; Algae-Based Feedstocks; Waste-Derived Feedstocks |
| Regions Covered | North America; Latin America; Europe; East Asia; South Asia and Oceania; Middle East and Africa |
| Countries Covered | Brazil; UK; USA; Australia; Germany; Canada; Japan |
| Key Companies Profiled | Neste Oyj; Archer Daniels Midland Company; Cargill, Incorporated; Gevo, Inc.; LanzaTech Global, Inc.; Carbon Engineering ULC, an Oxy Low Carbon Ventures subsidiary; Exxon Mobil Corporation; Shell plc |
| Forecast Period | 2026 to 2036 |
| Approach | Hybrid top-down and bottom-up assessment using demand indicators, segment mix, country growth, company participation and public evidence relevant to the category. |
Source: Fact.MR analysis. Updated Jul 30, 2026
How is the market segmented?
-
By Product Type:
- Biofuels
- Biodiesel
- Bioethanol
- E-fuels
- E-Methanol
- E-Synthetic Hydrocarbon Fuels
- Green Hydrogen
- Green Hydrogen for Mobility
- Green Hydrogen for Industrial Applications
- Other Carbon Neutral Fuels
- Renewable Methanol
- Bio-Based Synthetic Fuels
-
By Application:
- Transportation
- Road Transportation
- Aviation and Marine Transportation
- Power Generation
- Gas Turbine Power Generation
- Backup and Distributed Power Generation
- Industrial Use
- Chemicals and Petrochemicals
- Iron, Steel and Other Heavy Industries
- Residential and Commercial
- Residential Heating
- Commercial Heating and Power
-
By End Use:
- Automotive
- Passenger Vehicles
- Heavy-Duty Commercial Vehicles
- Aviation
- Commercial Aviation
- Defense and General Aviation
- Marine and Shipping
- Container and Cargo Shipping
- Cruise and Passenger Vessels
- Power Generation
- Utility-Scale Power Plants
- Distributed and Backup Generation
- Chemical and Petrochemical
- Chemical Feedstock
- Petrochemical Processing
- Industrial Manufacturing
- Metal and Steel Manufacturing
- Cement and Other Industrial Processes
- Other End Uses
- Agriculture and Farm Equipment
- Residential and Commercial Energy
-
By Distribution Channel:
- Direct Fuel Supply Contracts
- Long-Term Offtake Agreements
- Direct Industrial Supply
- Fuel Distributors
- Regional Fuel Distributors
- Specialty Renewable Fuel Distributors
- Refinery and Blending Networks
- Refinery-Based Blending
- Terminal-Based Fuel Distribution
- Retail Fuel Stations
- Branded Fuel Stations
- Independent Fuel Retailers
- Bunkering and Aviation Fuel Networks
- Marine Bunkering
- Aviation Fuel Supply Networks
- Digital and Commodity Trading Platforms
- Digital Fuel Trading
- Online Commodity Procurement
-
By Feedstock:
- Biomass and Organic Waste
- Agricultural Residues
- Forestry and Municipal Organic Waste
- Vegetable Oils and Animal Fats
- Vegetable Oils
- Animal Fats and Used Cooking Oils
- Carbon Dioxide
- Industrial Captured CO2
- Direct Air Capture CO2
- Hydrogen
- Green Hydrogen
- Recycled and Low-Carbon Hydrogen
- Plant-Based Starches and Sugars
- Corn and Sugarcane
- Cellulosic Biomass
- Other Feedstocks
- Algae-Based Feedstocks
- Waste-Derived Feedstocks
-
By Region:
- North America
- Latin America
- Europe
- East Asia
- South Asia and Oceania
- Middle East and Africa
Frequently Asked Questions
Which Product Type leads the market?
Which Application leads the market?
Which End Use leads the market?
Which Distribution Channel leads the market?
Which Feedstock leads the market?
Which country records the highest listed CAGR?
What is the primary driver in this market?
What is the main restraint?
Who worked on this report


Preview the report firsthand - request a free sample
Free SampleGet the brochure for pricing and purchase details
Download PDF