- Market Value (2025): USD 265.0 Mn
- Estimated Value (2026): USD 285.0 Mn
- Forecast Value (2036): USD 590.0 Mn
- CAGR (2026-2036): 7.5%
What is the Expo Lead Scanners Market forecast to be worth by 2036?
USD 285.0 million in 2026 to USD 590.0 million by 2036 at 7.5% CAGR.
- The expo lead scanners market crossed a valuation of USD 265.0 million in 2025 as exhibitors prioritized faster capture and cleaner records after high-volume shows.
- Demand is projected to increase from USD 285.0 million in 2026 to USD 590.0 million by 2036.
- The market is forecast to record 7.5% CAGR from 2026 to 2036 as exhibitors need faster capture, cleaner CRM handoff and less manual entry.
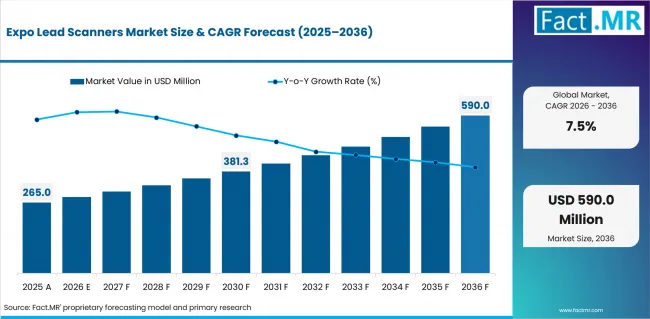
Expo Lead Scanners Market Value Analysis | Source: Fact.MR
What are the defining numbers behind Expo Lead Scanners Market growth?
USD 305.0 million absolute opportunity by 2036, led by mobile app scanners and QR scan use alongside per-event rental and CRM export.
- Demand Drivers in the Market
- Faster lead capture reduces the time between booth discussion and assigned follow-up. Exhibitors gain more value when staff can scan badges, add qualifiers and move records without post-show retyping.
- Reduced manual transcription is expected to support adoption because event staff spend less time fixing names and booth notes. The benefit improves when offline capture and later sync are tested before the event opens.
- Exhibitor demand for measurable event return is anticipated to move lead scanners into the pre-show checklist. Providers need to show how captured records support pipeline review instead of only reporting scan counts.
- Key Segments Analyzed
- By Scanner Type: Mobile app scanners are estimated to hold 36.0% share in 2026. Their lead reflects recurring booth programs and lower hardware dependence.
- By Lead Capture Mode: QR scan is projected to account for 34.0% share in 2026. Exhibitors favor the format because badge access is simple and booth staff can use it quickly.
- By Revenue Model: Per-event rental is expected to capture 31.0% share in 2026. Occasional exhibitors prefer a show-specific cost instead of a full annual commitment.
- By Output Integration: CRM export is anticipated to represent 29.0% share in 2026. Sales teams need records that move cleanly into follow-up systems.
- By Exhibitor Type: Technology exhibitors are forecast to hold 25.0% share in 2026. Product-led shows require fast qualification and digital marketing software alignment.
- Analyst Opinion at Fact.MR
- • Shambhu Nath Jha, Senior Analyst at Fact.MR, states, “Expo lead scanner selection is expected to depend on booth-level capture speed and follow-up routing. The most useful offers keep context attached to the record before sales follow-up begins.”
- Strategic Implications
- Event organizers should test field design before scanners are issued to booth staff. A short acceptance checklist helps confirm that badge scans, notes and CRM handoff remain aligned during peak visitor flow.
- Providers can improve sales discussions by separating scanner hardware from badge data rules and CRM export responsibility. This makes pricing easier to compare and reduces disputes when exhibitors expect instant access after the event.
- Exhibitor teams should assign lead owners before the show starts and review sample exports before the first scan. That step keeps follow-up timing visible and connects scanner use with AI in sales workflows.
IAEE reported in May 2026 that the CEIR Total Index is forecast to grow 2.1% in 2026. This release shows the index measures exhibit space. It tracks attendance, exhibitor count and gross revenue as part of the same view. For scanner providers, the useful point is not the broader growth number. It is that exhibitors are expected to measure event return more carefully during a steady recovery.
UAE is projected to record an 8.2% CAGR from 2026 to 2036. USA is projected to record a 7.5% CAGR from 2026 to 2036. Japan is projected to record a 7.4% CAGR from 2026 to 2036. UK is projected to record a 7.2% CAGR from 2026 to 2036. Germany is projected to record a 6.9% CAGR from 2026 to 2036.
How does the Expo Lead Scanners Market break down by segment?
Mobile app scanners are expected to lead Scanner Type at 36.0% share in 2026. QR scan is projected to lead Lead Capture Mode at 34.0% share in 2026.
Which scanner type dominates?
Mobile app scanners are projected to account for 36.0% share in 2026.
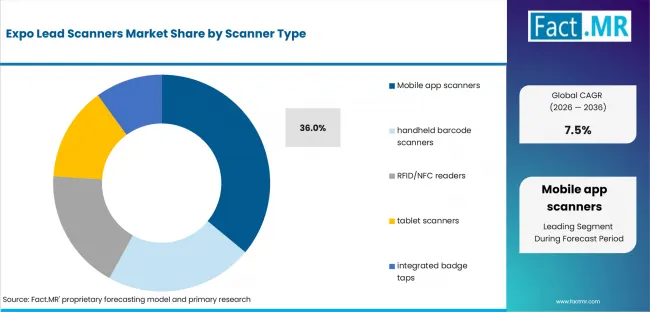
Expo Lead Scanners Market Analysis By Scanner Type | Source: Fact.MR
Exhibitors favor mobile apps because staff can capture leads through devices they already carry. This makes setup easier and limits the need for separate scanning equipment. Their usefulness increases when badge data can be stored offline, supported by custom qualification fields, and reviewed before export.
What leads the Lead Capture Mode segment?
QR scan is expected to hold 34.0% share in 2026.
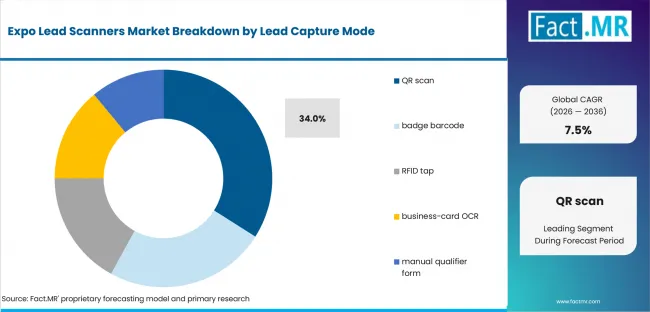
Expo Lead Scanners Market Analysis By Lead Capture Mode | Source: Fact.MR
QR codes offer a quick and familiar way to collect visitor details at crowded booths. Staff need little training, while attendees can complete the process without lengthy interaction. Their strong position also reflects broad use across digital badges, printed passes, and other 2D barcode formats.
Why does Per-event rental lead Revenue Model?
Per-event rental is projected to account for 31.0% share in 2026.
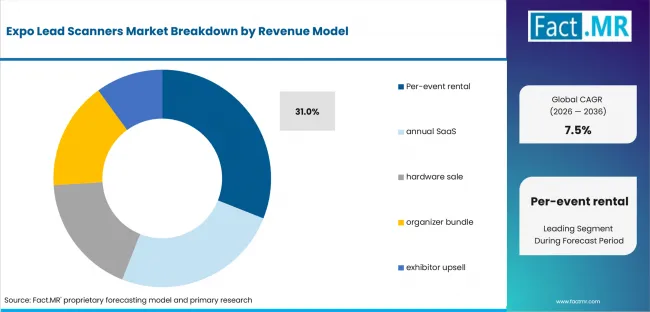
Expo Lead Scanners Market Analysis By Revenue Model | Source: Fact.MR
This model appeals to companies that participate in only a few exhibitions each year. Instead of buying equipment or committing to an annual contract, exhibitors can pay only for the events they attend. It also gives them a practical way to test scanner performance before considering a wider deployment.
How does CRM export shape Output Integration?
CRM export is anticipated to lead with 29.0% share in 2026.
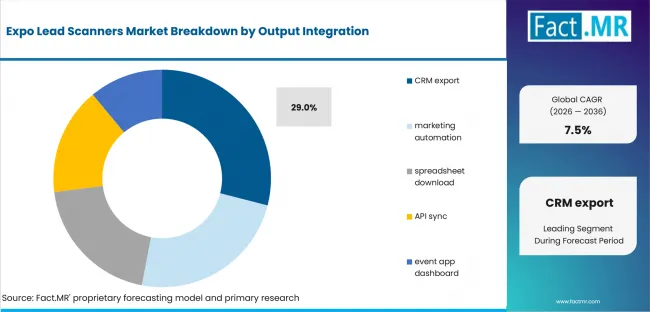
Expo Lead Scanners Market Analysis By Output Integration | Source: Fact.MR
Direct transfer into CRM platforms helps sales teams begin follow-up without re-entering badge information manually. Predefined field mapping also improves account assignment and reduces missing data. The integration becomes especially valuable after large events, when hundreds of leads must be sorted and contacted quickly.
What supports Technology within Exhibitor Type?
Technology exhibitors are forecast to hold 25.0% share in 2026.
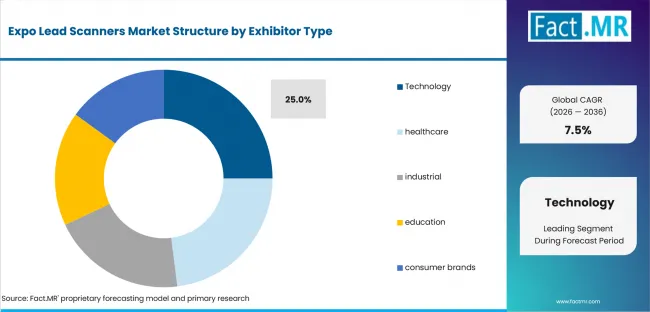
Expo Lead Scanners Market Analysis By Exhibitor Type | Source: Fact.MR
Technology companies often use exhibitions to demonstrate complex products and identify serious buyers. Their teams therefore capture more than basic contact details, including product interest, purchase timing, and account priority. Lead scanners help organize this information and connect it with later marketing and sales activity.
What is accelerating Expo Lead Scanners Market adoption, and what is holding it back?
Demand is expected to be driven by faster lead capture and CRM-ready records. Adoption is expected to be held back by badge-data access limits and delayed CRM synchronization.
Drivers Impact Analysis
| DRIVER | (~) % IMPACT ON CAGR | GEOGRAPHIC RELEVANCE | IMPACT TIMELINE |
|---|---|---|---|
| Faster lead capture | +2.0% | North America and Europe | Short term (<= 2 years) |
| CRM-ready records | +1.6% | China and UAE | Short term (<= 2 years) |
| Reduced manual transcription | +1.2% | Mature exhibition markets | Medium term (2-4 years) |
| Exhibitor demand for measurable event return | +0.8% | Global | Medium term (2-4 years) |
Source: Fact.MR analysis. Updated Jul 28, 2026
- Faster lead capture: Faster capture is expected to raise adoption where exhibitors handle several conversations in a short period. It helps booth staff preserve context while reducing the gap between scan and assigned follow-up.
- CRM-ready records: CRM-ready records are expected to strengthen demand once field mapping is included in event specifications. Providers need to show that lead records remain usable after export into customer relationship platforms.
- Reduced manual transcription: Reduced transcription is expected to support adoption by cutting cleanup work after exhibitions. The driver is stronger when names, company details and notes are captured correctly during the booth conversation.
- Exhibitor demand for measurable event return: Measurable event return is expected to make scanners part of post-show performance review. Exhibitors compare scan counts with qualified records and the speed of follow-up assignment.
Opportunity Impact Analysis
| OPPORTUNITY | (~) % IMPACT ON CAGR | GEOGRAPHIC RELEVANCE | IMPACT TIMELINE |
|---|---|---|---|
| AI-assisted conversation notes | +1.4% | China and UAE | Short term (<= 2 years) |
| Instant routing by territory | +1.0% | USA and UK | Medium term (2-4 years) |
| Organizer-wide data standards | +0.7% | Germany and Japan | Medium term (2-4 years) |
Source: Fact.MR analysis. Updated Jul 28, 2026
- AI-assisted conversation notes: Conversation notes are expected to create opportunity where exhibitors need richer context after the booth meeting. The feature adds value only when it supports follow-up quality instead of adding work for staff.
- Instant routing by territory: Territory routing is expected to improve sales response when captured leads need immediate owner assignment. The same workflow supports self-service analytics when managers review event performance across regions.
- Organizer-wide data standards: Data standards are expected to create a broader opportunity when organizers define badge fields and export rules before the show. Standard records reduce confusion across exhibitors using different capture tools.
Restraints Impact Analysis
| RESTRAINT | (~) % IMPACT ON CAGR | GEOGRAPHIC RELEVANCE | IMPACT TIMELINE |
|---|---|---|---|
| Badge-data access limits | -1.4% | Global | Short term (<= 2 years) |
| Poor qualifier design | -1.1% | Cost-sensitive regional markets | Medium term (2-4 years) |
| Delayed CRM synchronization | -0.8% | Highly regulated venues | Short term (<= 2 years) |
Source: Fact.MR analysis. Updated Jul 28, 2026
- Badge-data access limits: Badge-data access limits are expected to restrain adoption when organizers restrict what exhibitors can collect. Providers need clear permission rules before promising complete CRM-ready records.
- Poor qualifier design: Poor qualifier design is expected to weaken scanner value when booth staff capture only names and company details. Useful forms need short fields that identify interest level, product fit and next action.
- Delayed CRM synchronization: Delayed synchronization is expected to slow adoption when sales teams cannot act on records quickly. The risk is lower when data ownership and support responsibilities are agreed before event opening.
Which countries are scaling Expo Lead Scanners Market fastest?
The country comparison is shaped by event density, organizer standards and the service model behind scanner deployment. China and the UAE form the upper pair above the global figure. The USA and Japan remain close to the global path. UK and Germany show steadier growth where exhibitors place more weight on documentation and integration discipline.
- The UAE follows a service-led route where international exhibitors need fast turnaround between successive shows. Scanner providers gain more value when they combine simple capture with quick support and export readiness.
- The USA remains aligned with the global CAGR as exhibitor procurement is strongly tied to measurable event return. Adoption depends on whether scan records support account assignment and timely sales follow-up.
- Japan’s growth is shaped by compact event operations and a preference for reliable, low-friction tools. Mobile app scanners and QR capture remain relevant when they reduce staff training needs.
- The UK keeps a steady path through recurring exhibitions and agency-managed event programs. Demand improves when providers document CRM export steps and service levels before the event begins.
- Germany grows at a measured pace because trade-fair customers often require clear documentation and technical reliability. Providers must prove badge access, data handling and CRM synchronization before wider use.
Comparable CAGRs therefore produce different operating conditions across these countries. Deployment timing depends on organizer rules, local service depth and the exhibitor’s ability to convert scan records into follow-up activity.
The full report provides country-level CAGR analysis across North America, Latin America and Europe. Coverage extends to East Asia, South Asia and Oceania. The Middle East and Africa are included in the same regional view.
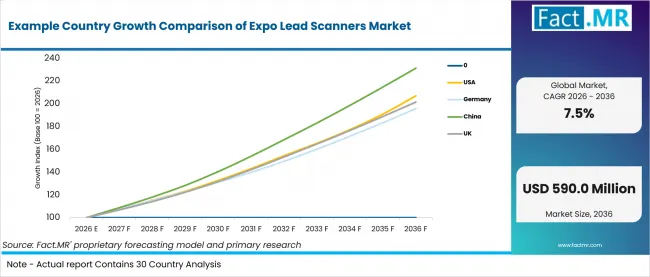
Example Country Growth Comparison Of Expo Lead Scanners Market | Source: Fact.MR
| Country | CAGR (2026-2036) |
|---|---|
| UAE | 8.2% |
| USA | 7.5% |
| Japan | 7.4% |
| UK | 7.2% |
| Germany | 6.9% |
Source: Fact.MR analysis. Updated Jul 28, 2026
Why is the UAE recording strong growth?
8.2% CAGR, driven by international exhibitions and short event turnaround times.
The UAE market operates around large events that bring together overseas exhibitors, regional distributors, and visitors from several countries. Many exhibitors require captured contacts immediately after the show because sales teams may leave the country within days. This creates demand for rental packages that include rapid setup, on-site assistance, and same-day data export rather than scanner access alone.
What shapes adoption in the USA?
7.5% CAGR, influenced by stronger pressure to demonstrate event-generated pipeline.
USA exhibitors increasingly assess shows through qualified opportunities instead of total badge scans. Scanner records therefore have to show product interest, account ownership, and the agreed next action. Demand is strongest when captured data enters existing CRM workflows without creating duplicate contacts. Providers face closer scrutiny when marketing teams cannot connect booth activity with later sales progress.
How is Japan developing its market?
7.4% CAGR, supported by compact exhibition operations and preference for dependable tools.
Japanese event teams often work within tightly planned booths where extra devices and complicated capture steps can slow visitor movement. Mobile applications and QR-based scanning fit this environment because they require limited equipment handling. Purchasing decisions are likely to favor stable operation and accurate exports over broad feature lists. A tool that works consistently across repeated events may carry more value than one requiring frequent configuration.
What is sustaining demand in the UK?
7.2% CAGR, led by recurring trade shows and agency-managed exhibition programs.
The UK market includes exhibitors that rely on external agencies to manage booth staffing, technology, and post-show reporting. This separates scanner users from the sales teams receiving the data. Clear field definitions and handover procedures become essential because information can pass through several parties. Providers gain an advantage when they document who controls badge access, export timing, and correction of incomplete records.
Why does Germany follow a measured growth path?
6.9% CAGR, backed by technical assessment and detailed deployment requirements.
German exhibitors are likely to examine data protection, badge compatibility, and synchronization procedures before approving a scanner package. This can make procurement slower, but it also creates a stronger position for suppliers that provide clear testing records and defined support responsibilities. Demand is tied to operational proof, particularly at industrial trade fairs where complex booth discussions require accurate qualification notes rather than basic contact collection.
Who leads the Expo Lead Scanners Market?
Captello and Cvent show the clearest direct relevance. Expo Logic expand the provider field around CRM handoff and event operations.
Captello supports enterprise event programs that need lead capture and follow-up context. Cvent is relevant where event organizers and exhibitors use LeadCapture inside a broader event platform. Expo Logic supports lead retrieval inside event management programs. Boomset and Leadature extend the provider set through mobile lead retrieval and capture workflows.
Competition is expected to depend on scan reliability and export quality from 2026 to 2036. Providers are likely to compete on offline capture and post-show reporting. Companies that prove clean data transfer into exhibitor systems are expected to gain stronger demand from recurring event programs.
Which companies are the key providers?
Key companies include Captello; Cvent; Expo Logic; Boomset; and Leadature.
- Captello
- Cvent
- Expo Logic
- Boomset
- Leadature
Bibliography
- International Association of Exhibitions and Events. (2026, May 4). IAEE releases 2026 CEIR Index report.
- Department for Science, Innovation and Technology. (2026, January 28). Business data use and productivity study (wave 2): Statistical report. Government of the United Kingdom.
- U.S. Census Bureau. (2025, September 17). Census Bureau’s 2023 Annual Business Survey provides insight into technology adoption by businesses.
- Ministry of Economy, Trade and Industry. (2025, January 27). Manual on cross-border industrial data management compiled to promote companies’ international data sharing and utilization. Government of Japan.
- Cvent. (2025, September 2). Why smart trade shows are going API-first for lead capture.
This Report Answers
- The report provides strategic intelligence on the expo lead scanners market across Scanner Type and Lead Capture Mode choices that shape exhibitor purchasing decisions.
- Segment analysis covers mobile app scanners and QR scan as the share leaders within the 2026 market.
- Country outlook evaluates China and the UAE alongside the USA and Japan. UK and Germany complete the growth comparison across the profiled countries.
- Competitive analysis profiles Captello and Cvent alongside Expo Logic. Boomset and Leadature complete the provider set.
- Use-case assessment covers booth capture and CRM export. QR scan, per-event rental and event app dashboard functions complete the workflow view.
What does the Expo Lead Scanners Market cover?
Expo lead scanners capture exhibitor leads from event badges and transfer qualified records into sales or marketing systems.
The Expo Lead Scanners Market covers mobile app scanners and handheld barcode scanners used in exhibition workflows. RFID/NFC readers and tablet scanners are included when they support lead retrieval. It includes badge integrations and lead-export functions when they are sold as part of a complete lead retrieval package. Bluetooth beacon systems remain outside the scope unless they directly support lead capture. Ticket scanners remain outside the scope when they only support access control. Security detectors and scanners are excluded unless they directly support lead capture.
The market differs from general event technology because commercial value comes from converting booth conversations into usable sales records. General event management software, badge printing and post-event sales services are excluded unless they are bundled with the defined scanner function.
What is included in the scope?
Expo lead scanner solutions are used across technology and healthcare exhibitors. Industrial, education and consumer-brand exhibitors are included under the same workflow rule.
The scope includes Scanner Type and Lead Capture Mode alongside Revenue Model, Output Integration and Exhibitor Type. Coverage spans mobile app scanners and handheld barcode scanners. RFID/NFC readers, tablet scanners and integrated badge taps complete the scanner scope. CRM export and spreadsheet download follow the same workflow-use rule. API sync and event app dashboard functions are included when they support lead handoff.
What is excluded from the scope?
General CRM subscriptions and unrelated event-management services remain outside the scope of this market.
The scope excludes badge printing, contact databases and post-event sales services when they are not sold with expo lead scanners. Venue construction, floor-space rental and broad event marketing services are excluded. Company revenue without a clear connection to badge-based lead capture or CRM-ready export is excluded.
How Was the Analysis Built?
The analysis draws on 120+ sources, 35+ company portfolios, 25+ countries, and more than 20 industry interviews.
- Primary Research: Primary research includes discussions with manufacturers, service providers, technology developers, distributors, end users, procurement teams, and subject-matter experts. These conversations examine purchasing priorities, product adoption, operational challenges, approval requirements, competitive positioning, and the factors that influence wider market acceptance.
- Desk Research: Desk research covers government statistics, regulatory publications, company filings, trade data, technical studies, industry associations, standards, public policy, and other authoritative sources. Every source used in the analysis is documented in the bibliography.
- Market Sizing and Forecasting: Market estimates combine historical performance, demand indicators, pricing and volume trends, segment shares, company participation, country-level growth, adoption patterns, investment activity, and barriers to market expansion.
- Data Validation and Update Cycle: Findings are validated by comparing primary interviews with public data, company activity, regulatory changes, trade patterns, and industry developments. Regular updates review new product launches, capacity changes, partnerships, approvals, procurement trends, and shifts in commercial adoption.
Segmentation
What is the report’s scope and coverage?
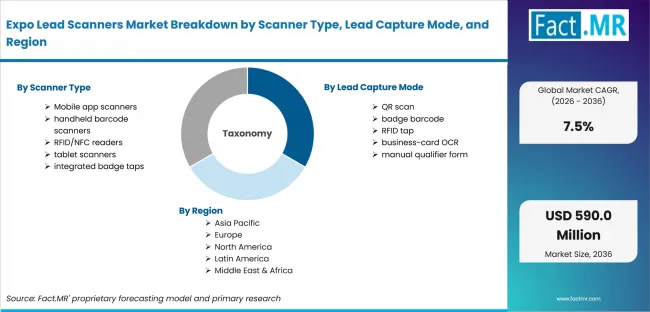
Expo Lead Scanners Market Breakdown By Scanner Type, Lead Capture Mode, And Region | Source: Fact.MR
| Attribute | Details |
|---|---|
| Quantitative Units | USD million in 2026 to USD million by 2036 at a CAGR |
| Market Definition | Mobile or dedicated tools that capture exhibitor leads from event badges and transfer qualified records to sales systems when sold as a commercial event solution |
| Scanner Type | Mobile app scanners; handheld barcode scanners; RFID/NFC readers; tablet scanners; integrated badge taps |
| Lead Capture Mode | QR scan; badge barcode; RFID tap; business-card OCR; manual qualifier form |
| Revenue Model | Per-event rental; annual SaaS; hardware sale; organizer bundle; exhibitor upsell |
| Output Integration | CRM export; marketing automation; spreadsheet download; API sync; event app dashboard |
| Exhibitor Type | Technology; healthcare; industrial; education; consumer brands |
| Regions Covered | North America; Latin America; Europe; East Asia; South Asia and Pacific; Middle East and Africa |
| Countries Covered | USA; Canada; Brazil; Mexico; Germany; UK; France; Italy; Spain; South Korea; Japan; China; India; Australia & New Zealand; GCC countries; South Africa; UAE |
| Key Companies Profiled | Captello; Cvent; Expo Logic; Boomset; Leadature |
| Forecast Period | 2026 to 2036 |
| Approach | Hybrid top-down and bottom-up approach using event technology demand; scanner type adoption; lead capture mode usage; CRM export requirements; rental preference; exhibitor workflow review; country growth; company participation and adoption patterns |
Source: Fact.MR analysis. Updated Jul 28, 2026
How is the market segmented?
-
By Scanner Type:
- Mobile app scanners
- Handheld barcode scanners
- RFID/NFC readers
- Tablet scanners
- Integrated badge taps
-
By Lead Capture Mode:
- QR scan
- Badge barcode
- RFID tap
- Business-card OCR
- Manual qualifier form
-
By Revenue Model:
- Per-event rental
- Annual SaaS
- Hardware sale
- Organizer bundle
- Exhibitor upsell
-
By Output Integration:
- CRM export
- Marketing automation
- Spreadsheet download
- API sync
- Event app dashboard
-
By Exhibitor Type:
- Technology
- Healthcare
- Industrial
- Education
- Consumer brands
-
By Region:
- North America
- USA
- Canada
- Latin America
- Brazil
- Mexico
- Rest of Latin America
- Europe
- Germany
- U.K.
- France
- Italy
- Spain
- Rest of Europe
- East Asia
- South Korea
- Japan
- China
- South Asia & Oceania
- India
- Australia & New Zealand
- Rest of South Asia & Oceania
- Middle East & Africa
- GCC Countries
- South Africa
- UAE
- Rest of Middle East & Africa
- North America
Frequently Asked Questions
Which Scanner Type leads the market?
Which Lead Capture Mode leads the market?
Which Revenue Model leads the market?
Which Output Integration leads the market?
Which Exhibitor Type leads the market?
Which country records the highest listed CAGR?
What is the primary driver in this market?
What is the main restraint?
Why do technology exhibitors lead demand?
Who worked on this report


Preview the report firsthand - request a free sample
Free SampleGet the brochure for pricing and purchase details
Download PDF