- Market Value (2025): USD 3.4 Bn
- Estimated Value (2026): USD 3.9 Bn
- Forecast Value (2036): USD 16.0 Bn
- CAGR (2026-2036): 15.1%
What is the Full-System Vehicle Twins Market forecast to be worth by 2036?
USD 3.9 billion in 2026 to USD 16.0 billion by 2036, at 15.1% CAGR.
- The Full-System Vehicle Twins Market crossed a valuation of USD 3.4 billion in 2025.
- Demand is projected to increase from USD 3.9 billion in 2026 to USD 16.0 billion by 2036.
- The market is forecast to record a 15.1% CAGR from 2026 to 2036 as OEM engineering teams and validation groups standardize digital evidence across vehicle programs.
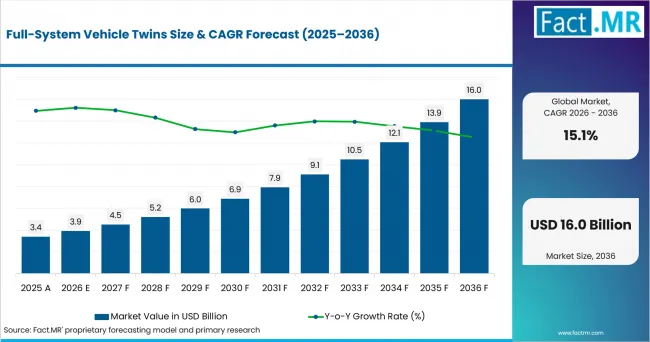
Full System Vehicle Twins Value Analysis | Source: Fact.MR
What are the defining numbers behind Full-System Vehicle Twins Market growth?
USD 12.1 billion absolute opportunity by 2036, led by full-vehicle multiphysics twin, passenger cars and simulation-led data coupling.
- Demand Drivers in the Market
- OEM vehicle-program teams need system-level correlation since battery packs, chassis loads and control software interact at platform level.
- EV platform engineers need energy and heat models across the whole vehicle. The IEA reported in May 2025 that electric car sales topped 17 million worldwide in 2024.
- ADAS safety teams need repeatable virtual road scenes so software behavior can be tested before public-road programs expand.
- Manufacturing launch teams need digital continuity from design freeze to quality checks, which suits full-vehicle twins linked to plant simulation.
- Fleet software teams need live twin feedback after release since connected vehicles create service data for calibration updates.
- Key Segments Analyzed
- By Twin Scope: Full-vehicle multiphysics twin is expected to hold 34.0% share in 2026 because it links thermal, structural and control behavior in one model.
- By Lifecycle Stage: Concept & design is projected to account for 28.0% share in 2026 as early trade-off work shapes platform cost and packaging.
- By Vehicle Type: Passenger cars are anticipated to capture 44.0% share in 2026 owing to model-volume depth and faster software-release cycles.
- By Data Coupling: Simulation-led twin is estimated to represent 35.0% share in 2026 due to lower data dependency during early vehicle programs.
- Analyst Opinion at Fact.MR
- Shambhu Nath Jha, Principal Consultant at Fact.MR, states, "Full-system vehicle twins are becoming a release discipline beyond a visualization layer. OEMs are expected to ask for evidence that a virtual vehicle reflects software, hardware and test data before platform freeze. Vendors with solver depth, PLM integration and validation workflows are better placed than point-tool providers."
- Strategic Implications
- Simulation vendors should link solvers with PLM and test-data systems so vehicle teams can reuse the same model across program gates.
- OEM engineering leaders should define correlation rules early, since weak data ownership slows acceptance of virtual evidence.
- Tier-one software teams should prepare model interfaces for E and E architecture twins that must interact with battery and chassis models.
- European platform teams should align tools with shared SDV test environments. The European Commission’s March 2025 Automotive Action Plan states that Horizon Europe will make EUR 1 billion available for the automotive sector for 2025–2027, supporting joint public-private investment in areas including connected and autonomous vehicles and next-generation battery technologies.
South Korea is projected to record 18.1% CAGR through 2036, supported by future-mobility policy and export-scale vehicle programs. Germany is anticipated to post 17.1% CAGR through 2036 because EV production and industrial test depth raise demand for correlated twins. USA is forecast to advance at 15.4% CAGR through 2036, attributable to automated-vehicle safety work and connected simulation needs. UK is estimated to hold 15.1% CAGR through 2036, due to zero-emission vehicle rules and specialist engineering services. Japan is expected to reach 14.5% CAGR through 2036, shaped by domestic SDV targets and hybrid-EV validation work.
How does the Full-System Vehicle Twins Market break down by segment?
Full-vehicle multiphysics twin leads at 34.0%; passenger cars lead at 44.0%.
Which Twin Scope dominates?
Full-vehicle multiphysics twin holds 34.0% share in 2026.
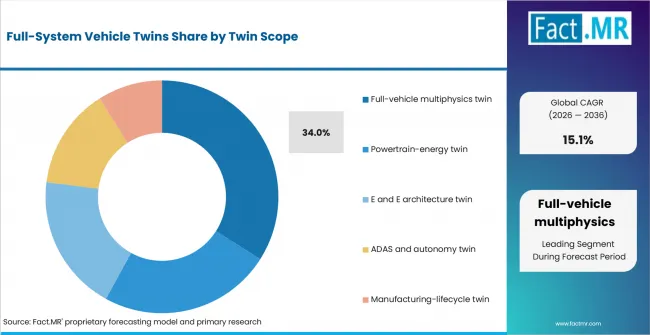
Full System Vehicle Twins Analysis By Twin Scope | Source: Fact.MR
Full-vehicle multiphysics twins lead because OEMs increasingly need one model that compares structure, aerodynamics, thermal behavior and controls. Dassault Systèmes and Volkswagen Group announced in February 2025 that the 3DEXPERIENCE cloud platform would support vehicle development across Volkswagen, Audi and Porsche teams. That type of enterprise deployment makes whole-vehicle modelling more practical across repeated platform programs.
What leads the Lifecycle Stage segment?
Concept & design accounts for 28.0% share in 2026.
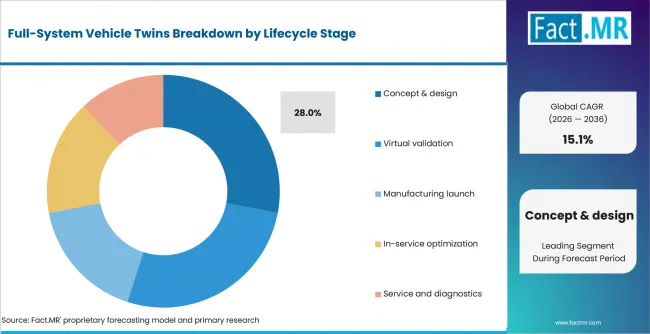
Full System Vehicle Twins Analysis By Lifecycle Stage | Source: Fact.MR
Concept and design work leads because the cost of late engineering changes rises sharply after program freeze. Full-system twins give vehicle teams a common space to compare packaging, energy use and control strategy before prototypes are locked. Workflows in automotive simulation software are expected to reinforce early-stage use where teams need simulation evidence before hardware test capacity is available.
How does Vehicle Type shape demand?
Passenger cars capture 44.0% share in 2026.
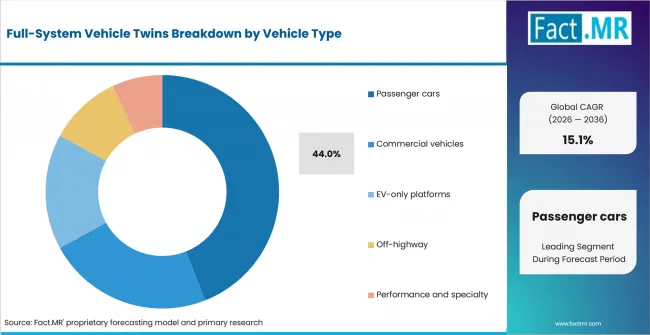
Full System Vehicle Twins Analysis By Vehicle Type | Source: Fact.MR
Passenger cars lead vehicle type demand because global OEMs run frequent refresh cycles and manage many trim variations on shared platforms. Full-system twins help engineering teams test battery sizing, thermal comfort and software behavior before variants are released. Connected car systems and automotive software platforms further raise the value of passenger-car twins where over-the-air functions change after sale.
What supports Data Coupling adoption?
Simulation-led twin represents 35.0% share in 2026.
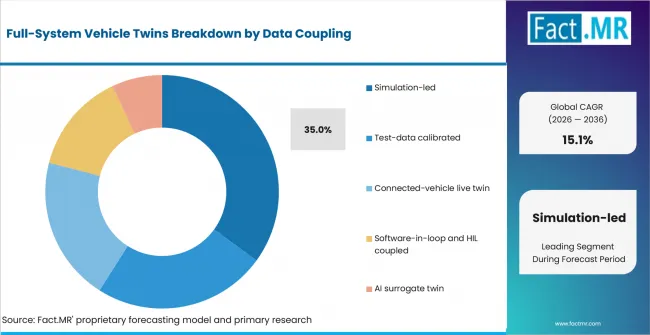
Full System Vehicle Twins Analysis By Data Coupling | Source: Fact.MR
Simulation-led coupling leads because many decisions occur before enough physical test data exists. Early vehicle programs need credible virtual models that can be calibrated later with proving-ground and bench results. Hexagon introduced Virtual Test Drive X in January 2025 as a cloud-native ADAS and autonomous-vehicle validation solution, reinforcing the role of simulation-led workflows in vehicle software testing.
What is accelerating Full-System Vehicle Twins Market adoption, and what is holding it back?
Demand is projected to rise through EV platform validation and software-defined vehicle programs. Adoption is constrained by model correlation, data ownership and tool-chain integration.
| DRIVER | (~) % IMPACT ON CAGR | GEOGRAPHIC RELEVANCE | IMPACT TIMELINE |
|---|---|---|---|
| Vehicle-level EV thermal and energy validation | +1.7% | Global | Short term (<= 2 years) |
| Software-defined vehicle architecture testing | +1.4% | Europe, East Asia, North America | Medium term (2-4 years) |
| ADAS and autonomy scenario validation | +1.2% | USA, Germany, Japan, South Korea | Medium term (2-4 years) |
| Manufacturing launch simulation and virtual commissioning | +0.8% | Europe, Asia Pacific | Long term (>= 4 years) |
Source: Fact.MR analysis. Updated Sep 5, 2026
- Vehicle-level EV thermal and energy validation: Full-system twins are expected to reduce late-cycle redesign when battery, cooling and power-management decisions affect the same vehicle platform.
- Software-defined vehicle architecture testing: Regional vehicle-software programs are expected to coordinate common test structures for AI-powered and connected vehicle technologies.
- ADAS and autonomy scenario validation: Scenario libraries are expected to raise demand for repeatable virtual evidence before unusual automated-vehicle designs expand on public roads.
- Manufacturing launch simulation: Vehicle twins are anticipated to help plants compare build sequence and quality risks before new electric platforms enter production.
| OPPORTUNITY | (~) % IMPACT ON CAGR | GEOGRAPHIC RELEVANCE | IMPACT TIMELINE |
|---|---|---|---|
| Live twins for connected service and diagnostics | +1.1% | North America, Europe, Japan | Medium term (2-4 years) |
| AI surrogate models for faster design iteration | +0.9% | Global | Long term (>= 4 years) |
| Shared SDV validation environments | +0.7% | Europe, South Korea, Japan | Short term (<= 2 years) |
Source: Fact.MR analysis. Updated Sep 5, 2026
- Live twins for connected service and diagnostics: Connected vehicles create operating data that is expected to make in-service twins useful for calibration updates and fault analysis.
- AI surrogate models: Engineering teams are projected to use faster reduced-order models where full-physics simulation slows early design comparison.
- Shared SDV validation environments: National and regional policy programs are expected to favor common test structures where OEMs compare vehicle software behavior across platforms.
| RESTRAINT | (~) % IMPACT ON CAGR | GEOGRAPHIC RELEVANCE | IMPACT TIMELINE |
|---|---|---|---|
| Weak model-to-test correlation | -0.6% | Global | Short term (<= 2 years) |
| Data ownership across OEM and supplier teams | -0.5% | Europe, North America, East Asia | Medium term (2-4 years) |
| Integration effort across legacy CAE and PLM tools | -0.4% | Global | Long term (>= 4 years) |
Source: Fact.MR analysis. Updated Sep 5, 2026
- Weak model-to-test correlation: Engineering teams are expected to delay wider deployment until simulated results match lab, proving-ground and fleet data within program tolerances.
- Data ownership across OEM and supplier teams: Full-system twins depend on structured access to design and test data that often remains split across program partners.
- Integration effort across legacy CAE and PLM tools: Older tool chains are expected to slow adoption when model exchange requires custom interfaces and manual rework.
Which countries are scaling the Full-System Vehicle Twins Market through 2036?
- The country comparison spans 3.57 percentage points and forms three practical growth bands across the forecast period.
- South Korea remains 0.95 percentage point above Germany because its future-mobility strategy links AI autonomy with domestic production goals.
- Germany remains 1.70 percentage points above the USA as electric passenger-car registrations push deeper vehicle-level validation.
- The USA remains 0.36 percentage point above the UK through automated-vehicle rules and cloud-based simulation capacity.
- The UK remains 0.56 percentage point above Japan because ZEV policy keeps battery and control-system validation in engineering plans.
- Japan closes the displayed range through Mobility DX policy and established hybrid platform development.
Comparable CAGRs create different entry conditions due to software maturity, policy pressure and OEM validation culture. Full report coverage includes North America, Latin America, Western Europe, Eastern Europe, East Asia, South Asia & Pacific, Middle East & Africa.
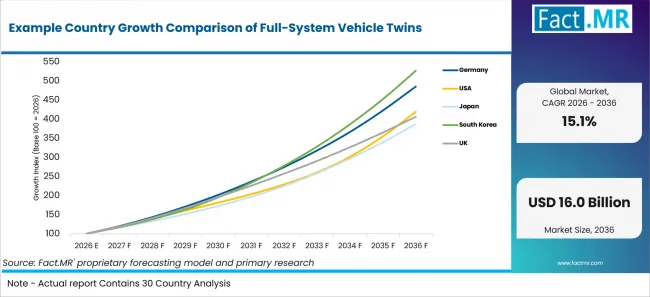
Example Country Growth Comparison Of Full System Vehicle Twins | Source: Fact.MR
| Country | CAGR |
|---|---|
| South Korea | 18.1% |
| Germany | 17.1% |
| USA | 15.4% |
| UK | 15.1% |
| Japan | 14.5% |
Source: Fact.MR analysis. Updated Sep 5, 2026
What supports South Korea adoption?
18.1% CAGR, supported by future-vehicle policy and export-facing development programs.
South Korea's outlook is anchored in export-facing vehicle programs and national future-mobility planning. MOTIR reported on February 6, 2026, that Korea’s automobile exports reached a record USD 72.0 billion in 2025. The K-Mobility Global Leadership Strategy calls for the development of standard platforms for Software-Defined Vehicles (SDVs) and AI-Defined Vehicles (AIDVs). At 18.1% CAGR, full-system twins gain relevance where export programs need consistent virtual evidence across energy systems and automated functions.
What supports Germany adoption?
17.1% CAGR, supported by EV production depth and whole-vehicle engineering demand.
Germany's adoption path is tied to EV registrations and established engineering software use. BMWE reported in January 2026 that BEV registrations jumped 43.2% to 545,142 vehicles in 2025. This expansion increases the relevance of full-system simulation and digital-twin workflows for evaluating battery, thermal and electrical/electronic architecture behavior during vehicle development. The 17.1% CAGR reflects demand for correlated models across passenger-car programs and supplier validation work.
What supports USA adoption?
15.4% CAGR, supported by automated-vehicle safety programs and electrified light-duty platforms.
USA demand is shaped by automated-vehicle safety work and electrified platform testing. The EIA reported in February 2026 that hybrid, battery electric and plug-in hybrid models represented about 22% of U.S. light-duty vehicle sales in 2025. On August 6, 2025, NHTSA issued the first-ever exemption for American-built vehicles under its expanded Automated Vehicle Exemption Program, covering Zoox driverless vehicles. These conditions are expected to support twin use across software validation, scenario testing and energy-management models.
What supports UK adoption?
15.1% CAGR, supported by zero-emission vehicle policy and specialist engineering services.
UK growth is linked to zero-emission vehicle rules and a mature engineering services base. The Department for Transport reported in April 2026 that 528,000 zero-emission vehicles were registered for the first time in the UK during 2025. Vehicle developers are expected to use full-system twins to test range, control software and service behavior before compliance deadlines shape platform decisions. The UK is projected to record 15.1% CAGR through 2036.
How does Japan perform?
14.5% CAGR, led by domestic SDV targets and hybrid-EV validation needs.
Japan's profile is tied to software-defined vehicle strategy and hybrid engineering. METI and MLIT updated the Mobility DX Strategy on June 9, 2025, retaining the goal for Japanese-affiliated companies to achieve a 30% share of global software-defined-vehicle unit sales in both 2030 and 2035. The 14.5% CAGR reflects demand for vehicle-level models that align battery, control and safety behavior across long-cycle platforms.
Who leads the Full-System Vehicle Twins Market?
Siemens is active through Simcenter, Teamcenter, Siemens Xcelerator and simulation technologies added through the Altair acquisition. Its portfolio combines multiphysics simulation with simulation and test data management across a connected digital thread.
Dassault Systèmes competes through the 3DEXPERIENCE platform, CATIA and SIMULIA. These technologies span design, multiphysics simulation and manufacturing workflows and support vehicle virtual-twin development.
Synopsys expanded its engineering simulation and analysis capabilities after completing the acquisition of Ansys in July 2025. Cadence participates in automotive simulation through capabilities acquired with Hexagon’s Design & Engineering business, including Virtual Test Drive for ADAS and autonomous-vehicle development and validation. AVL remains active in virtual vehicle development, testing and powertrain simulation.
Competitive differentiation centers on simulation breadth, solver capabilities and integration with engineering data and digital-thread environments. Platforms that connect physics-based models with software-in-the-loop, hardware-in-the-loop and physical testing workflows support more continuous verification and validation across vehicle development.
Which companies are the key providers?
Key companies include Siemens, Dassault Systèmes, Synopsys, AVL and Hexagon.
- Siemens, including Altair
- Dassault Systèmes
- Synopsys, including Ansys
- AVL
- Hexagon
Bibliography
- International Energy Agency. (2025, May 14). Global EV Outlook 2025.
- National Highway Traffic Safety Administration. (2025, August 6). NHTSA issues first-ever demonstration exemption to American-built automated vehicles.
- U.S. Energy Information Administration. (2026, February 9). Electric vehicle sales fell as hybrid vehicle sales continued to rise in 2025.
- European Commission. (2025, March 5). Industrial Action Plan for the European automotive sector (COM(2025) 95 final).
- Department for Transport. (2026, April 29). Vehicle licensing statistics: 2025.
- Ministry of Trade, Industry and Resources. (2026, January 15). Automobile exports hit record high of $72 billion in 2025.
- Ministry of Trade, Industry and Resources. (2025, November 14). K-Mobility drives the future of innovation.
- Federal Ministry for Economic Affairs and Energy. (2026, January 27). Great prospects for electric mobility.
- Ministry of Economy, Trade and Industry. (2025, June 9). Mobility Digital Transformation (DX) Strategy updated.
- Siemens. (2025, March 26). Siemens acquires Altair to create most complete AI-powered portfolio of industrial software.
- Dassault Systèmes. (2025, February 4). Dassault Systèmes and Volkswagen Group implement the 3DEXPERIENCE platform to optimize vehicle development.
- Synopsys. (2025, July 17). Synopsys completes acquisition of Ansys.
- Hexagon. (2025, January 8). Hexagon ramps up ADAS software innovation with cloud-native quality test automation solution.
This Report Answers
- The report explains where full-system vehicle twins are used across twin scope, lifecycle stage, vehicle type and data coupling.
- Segment analysis identifies the leading subsegments and the engineering reasons OEMs prioritize them.
- Country analysis examines the listed markets and the policy or production mechanisms supporting vehicle-twin deployment.
- Competitive analysis reviews current providers across simulation, PLM, ADAS validation and digital-thread integration.
- Application analysis assesses how model correlation and live data influence software selection during vehicle programs.
What does the Full-System Vehicle Twins Market cover?
The Full-System Vehicle Twins Market covers software environments that model full-vehicle behavior before and after hardware testing. Adjacent technology layers include digital twin platforms, automotive simulation software and automotive software platforms where engineering teams link models to product data.
The assessment covers multiphysics vehicle models and powertrain-energy twins. The coverage adds E and E architecture twins, ADAS and autonomy twins, and manufacturing-lifecycle twins. The data-coupling view includes simulation-led twins and test-data calibrated twins. The view extends to connected live-twin, software-in-loop, HIL-coupled and AI surrogate approaches.
What is included in the scope?
The scope includes licensed software, subscription platforms and managed engineering environments where full-vehicle behavior is modeled across design, validation and operation. Included workflows overlap with connected car systems, automotive operating systems, zonal wiring harness platforms and OTA-capable control units when models test software, data flow and vehicle behavior together.
It includes vehicle-level digital twin environments used by passenger-car OEMs and commercial-vehicle developers. The same scope covers EV-only platform teams, off-highway manufacturers and performance vehicle engineering groups.
What is excluded from the scope?
The scope excludes standalone CAD tools and isolated component simulation. Raw sensor hardware, base PLM licenses and general cloud infrastructure are excluded when sold apart from a vehicle-level twin workflow. Broader references such as ADAS central controller platforms, synthetic driving scenarios and digital twin sensors are relevant where they support validation or data-coupling context.
Automotive manufacturing execution software is outside the scope when it only tracks shop-floor operations. General fleet telematics platforms are excluded when they lack vehicle-level modelling, simulation or validation functions.
How Was the Analysis Built?
The analysis draws on 120+ sources, 35+ company portfolios, 25+ countries, and more than 20 industry interviews.
- Primary Research: Primary research includes discussions with manufacturers, service providers, technology developers, distributors, end users, and subject-matter experts. These conversations examine purchasing priorities, product adoption, operational challenges, approval requirements, competitive positioning, and the factors that influence wider market acceptance.
- Desk Research: Desk research covers government statistics, regulatory publications, company filings, trade data, technical studies, industry associations, standards, public policy, and other authoritative sources. Every source used in the analysis is documented in the bibliography.
- Market Sizing and Forecasting: Market estimates combine historical performance, demand indicators, pricing and volume trends, segment shares, company participation, country-level growth, adoption patterns, investment activity, and barriers to market expansion.
- Data Validation and Update Cycle: Findings are validated by comparing primary interviews with public data, company activity, regulatory changes, trade patterns, and industry developments. Regular updates review new product launches, capacity changes, partnerships, approvals, and shifts in commercial adoption.
Segmentation
What is the report’s scope and coverage?
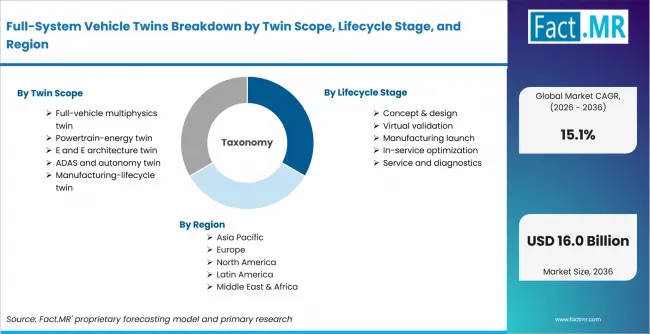
Full System Vehicle Twins Breakdown By Twin Scope, Lifecycle Stage, And Region | Source: Fact.MR
| Attribute | Details |
|---|---|
| Quantitative Units | USD billion |
| Market Definition | Vehicle-level digital twin software and engineering environments used to model, validate and optimize full vehicle behavior across design, simulation, testing and operation. |
| Twin Scope | Full-vehicle multiphysics twin; Powertrain-energy twin; E and E architecture twin; ADAS and autonomy twin; Manufacturing-lifecycle twin |
| Lifecycle Stage | Concept & design; Virtual validation; Manufacturing launch; In-service optimization; Service and diagnostics |
| Vehicle Type | Passenger cars; Commercial vehicles; EV-only platforms; Off-highway; Performance and specialty |
| Data Coupling | Simulation-led; Test-data calibrated; Connected-vehicle live twin; Software-in-loop and HIL coupled; AI surrogate twin |
| Regions Covered | North America; Latin America; Western Europe; Eastern Europe; East Asia; South Asia & Pacific; Middle East & Africa |
| Countries Covered | South Korea; Germany; USA; UK; Japan |
| Key Companies Profiled | Siemens; Dassault Systèmes; Synopsys; AVL; Hexagon |
| Forecast Period | 2026 to 2036 |
| Approach | Hybrid top-down and bottom-up approach using vehicle engineering spend, simulation deployment, OEM platform mix, country adoption and provider portfolio review. |
Source: Fact.MR analysis. Updated Sep 5, 2026
How is the market segmented?
-
By Twin Scope
- Full-vehicle multiphysics twin
- Powertrain-energy twin
- E and E architecture twin
- ADAS and autonomy twin
- Manufacturing-lifecycle twin
-
By Lifecycle Stage
- Concept & design
- Virtual validation
- Manufacturing launch
- In-service optimization
- Service and diagnostics
-
By Vehicle Type
- Passenger cars
- Commercial vehicles
- EV-only platforms
- Off-highway
- Performance and specialty
-
By Data Coupling
- Simulation-led
- Test-data calibrated
- Connected-vehicle live twin
- Software-in-loop and HIL coupled
- AI surrogate twin
-
By Region
- North America
- Latin America
- Western Europe
- Eastern Europe
- East Asia
- South Asia & Pacific
- Middle East & Africa
Frequently Asked Questions
How big is the full-system vehicle twins market in 2026?
What is the CAGR of the full-system vehicle twins market from 2026 to 2036?
Which twin scope leads the full-system vehicle twins market?
Which vehicle type leads the full-system vehicle twins market?
Who are the leading companies in the full-system vehicle twins market?
Who worked on this report


Preview the report firsthand - request a free sample
Free SampleGet the brochure for pricing and purchase details
Download PDF