- Market Value (2025): USD 3.4 Bn
- Estimated Value (2026): USD 3.9 Bn
- Forecast Value (2036): USD 13.3 Bn
- CAGR (2026-2036): 13.2%
What is the Proactive Grid Monitors Market forecast to be worth by 2036?
USD 3.9 billion in 2026 to USD 13.3 billion by 2036 at a 13.2% CAGR.
- The Proactive Grid Monitors Market reached USD 3.4 billion in 2025.
- Demand is projected to increase from USD 3.9 billion in 2026 to USD 13.3 billion by 2036.
- The market is forecast to record 13.2% CAGR from 2026 to 2036 as utility operators and industrial grid owners use condition data to reduce unplanned outages.
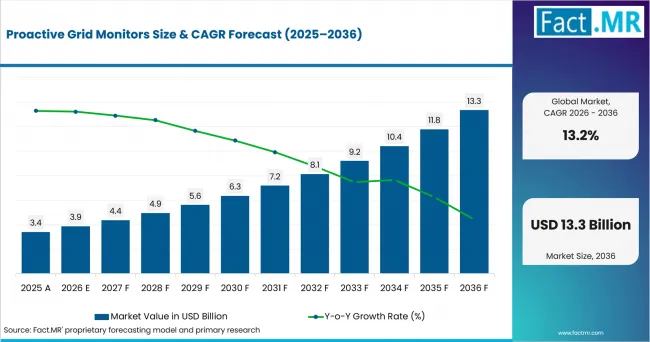
Proactive Grid Monitors Value Analysis | Source: Fact.MR
What are the defining numbers behind Proactive Grid Monitors Market growth?
An absolute opportunity of USD 9.4 billion is expected between 2026 and 2036.
- Demand Drivers in the Market
- Utility operations teams need live asset-health visibility because older substations face heavier switching duty and shorter inspection windows.
- Distribution planners need feeder-level load data as the U.S. Energy Information Administration said in January 2026 that U.S. electricity use is expected to grow by 1% in 2026.
- Transmission operators need dynamic line and substation signals due to renewable flows that change faster than manual inspection cycles.
- Industrial energy managers need waveform and temperature monitoring where private grids support continuous production and sensitive power electronics.
- Field-service teams need earlier fault location because remote alerts shorten patrol time and help crews act before failures spread.
- Key Segments Analyzed
- By Monitoring Layer: Substation condition monitoring is expected to hold 28.0% share in 2026 because substations concentrate transformers, protection gear and switchgear in one operating point.
- By Sensor Data: Electrical waveform is projected to account for 26.0% share in 2026 as utilities track harmonics, transient events and protection behavior.
- By Grid Segment: Distribution grid is anticipated to represent 43.0% share in 2026 due to feeder congestion and last-mile electrification pressure.
- By Analytics: Predictive analytics is estimated to capture 31.0% share in 2026 since operators want maintenance warnings before alarms become outage events.
- Analyst Opinion at Fact.MR
- Shambhu Nath Jha, Principal Consultant at Fact.MR, states, “The market is gaining attention because grid teams need early warning systems that connect sensor data with action. Spending is expected to move toward platforms that show asset health and operating risk in one view. Suppliers should combine durable sensors, secure communications and plain maintenance workflows so operators trust alerts during real events.”
- Strategic Implications
- Utility operators should align sensor placement with feeder loading, transformer age and outage history before scaling monitoring networks.
- Grid-automation vendors should connect monitor data with SCADA, protection relays and work-order systems so alerts lead to field action.
- Software providers should explain predictive models in plain maintenance terms because utility engineers need confidence in every risk score.
- Project developers should map monitoring upgrades to DOE grid-funding requirements after the U.S. Department of Energy announced an approximately USD 1.9 billion SPARK funding opportunity in March 2026 for advanced transmission and grid infrastructure upgrades.
Italy is projected to record 16.3% CAGR through 2036 due to transmission digitalisation and real-time grid data. France is expected to post 15.8% CAGR as electrification planning raises the value of monitored substations. Germany is forecast to advance at 14.0% CAGR owing to renewable capacity growth and grid expansion. The UK is anticipated to reach 12.8% CAGR as connections reform lifts demand for network visibility. The USA is estimated to hold 12.3% CAGR because data-center load growth increases the need for feeder and substation intelligence.
How does the Proactive Grid Monitors Market break down by segment?
Distribution grid is projected to lead Grid Segment at 43.0% share in 2026; while Predictive analytics leads Analytics at 31.0% share.
Which Monitoring Layer dominates?
Substation condition monitoring is expected to hold 28.0% share in 2026.
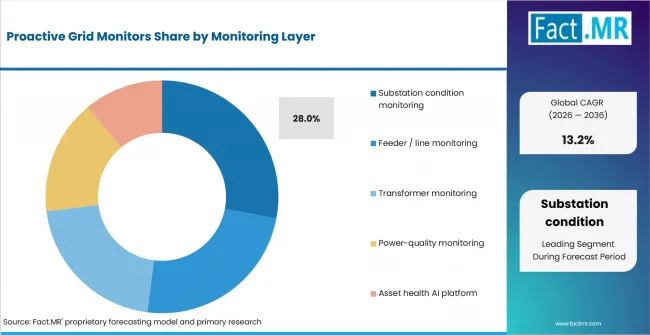
Proactive Grid Monitors Analysis By Monitoring Layer | Source: Fact.MR
Substation condition monitoring is expected to lead Monitoring Layer because transformers, breakers and protection panels concentrate high-value grid risk. Operators combine thermal checks, partial-discharge signals and equipment alarms at one site. Hitachi Energy launched HMAX Energy in March 2026 for critical energy infrastructure, including transformers, switchgear and substations. That platform direction supports the shift toward asset-health monitoring linked to maintenance decisions.
What leads the Sensor Data segment?
Electrical waveform is projected to account for 26.0% share in 2026.
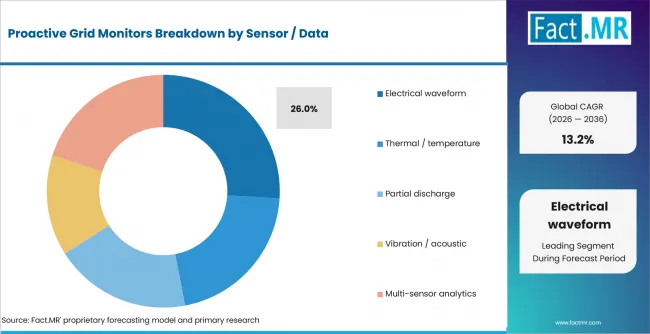
Proactive Grid Monitors Analysis By Sensor Data | Source: Fact.MR
Electrical waveform monitoring is projected to lead Sensor Data because utilities need clearer evidence of harmonics, transient faults and protection trips. Waveform data helps engineers connect short events with equipment stress before a broad alarm appears. Siemens said in December 2025 that IBC Energie Wasser Chur would equip 200 transformer stations and 290 distribution cabinets with smart, bidirectional SENTRON 3NA6 COM fuses and SICAM Enhanced Grid sensors. That development shows why waveform and feeder data are moving into daily distribution work.
How does Grid Segment shape demand?
Distribution grid is anticipated to represent 43.0% share in 2026.
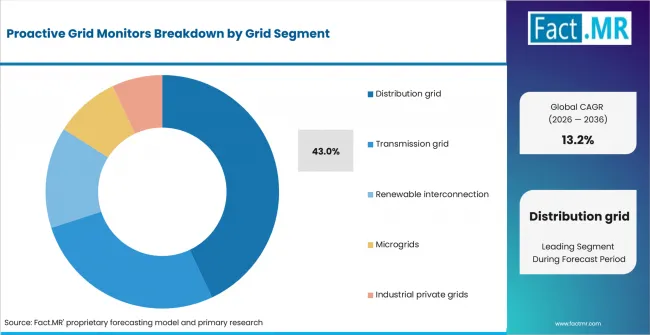
Proactive Grid Monitors Analysis By Grid Segment | Source: Fact.MR
Distribution grid demand is anticipated to stand ahead because local feeders absorb electrified heat, vehicle charging, rooftop solar and new industrial load. Operators need visibility close to customers where congestion appears first. Digital field data is expected to support broader distribution automation and proactive fault detection.
What supports Predictive Analytics within Analytics?
Predictive analytics is estimated to capture 31.0% share in 2026.
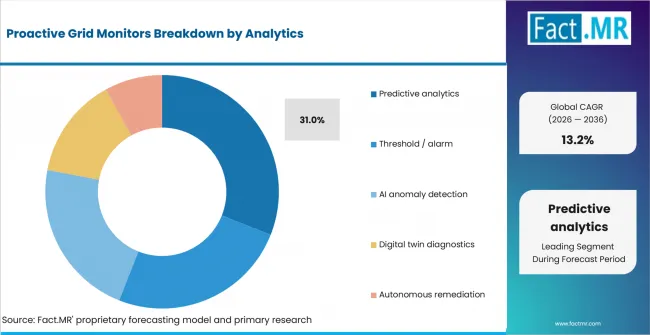
Proactive Grid Monitors Analysis By Analytics | Source: Fact.MR
Predictive analytics is estimated to lead Analytics because utilities want warnings that rank asset risk before a fault becomes visible in operations. Algorithms compare temperature, waveform and vibration signals against known failure behavior. In September 2025, ABB said it had expanded the generative AI capabilities of its Genix Asset Performance Management solution through Genix APM Copilot. That development reinforces the move toward proactive service planning.
What is accelerating Proactive Grid Monitors Market adoption, and what is holding it back?
Grid visibility drives it; integration complexity restrains it.
Drivers Impact Analysis
| DRIVER | (~) % IMPACT ON CAGR | GEOGRAPHIC RELEVANCE | IMPACT TIMELINE |
|---|---|---|---|
| Substation asset-health visibility | +1.8% | North America, Western Europe | Short term (<= 2 years) |
| Distribution feeder congestion | +1.5% | Global | Medium term (2-4 years) |
| Data-center and industrial load growth | +1.2% | USA, UK, France | Medium term (2-4 years) |
Source: Fact.MR analysis. Updated Sep 10, 2026
Opportunity Impact Analysis
| OPPORTUNITY | (~) % IMPACT ON CAGR | GEOGRAPHIC RELEVANCE | IMPACT TIMELINE |
|---|---|---|---|
| Predictive asset-health platforms | +1.3% | Global | Medium term (2-4 years) |
| Dynamic line and thermal monitoring | +1.0% | Europe, North America | Long term (>= 4 years) |
| Remote fault-location tools | +0.6% | North America, Europe | Short term (<= 2 years) |
Source: Fact.MR analysis. Updated Sep 10, 2026
Restraints Impact Analysis
| RESTRAINT | (~) % IMPACT ON CAGR | GEOGRAPHIC RELEVANCE | IMPACT TIMELINE |
|---|---|---|---|
| Integration with legacy control systems | -0.7% | Global | Short term (<= 2 years) |
| Cybersecurity review for grid data | -0.5% | North America, Europe | Medium term (2-4 years) |
| Regulated investment timing | -0.3% | UK, Italy, France | Long term (>= 4 years) |
Source: Fact.MR analysis. Updated Sep 10, 2026
Which countries are scaling the Proactive Grid Monitors Market through 2036?
- The country comparison spans 4.0 percentage points and forms three practical growth bands across the forecast period.
- Italy remains 0.5 percentage point above France due to transmission digitalisation and real-time grid data.
- France remains 1.8 percentage points above Germany as electrification planning raises the value of monitored substations.
- Germany remains 1.2 percentage points above the UK because renewable capacity additions require wider feeder and substation visibility.
- The UK remains 0.5 percentage point above the USA as connections reform lifts demand for network visibility.
- The USA closes the displayed range due to data-center load growth and federal smart-grid funding.
Comparable CAGRs create different entry conditions due to grid age, network reinforcement timing and utility data maturity. Full report coverage includes North America, Latin America, Western Europe, Eastern Europe, East Asia, South Asia & Pacific, Middle East & Africa.
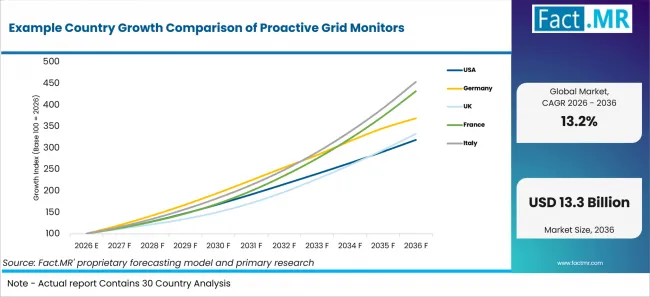
Example Country Growth Comparison Of Proactive Grid Monitors | Source: Fact.MR
| Country | CAGR |
|---|---|
| Italy | 16.3% |
| France | 15.8% |
| Germany | 14.0% |
| United Kingdom | 12.8% |
| United States | 12.3% |
Source: Fact.MR analysis. Updated Sep 10, 2026
How is Italy scaling demand?
16.3% CAGR, supported by transmission digitalisation and real-time grid data.
Italy’s grid operators are adding monitoring depth as Terna digitises transmission links and renewable flows reach local nodes. The market is projected to record 16.3% CAGR through 2036. Terna wrote in May 2026 that its fibre optic network covers 46,000 kilometres across the national transmission grid. That communication base gives control systems a stronger path for real-time substation and line data.
What supports France adoption?
15.8% CAGR, backed by electrification planning and transmission investment.
France is moving toward monitoring-led grid reinforcement as electrification projects and data-center connections enter transmission planning. The market is forecast to post 15.8% CAGR through 2036. CRE published on March 9, 2026, its February 26 decision approving RTE’s 2026 investment programme at EUR 4.24 billion. That spending path makes substation condition monitoring and predictive diagnostics more relevant for operators handling higher connection pressure.
What is supporting Germany’s adoption?
14.0% CAGR, driven by renewable capacity growth and grid expansion.
Germany’s monitoring need is tied to renewable expansion and new high-voltage routes that alter power flows between regions. The market is anticipated to advance at 14.0% CAGR through 2036. Bundesnetzagentur reported in January 2026 that renewable installed capacity increased by nearly 21 GW in 2025. The same operating shift makes waveform and thermal monitoring useful for substations and feeders.
How does the United Kingdom perform?
12.8% CAGR, supported by connections reform and network planning.
The United Kingdom is reshaping connections policy so ready projects align more closely with the national power plan. The market is estimated to register 12.8% CAGR through 2036. The Department for Energy Security and Net Zero stated in its April 2025 connections reform annex that, subject to Ofgem’s final decision, raising entry requirements and aligning capacity with the Clean Power Action Plan could release approximately 500 GW of capacity on the network and reduce the connections queue by around two-thirds. That queue reset points utilities toward monitor data that supports faster network study and operating confidence.
What supports USA adoption?
12.3% CAGR, led by data-center load growth and federal grid funding.
U.S. utilities face load growth from data centers and manufacturing sites that require faster local visibility on constrained feeders. The market is expected to hold 12.3% CAGR through 2036. EIA said on March 25, 2026 that it had identified 196 companies operating data centers across Texas, Washington state, and the Northern Virginia–Washington, DC region for three voluntary pilot field studies of data-center energy use. The pilot is intended to improve EIA’s collection of data on data-center energy consumption and operating characteristics.
Who leads the Proactive Grid Monitors Market?
GE Vernova and Siemens offer direct grid-monitoring and automation solutions, while Hitachi Energy and ABB provide asset-health and predictive-analytics capabilities.
GE Vernova participates through GridBeats and related grid-automation solutions that combine software-defined protection, automation and control with monitoring and communications capabilities. Siemens supports distribution-grid monitoring through Electrification X, SICAM Enhanced Grid Sensors and communication-capable SENTRON 3NA6 COM NH fuses used in transformer stations and distribution cabinets.
Hitachi Energy supports asset-health monitoring through HMAX Energy, which uses connected-asset data, diagnostics and AI-enabled health assessments to identify early signs of equipment degradation. Its scope covers primary energy infrastructure including switchgear, transformers, substations, HVDC systems and power-quality solutions.
Schneider Electric provides electrical asset-performance management, condition-based maintenance and monitoring services for critical infrastructure. ABB provides Genix APM and predictive asset analytics for industrial and utility environments, supporting early detection of equipment problems and proactive maintenance. SEL strengthens the field and automation layer through fault indicators and sensors, automation controllers and communications products.
Across these suppliers, product portfolios emphasize asset-health monitoring, predictive diagnostics, secure communications, cybersecurity, distribution automation and integration with utility monitoring and control environments.
Which companies are the key providers?
Key companies include GE Vernova, Siemens, Hitachi Energy, Schneider Electric, ABB, and SEL.
- GE Vernova
- Siemens
- Hitachi Energy
- Schneider Electric
- ABB
- SEL
Bibliography
- ABB. (2025, September 26). Genix APM Copilot transforms asset performance with AI.
- Bundesnetzagentur. (2026, January 8). Growth in renewable energy in 2025.
- Commission de régulation de l’énergie. (2026, March). La CRE approuve le programme d’investissements de RTE pour l’année 2026, pour un montant de 4,24 milliards d’euros, conforme avec la trajectoire retenue par la CRE dans sa décision sur le tarif d’utilisation des réseaux publics d’électricité (TURPE 7).
- Department for Energy Security and Net Zero. (2025, April 15). Clean Power 2030 Action Plan: A new era of clean electricity – connections reform annex (updated April 2025). GOV.UK.
- Department for Energy Security and Net Zero, National Cyber Security Centre, National Energy System Operator, & Ofgem. (2026, May 28). Energy sector cyber security strategy. GOV.UK.
- GE Vernova. (2026, February 3). GE Vernova expands its Grid Automation portfolio with a new solution for modern grids.
- Hitachi Energy. (2026, March 23). Hitachi launches HMAX Energy, a pioneering AI-powered service and solution suite for critical energy infrastructure.
- Ofgem. (2025, December 4). RIIO-3 final determinations for the electricity transmission, gas distribution and gas transmission sectors.
- Schneider Electric. (2025, November 19). Schneider Electric transforms U.S. asset performance management services to deliver integrated, proactive experience to simplify critical infrastructure management.
- Schweitzer Engineering Laboratories. (2025, March 24). SEL introduces the LINAM UGFI Underground Fault Indicator.
- Siemens. (2025, December 11). Siemens boosts grid availability with comprehensive transparency.
- Terna. (2026, May 26). Energy and data: The invisible grid behind the transition.
- U.S. Department of Energy. (2026, March 12). Energy Department announces $1.9B investment in critical grid infrastructure to reduce electricity costs.
- U.S. Energy Information Administration. (2026a, January 13). EIA forecasts strongest four-year growth in U.S. electricity demand since 2000, fueled by data centers.
- U.S. Energy Information Administration. (2026b, March 25). EIA launches pilot survey on energy use at data centers.
- U.S. Energy Information Administration. (2026c, March 12). Fossil generation could rise with faster-than-expected growth in data center power demand.
This Report Answers
- The report explains where proactive grid monitors are used across monitoring layer and sensor-data type.
- Segment analysis identifies the 2026 leaders and the operating reasons utilities prioritize them.
- Country analysis examines the USA, Germany, the UK, France and Italy through grid-policy and investment signals.
- Competitive analysis reviews GE Vernova, Siemens, Hitachi Energy, Schneider Electric, ABB and SEL.
- Technology assessment covers substation condition monitoring, feeder line monitoring, transformer monitoring and power-quality monitoring.
What does the Proactive Grid Monitors Market cover?
The Proactive Grid Monitors Market covers sensor-enabled systems and analytics used to detect asset stress before faults spread across power networks. It includes equipment and software that read waveform, temperature, partial-discharge, vibration and multi-sensor data.
The assessment differs from broader smart grid sensors coverage because it focuses on proactive asset and grid-condition monitoring. It also intersects with electric power distribution automation systems and utility analytics platforms when live grid data feeds maintenance and operating decisions.
What is included in the scope?
The scope includes substation monitors, feeder sensors, line devices, transformer monitors and asset-health analytics used by utilities and private-grid owners.
It includes current sensor applications where current readings support fault or load visibility. Dynamic line rating sensors are included when they support proactive thermal monitoring. Instrument transformers and Volt VAR management systems are included only when monitor data is part of a proactive grid-health workflow.
What is excluded from the scope?
The scope excludes standalone transmission hardware and general power equipment sold separately from proactive monitoring capability.
Broader electric power transmission distribution equipment is outside the scope unless sensor data is packaged with operating diagnostics.
The scope excludes solid-state transformers as power-conversion assets and microgrid service models as service packages. They fall within scope only when monitor hardware or analytics is supplied as a defined part of the grid-health system.
How Was the Analysis Built?
The analysis draws on 120+ sources, 35+ company portfolios, 25+ countries, and more than 20 industry interviews.
- Primary Research: Primary research includes discussions with manufacturers, service providers, technology developers, distributors, end users, and subject-matter experts. These conversations examine purchasing priorities, product adoption, operational challenges, approval requirements, competitive positioning, and the factors that influence wider market acceptance.
- Desk Research: Desk research covers government statistics, regulatory publications, company filings, trade data, technical studies, industry associations, standards, public policy, and other authoritative sources. Every source used in the analysis is documented in the bibliography.
- Market Sizing and Forecasting: Market estimates combine historical performance, demand indicators, pricing and volume trends, segment shares, company participation, country-level growth, adoption patterns, investment activity, and barriers to market expansion.
- Data Validation and Update Cycle: Findings are validated by comparing primary interviews with public data, company activity, regulatory changes, trade patterns, and industry developments. Regular updates review new product launches, capacity changes, partnerships, approvals, and shifts in commercial adoption.
Segmentation
What is the report’s scope and coverage?
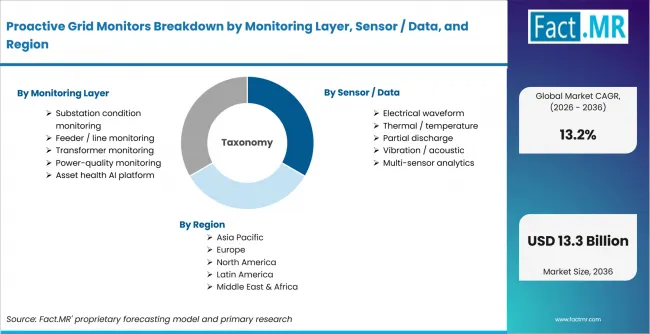
Proactive Grid Monitors Breakdown By Monitoring Layer, Sensor Data, And Region | Source: Fact.MR
| Attribute | Details |
|---|---|
| Quantitative Units | USD billion |
| Market Definition | Hardware, sensors, communications and analytics used to monitor grid assets before faults escalate, including substation condition monitoring, feeder and line monitoring, transformer monitoring, power-quality monitoring and asset-health AI platforms. |
| Monitoring Layer | Substation condition monitoring; Feeder line monitoring; Transformer monitoring; Power-quality monitoring; Asset health AI platform |
| Sensor Data | Electrical waveform; Thermal temperature; Partial discharge; Vibration acoustic; Multi-sensor analytics |
| Grid Segment | Transmission grid; Distribution grid; Renewable interconnection; Microgrids; Industrial private grids |
| Analytics | Threshold alarm; Predictive analytics; AI anomaly detection; Digital twin diagnostics; Autonomous remediation |
| Regions Covered | North America; Latin America; Western Europe; Eastern Europe; East Asia; South Asia & Pacific; Middle East & Africa |
| Countries Covered | United States; Germany; United Kingdom; France; Italy |
| Key Companies Profiled | GE Vernova; Siemens; Hitachi Energy; Schneider Electric; ABB; SEL |
| Forecast Period | 2026 to 2036 |
| Approach | Hybrid top-down and bottom-up approach using grid investment signals, monitor deployment layers, sensor-data mix, grid-segment use cases, analytics adoption and provider portfolio review. |
Source: Fact.MR analysis. Updated Sep 10, 2026
How is the market segmented?
-
By Monitoring Layer
- Substation condition monitoring
- Feeder / line monitoring
- Transformer monitoring
- Power-quality monitoring
- Asset health AI platform
-
By Sensor Data
- Electrical waveform
- Thermal / temperature
- Partial discharge
- Vibration / acoustic
- Multi-sensor analytics
-
By Grid Segment
- Transmission grid
- Distribution grid
- Renewable interconnection
- Microgrids
- Industrial private grids
-
By Analytics
- Threshold / alarm
- Predictive analytics
- AI anomaly detection
- Digital twin diagnostics
- Autonomous remediation
-
By Region
- North America
- Latin America
- Western Europe
- Eastern Europe
- East Asia
- South Asia & Pacific
- Middle East & Africa
Frequently Asked Questions
How big is the proactive grid monitors market in 2026?
What is the CAGR of the proactive grid monitors market from 2026 to 2036?
Which monitoring layer leads the proactive grid monitors market?
Which grid segment leads the proactive grid monitors market?
Who are the leading companies in the proactive grid monitors market?
Who worked on this report


Preview the report firsthand - request a free sample
Free SampleGet the brochure for pricing and purchase details
Download PDF