- Market Value (2025): USD 37.7 Bn
- Estimated Value (2026): USD 40.4 Bn
- Forecast Value (2036): USD 82.3 Bn
- CAGR (2026-2036):7.4%
What is the Digital Imaging Market forecast to be worth by 2036?
USD 40.4 Billion in 2026 to USD 82.3 Billion by 2036, at a 7.4% CAGR.
- As per Fact.MR analysis, the digital imaging market reached USD 37.7 Billion in 2025.
- Demand will increase from USD 40.4 Billion in 2026 to USD 82.3 Billion in 2036.
- The market is forecast to record a 7.4% CAGR during 2026 to 2036 driven by widespread adoption of AI-driven computer vision across automated factory floors, expanding diagnostic radiology procedure volumes in modern healthcare, increasing deployment of autonomous aerial drones, and growing demand for 3D volumetric inspection across semiconductor manufacturing.
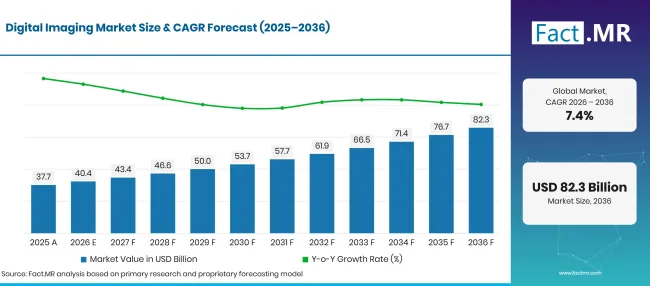
Digital Imaging Market Forecast Global | Source: Fact.MR
| Year | Basis | Market Value (USD Billion) |
|---|---|---|
| 2025 | Actual | 37.7 |
| 2026 | Estimate | 40.4 |
| 2036 | Forecast | 82.3 |
| CAGR 2026 to 2036 | Forecast period | 7.4% |
Source: Fact.MR analysis. Updated Oct 23, 2026
What are the defining numbers behind Digital Imaging Market growth?
USD 41.9 Billion absolute chance between 2026 and 2036, with hardware components, healthcare applications, and 2D/3D technologies generating the primary market momentum.
- Demand Drivers in the Market
- The FDA’s radiology-device rules list full-field digital mammography systems under 21 CFR § 892.1715 and computed tomography X-ray systems under § 892.1750, creating defined federal classifications for two core digital-imaging modalities [1]. This framework sustains compliance demand for detectors, reconstruction systems, quality-assurance instruments, and clinical image-management platforms.
- FCC Part 15 sets conducted-emission limits for AC-powered unintentional radiators across 0.15 MHz to 30 MHz in § 15.107 and radiated-emission limits beginning at 30 MHz in § 15.109 [2]. Industrial cameras, embedded processors, and high-speed imaging interfaces therefore require electromagnetic-compatibility engineering as edge-processing density and data rates increase.
- A 2026 PubMed-indexed benchmark evaluated 24 automated chest X-ray report-generation models on 10,000 studies collected across 67 sites; even the leading systems produced error-free reports for fewer than 45% of abnormal examinations [3]. The performance gap reinforces demand for higher-quality image acquisition, standardized metadata, rigorous validation datasets, and clinically controlled AI-imaging workflows.
- The International Federation of Robotics reported 542,000 industrial robots installed worldwide in 2024, while the global operational stock reached 4.664 million units [4]. This expanding automated equipment base increases the addressable need for digital cameras, depth sensors, metrology optics, and real-time visual inspection on production lines.
- Key Segments Analyzed
- By Component: Hardware (CMOS Sensors, Lenses, Cameras) holds 58.3% share in 2026, driven by high-value investments in stacked CMOS focal plane arrays, telecentric precision optics, high-throughput machine vision cameras, and integrated illumination strobes.
- By Application: Healthcare accounts for 37.0% share in 2026, underpinned by expanding clinical adoption of digital radiography, magnetic resonance imaging, optical coherence tomography, and intraoperative surgical visualization.
- By Technology: 2D Imaging holds 48.1% share in 2026, maintaining foundational dominance in high-speed optical inspection, barcode reading, document scanning, and general diagnostic photography due to mature sensor architectures and cost-effective deployment.
- By End-User: Manufacturing accounts for 23.4% share in 2026, propelled by zero-defect manufacturing mandates across semiconductor, automotive, aerospace, and consumer electronics assembly lines.
- Analyst Opinion at Fact.MR
- Shambhu Nath Jha, Lead Consultant at Fact.MR, states, “The digital imaging ecosystem is undergoing an architectural convergence driven by stacked sensor architectures, edge AI acceleration, and volumetric 3D optical metrology. Industrial fabricators and clinical institutions are transitioning from passive image acquisition to active visual cognition, where cameras execute deep learning inferences directly at the edge. Component manufacturers who successfully co-package high-bandwidth memory with stacked CMOS sensing arrays and open-source computer vision APIs will capture lucrative long-term contracts across automated manufacturing and surgical robotics domains.”
- Strategic Implications
- A 2025 imaging-utilization study modeled 348,214,053 insured person-years and projected that U.S. imaging use in 2055 could be 16.9% to 26.9% above 2023 levels if current per-person utilization persists [5]. Population growth accounted for 73% to 88% of the projected increase across modalities, reinforcing long-term demand for efficient acquisition hardware, reconstruction software, and scalable image-management infrastructure.
- Camera manufacturers are standardizing unified software development kits (SDKs) and open computer vision architectures compatible with GenICam, OpenCV, and major cloud analytics platforms. Providing hardware-agnostic API libraries simplifies third-party software integration, accelerating application development cycles for machine builders and medical equipment OEMs.
- Lens fabricators are expanding the production of liquid lenses and motorized autofocus optics featuring piezoelectric micro-actuators. Sourcing managers lock in forward supply agreements for optical-grade polymers and specialized anti-reflective dielectric coatings to meet surging demand for rapid-focus industrial barcode readers and automated pharmaceutical packaging verifiers.
- System integrators are developing hybrid imaging platforms that combine visible RGB spectrum sensing with short-wavelength infrared (SWIR) and thermal spectral channels. Multi-spectral imaging arrays allow industrial food processors and semiconductor packaging facilities to detect subsurface moisture, internal silicon cracks, and foreign material contamination invisible to standard monochrome cameras.
Germany is projected to record an industry-leading 8.3% CAGR, propelled by world-class industrial automation, machine vision leadership, and heavy Industry 4.0 capital expenditures. Brazil advances at a 7.6% CAGR, driven by modernizing agricultural drone monitoring, expanding diagnostic healthcare networks, and industrial factory automation. The United States records a 6.8% CAGR, anchored by massive biomedical research expenditures, advanced aerospace defense imaging, and booming semiconductor fab construction. The United Kingdom registers a 6.1% CAGR, supported by public healthcare imaging upgrades and artificial intelligence research hubs. Japan records a 5.4% CAGR, rooted in premier precision optical manufacturing, robotics dominance, and high-resolution camera innovation.
How does the Digital Imaging Market break down by segment?
Hardware 58.3%; Healthcare 37.0%; 2D Imaging 48.1%; Manufacturing 23.4% in 2026.
Which Component dominates?
Hardware holds 58.3% share in 2026.
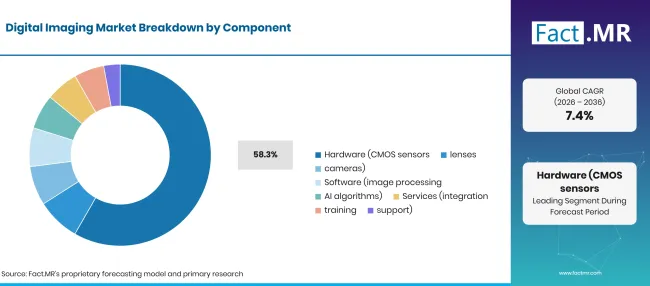
Digital Imaging Market Breakdown Component | Source: Fact.MR
| Component | Share (2026) |
|---|---|
| Hardware (CMOS Sensors, Lenses, Cameras) (Leading segment) | 58.3% |
| Other segments combined (Software, Services) | 41.7%* |
| Total | 100.0% |
Source: Fact.MR analysis. Updated Oct 23, 2026
Hardware components represent nearly six-tenths of total digital imaging market value, reflecting substantial capital expenditure requirements for precision physical optics, image sensors, camera housings, and lighting controllers. Sourcing directors allocate the largest proportion of hardware budgets to high-performance CMOS image sensors featuring stacked global shutters that eliminate motion blur on fast-moving conveyor belts. Machine vision system builders pair these sensors with specialized telecentric lenses that maintain constant magnification across varying object depths, ensuring precise dimensional measurements in semiconductor metrology. In medical environments, endoscopy suites invest in miniature CMOS sensor heads integrated into flexible catheter tips for minimally invasive visualization. As automated inspection demands grow, engineering teams combine hardware capture with volumetric 3D imaging sensors to generate dense point clouds of complex mechanical assemblies. Sourcing managers also procure high-linearity precision optical sensors to regulate automated strobe lighting and laser profiling lines.
What leads the Application segment?
Healthcare accounts for 37.0% share in 2026.
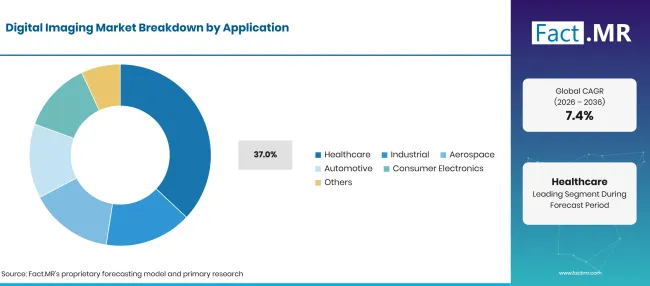
Digital Imaging Market Breakdown Application | Source: Fact.MR
| Application | Share (2026) |
|---|---|
| Healthcare (Leading segment) | 37.0% |
| Other segments combined | 63.0%* |
| Total | 100.0% |
Source: Fact.MR analysis. Updated Oct 23, 2026
Healthcare represents the largest application domain, commanding 37.0% of total industry revenue through the extensive utilization of digital imaging across radiology, cardiology, oncology, pathology, and surgical navigation. Modern hospitals utilize digital imaging systems to replace physical pathology glass slides with whole-slide digital scanning, allowing global pathologists to collaborate via cloud-based telepathology platforms. In operating theaters, digital fluorescence imaging and multi-camera optical trackers guide orthopedic and neurosurgical robotic arms with sub-millimeter precision. Industrial facilities follow closely behind, deploying non-destructive testing platforms and hyperspectral imaging systems to analyze chemical composition and moisture content in food and pharmaceutical processing. Automotive manufacturing plants integrate rugged industrial smart cameras across robotic welding stations to verify structural joint integrity in real time. Factory automation specialists also implement automated 3D machine vision cells to guide bin-picking robots handling randomly oriented metallic castings.
Which Technology captures the largest market share?
2D Imaging holds 48.1% share in 2026.
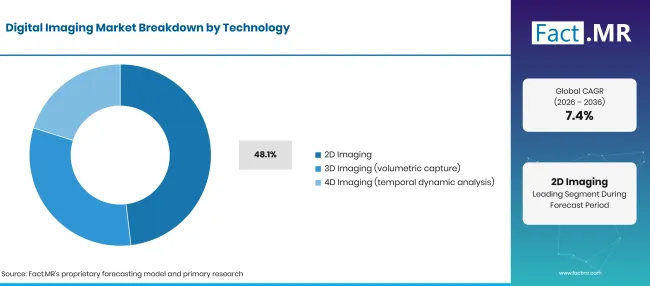
Digital Imaging Market Breakdown Technology | Source: Fact.MR
| Technology | Share (2026) |
|---|---|
| 2D Imaging (Leading segment) | 48.1% |
| Other segments combined (3D Imaging, 4D Imaging) | 51.9%* |
| Total | 100.0% |
Source: Fact.MR analysis. Updated Oct 23, 2026
Two-dimensional imaging maintains the leading single technology share at 48.1%, serving as the workhorse modality across high-speed industrial surface inspection, optical character recognition (OCR), web inspection, and standard clinical radiography. 2D area scan and line scan cameras deliver ultra-high frame rates exceeding 500 frames per second at competitive price points, making them indispensable for high-volume packaging lines and postal sorting facilities. Concurrently, 3D imaging technologies—encompassing laser line triangulation, structured light, and stereo vision—are capturing market share rapidly as robotic guidance systems require complete spatial depth data to manipulate complex geometric parts. Robot integrators deploy robotic guidance vision systems to enable intelligent pick-and-place automation in dynamic warehouse environments. Embedded vision architects utilize compact edge vision processors to run convolutional neural networks directly within camera bodies without cloud latency. Commercial studios and scientific facilities also deploy high-resolution digital cameras for scientific documentation and high-precision photogrammetry. Defense and security teams incorporate thermal imaging components into multi-sensor surveillance pods for round-the-clock perimeter monitoring.
What is accelerating Digital Imaging Market adoption, and what is holding it back?
Proliferation of Industry 4.0 automation, edge AI computational imaging advances, and expanding digital healthcare diagnostics accelerate market momentum. High implementation costs for multi-camera 3D metrology, proprietary interface fragmentation, and shortage of skilled computer vision engineers restrict frictionless adoption.
Drivers Impact Analysis
| DRIVER | (~) % IMPACT ON CAGR | GEOGRAPHIC RELEVANCE | IMPACT TIMELINE |
|---|---|---|---|
| Rapid adoption of AI-enabled automated optical inspection across semiconductor manufacturing | +1.6% | East Asia, North America | Short term (<= 2 years) |
| Expansion of digital radiology and surgical robotic visualization in acute healthcare | +1.4% | North America, Europe | Short term (<= 2 years) |
| Proliferation of autonomous mobile robots (AMRs) requiring 3D depth vision guidance | +1.2% | Global | Medium term (2–4 years) |
| Integration of stacked CMOS image sensors with embedded neural processing units | +1.0% | Europe, East Asia | Medium term (2–4 years) |
| Growing commercial drone surveillance and agricultural multispectral crop monitoring | +0.8% | Latin America, North America | Long term (>= 4 years) |
Source: Fact.MR analysis. Updated Oct 23, 2026
Opportunity Impact Analysis
| OPPORTUNITY | (~) % IMPACT ON CAGR | GEOGRAPHIC RELEVANCE | IMPACT TIMELINE |
|---|---|---|---|
| Co-packaging of short-wavelength infrared (SWIR) and visible sensors in monolithic dies | +1.5% | Germany, USA, Japan | Short term (<= 2 years) |
| Cloud-connected digital pathology scanners enabling AI-assisted oncology diagnosis | +1.3% | North America, Europe | Medium term (2–4 years) |
| Standardized high-speed interface protocols (10GigE, CoaXPress 2.1) across machine vision | +1.1% | Global | Medium term (2–4 years) |
| Hyperspectral imaging deployment in automated pharmaceutical and food safety inspection | +0.9% | Europe, North America | Long term (>= 4 years) |
Source: Fact.MR analysis. Updated Oct 23, 2026
Restraints Impact Analysis
| RESTRAINT | (~) % IMPACT ON CAGR | GEOGRAPHIC RELEVANCE | IMPACT TIMELINE |
|---|---|---|---|
| Substantial capital investment requirements for multi-sensor 3D metrology integration | -1.3% | Emerging Markets | Short term (<= 2 years) |
| Extreme computational processing bottlenecks when handling uncompressed multi-megapixel video feeds | -1.0% | Global | Medium term (2–4 years) |
| Thermal dissipation challenges in compact edge vision cameras operating continuous neural models | -0.8% | Europe, North America | Medium term (2–4 years) |
| Scarcity of specialized computer vision software developers and systems integration talent | -0.6% | Global | Long term (>= 4 years) |
Source: Fact.MR analysis. Updated Oct 23, 2026
Which countries are scaling the Digital Imaging Market through 2036?
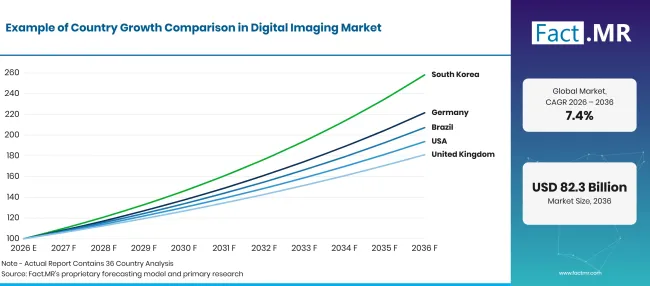
Factmr Digital Imaging Market Growth Index | Source: Fact.MR
| Country | CAGR (2026–2036) |
|---|---|
| Germany | 8.3% |
| Brazil | 7.6% |
| USA | 6.8% |
| UK | 6.1% |
| Japan | 5.4% |
Source: Fact.MR analysis. Updated Oct 23, 2026
What sustains engineering leadership in Germany?
8.3% CAGR, rooted in Germany’s premier industrial automation clusters, world-renowned optical engineering institutions, and heavy Industry 4.0 capital deployment.
Germany remains a major automation and machine-vision demand center. The International Federation of Robotics reported that Europe installed 85,000 industrial robots in 2024, the region’s second-highest annual total, while Germany remained Europe’s largest national robot market with about 27,000 installations [6]. Germany’s automotive, machinery, electronics, and precision-engineering base supports recurring demand for high-speed cameras, metrology optics, lighting, and inspection software across large factories and Mittelstand suppliers.
What opportunities are unfolding across Brazil?
7.6% CAGR, backed by agricultural drone surveying, expanding diagnostic radiology networks, and industrial factory modernization across major manufacturing hubs.
Brazil’s 2025 federal procurement record specified a turnkey computed-tomography solution with 64 channels and at least 128 reconstructed slices, including installation, complementary equipment, software, training, and maintenance requirements [7]. The specification demonstrates active modernization of public diagnostic-imaging infrastructure and supports demand for detectors, reconstruction workstations, calibration, integration, and lifecycle services.
Why is the United States leading overall market valuation?
6.8% CAGR, propelled by massive biomedical research expenditures, defense aerospace imaging programs, and domestic semiconductor manufacturing investments.
The United States represents a large digital-imaging demand base across healthcare and advanced manufacturing. A 2025 study estimated that 61.51 million U.S. patients underwent 93 million CT examinations in 2023 [8]. That procedure scale creates sustained replacement, dose-optimization, reconstruction, storage, and analytics requirements across CT hardware and software ecosystems.
How is the United Kingdom modernizing digital imaging infrastructure?
6.1% CAGR, supported by NHS digital diagnostic imaging modernization programs, thriving university AI vision spinouts, and aerospace manufacturing clusters.
NHS England’s 2025-26 Diagnostic Imaging Dataset is a monthly, patient-level collection extracted from local Radiology Information Systems and includes modality counts, request-to-test intervals, test-to-report intervals, body-site activity, and report-turnaround measures [9]. This recurring national evidence base supports radiology-capacity planning, workflow modernization, image exchange, and reporting-infrastructure investment across England.
Why does Japan maintain steady market consumption?
5.4% CAGR, anchored by undisputed global dominance in precision optical components, advanced digital camera manufacturing, and robotic automation.
Japan combines a deep imaging-component base with intensive factory automation. The International Federation of Robotics reported 44,500 industrial robot installations in Japan during 2024 and an operational stock of 450,500 units, up 3% from the prior year [10]. The scale of automated electronics, automotive, and precision-machinery production sustains demand for machine-vision cameras, optical sensors, inspection software, and high-reliability imaging components.
Who leads the Digital Imaging Market?
DJI commands undisputed market leadership in commercial and industrial aerial imaging platforms, supplying camera-equipped drones and gimbal-stabilized imaging payloads utilized globally across cinematography, industrial inspection, and agricultural mapping. Canon Inc.
brings formidable engineering prowess across digital SLR cameras, broadcast lenses, medical digital radiography systems, and semiconductor photolithography steppers. Sony Corporation stands as the premier global manufacturer of CMOS image sensors, supplying stacked Exmor and Pregius sensors that power leading smartphones, automotive ADAS cameras, and high-performance industrial machine vision systems.
Nikon Corporation and Fujifilm Holdings maintain dominant positions across precision optical systems, consumer digital cameras, and healthcare imaging diagnostics, with Nikon excelling in industrial metrology and semiconductor inspection, while Fujifilm leads in digital radiography, endoscopy, and medical AI software. Panasonic Holdings Corporation and Olympus Corporation contribute elite optical technologies, with Panasonic specializing in ruggedized broadcast video cameras and industrial sensing, while Olympus dominates the global medical gastrointestinal endoscopy market. Teledyne Technologies Incorporated, Basler AG, and Cognex Corporation represent the titans of industrial machine vision, manufacturing high-speed industrial area scan cameras, smart vision sensors, and deep learning software libraries that power automated factory floors worldwide.
Which companies are the key providers?
Key companies include DJI; Canon Inc.; Sony Corporation; Nikon Corporation; Fujifilm Holdings; Panasonic Holdings Corporation; Olympus Corporation; Teledyne Technologies Incorporated; Basler AG; and Cognex Corporation.
- DJI
- Canon Inc.
- Sony Corporation
- Nikon Corporation
- Fujifilm Holdings
- Panasonic Holdings Corporation
- Olympus Corporation
- Teledyne Technologies Incorporated
- Basler AG
- Cognex Corporation
Bibliography
- [1]Electronic Code of Federal Regulations. (2026). 21 C.F.R. pt. 892, Radiology devices. U.S. Government Publishing Office.
- [2]Electronic Code of Federal Regulations. (2026). 47 C.F.R. §§ 15.107, 15.109, Conducted and radiated emission limits. U.S. Government Publishing Office.
- [3]Zhang, X., Acosta, J. N., Yang, X., et al. (2026). Automated chest X-ray report generation remains unsolved. Pacific Symposium on Biocomputing, 31, 236–250. https://doi.org/10.1142/9789819824755_0017
- [4]International Federation of Robotics. (2025, September 25). World Robotics 2025 report: Global robot demand in factories doubles over 10 years.
- [5]Christensen, E. W., Drake, A. R., Parikh, J. R., Rubin, E. M., & Rula, E. Y. (2025). Projected US imaging utilization, 2025 to 2055. Journal of the American College of Radiology, 22(2), 151–158. https://doi.org/10.1016/j.jacr.2024.10.017
- [6]International Federation of Robotics. (2025, September 25). World Robotics 2025 report: Europe installed 85,000 industrial robots in 2024.
- [7]Portal Nacional de Contratações Públicas. (2025). Edital no. 90072/2025: Turnkey solution for a 64-channel/128-slice computed tomography system. Government of Brazil.
- [8]Smith-Bindman, R., Chu, P. W., Firdaus, H. A., et al. (2025). Projected lifetime cancer risks from current computed tomography imaging. JAMA Internal Medicine, 185(6), 710–719. https://doi.org/10.1001/jamainternmed.2025.0505
- [9]NHS England. (2026, July 23). Diagnostic Imaging Dataset 2025-26 data.
- [10]International Federation of Robotics. (2025, September 25). World Robotics 2025 report: Japan installed 44,500 industrial robots in 2024.
This Report Answers
- How does the global digital imaging market expand from USD 40.4 Billion in 2026 to USD 82.3 Billion by 2036?
- What technological innovations in stacked back-illuminated (BSI) CMOS image sensors are driving on-chip edge AI inference?
- Why does hardware command 58.3% of total industry revenue in 2026?
- How are automated 3D machine vision and robotic guidance systems transforming zero-defect manufacturing?
- What factors support Germany achieving an industry-leading 8.3% CAGR across European markets?
- How are digital radiology and whole-slide telepathology modernizing clinical diagnostic workflows across healthcare networks?
- What role do high-speed interface protocols (10GigE, CoaXPress 2.1) play in eliminating uncompressed multi-megapixel bandwidth bottlenecks?
What does the 5G Antennas Market cover?
Antennas designed to transmit and receive signals across 5G networks form the core of this market. These include omnidirectional antennas, directional arrays and small-cell antennas used in telecommunications, vehicles and connected industrial systems.
Sales are tracked across Sub-6 GHz and millimeter-wave technologies. Outdoor network installations and indoor connectivity systems are covered across commercial and industrial applications.
What is included in the scope?
5G antenna elements, massive MIMO active antenna units and beamforming antenna arrays are counted. Small-cell antennas, indoor distributed antenna systems and outdoor base station antennas are included.
Vehicle-mounted 5G antennas, private industrial network antennas and integrated antenna modules designed for 5G New Radio connections are covered. Products supporting both Sub-6 GHz and mmWave operations are also included.
What is excluded from the scope?
Antennas designed exclusively for 2G, 3G and 4G networks fall outside the revenue boundary. Standalone Wi-Fi, Bluetooth, GPS and satellite antennas without 5G functionality are excluded.
Core network servers, fiber-optic cables and separate network management software are not counted. Smartphones, connected vehicles and complete industrial machines are excluded as finished products, apart from qualifying 5G antenna components.
How Was the Analysis Built?
The analysis draws on 120+ sources, 35+ company portfolios, 25+ countries, and more than 20 industry interviews.
- Primary Research: Primary research includes discussions with manufacturers, service providers, technology developers, distributors, end users, and subject-matter experts. These conversations examine purchasing priorities, product adoption, operational challenges, approval requirements, competitive positioning, and the factors that influence wider market acceptance.
- Desk Research: Desk research covers government statistics, regulatory publications, company filings, trade data, technical studies, industry associations, standards, public policy, and other authoritative sources. Every source used in the analysis is documented in the bibliography.
- Market Sizing and Forecasting: Market estimates combine historical performance, demand indicators, pricing and volume trends, segment shares, company participation, country-level growth, adoption patterns, investment activity, and barriers to market expansion.
- Data Validation and Update Cycle: Findings are validated by comparing primary interviews with public data, company activity, regulatory changes, trade patterns, and industry developments. Regular updates review new product launches, capacity changes, partnerships, approvals, and shifts in commercial adoption.
Segmentation
What is the report’s scope and coverage?
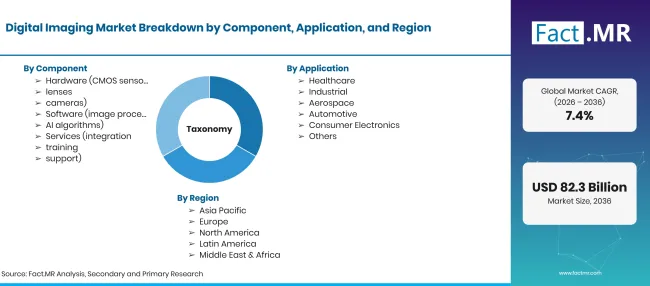
Digital Imaging Market Taxonomy | Source: Fact.MR
| Attribute | Details |
|---|---|
| Quantitative Units | USD Billion |
| Market Definition | Commercial sales of digital image acquisition hardware, image processing software, and systems integration services across industrial machine vision, medical diagnostic radiology, and consumer electronics. |
| Component | Hardware (CMOS Sensors, Lenses, Cameras); Software (Image Processing, AI Algorithms); Services (Integration, Training, Support) |
| Application | Healthcare; Industrial; Aerospace; Automotive; Consumer Electronics; Others |
| Technology | 2D Imaging; 3D Imaging; 4D Imaging |
| End-User | Manufacturing; BFSI; Healthcare Institutions; Retail; IT and Telecommunications; Others |
| Regions Covered | North America; Latin America; Western Europe; Eastern Europe; East Asia; South Asia & Pacific; Middle East & Africa |
| Countries Covered | Germany; Brazil; USA; UK; Japan |
| Companies Profiled | DJI; Canon Inc.; Sony Corporation; Nikon Corporation; Fujifilm Holdings; Panasonic Holdings Corporation; Olympus Corporation; Teledyne Technologies Incorporated; Basler AG; Cognex Corporation |
| Forecast Period | 2026 to 2036 |
| Approach | Primary research interviews with optical sensor engineers, machine vision system integrators, and clinical radiology administrators combined with semiconductor foundry wafer shipment verifications. |
Source: Fact.MR analysis. Updated Oct 23, 2026
How is the market segmented?
-
By Component
- Hardware (CMOS Sensors, Lenses, Cameras)
- Software (Image Processing, AI Algorithms)
- Services (Integration, Training, Support)
-
By Application
- Healthcare
- Industrial
- Aerospace
- Automotive
- Consumer Electronics
- Others
-
By Technology
- 2D Imaging
- 3D Imaging
- 4D Imaging
-
By End-User
- Manufacturing
- BFSI
- Healthcare Institutions
- Retail
- IT and Telecommunications
- Others
-
By Region
- North America
- Latin America
- Western Europe
- Eastern Europe
- East Asia
- South Asia & Pacific
- Middle East & Africa
Frequently Asked Questions
What is the projected valuation of the Digital Imaging Market by 2036?
Which component represents the largest revenue share in the market?
What is the primary application driving digital imaging adoption?
Which country is projected to record the highest growth rate during the forecast period?
Who is the leading player in the global digital imaging market?
Who worked on this report


Preview the report firsthand - request a free sample
Free SampleGet the brochure for pricing and purchase details
Download PDF