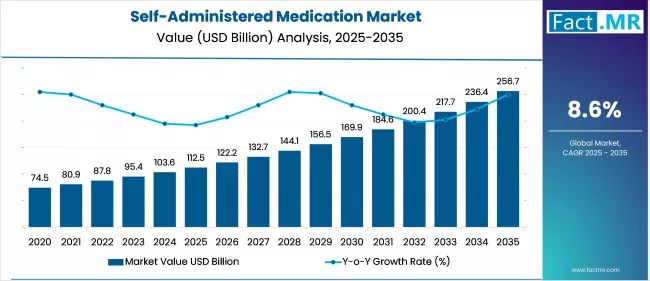
Self-Administered Medication Market
Self-Administered Medication Market Analysis, By Product Type, By Formulation, By Application, By Sales Channel, and Region - Market Insights 2025 to 2035
Analysis Of Self-Administered Medication Market Covering 30+ Countries Including Analysis Of US, Canada, UK, Germany, France, Nordics, GCC Countries, Japan, Korea And Many More
Self-Administered Medication Market Outlook (2025 to 2035)
The global self-administered medication market is projected to increase from USD 112.5 billion in 2025 to USD 256.7 billion by 2035, with a CAGR of 8.6%, driven by the growing burden of chronic conditions such as diabetes, asthma, cardiovascular diseases, and autoimmune disorders, which is increasing the demand for self-administered therapies. Their use makes it ideal for patients seeking convenient, cost-effective, and independent disease management in home-based care settings.
What are the Drivers of Self-Administered Medication Market?
The growing global prevalence of chronic diseases such as diabetes, asthma, rheumatoid arthritis, and cardiovascular conditions drives the growth of the self-administered medication market. These illnesses often require long-term or lifelong treatment, prompting a shift toward convenient and cost-effective medication options that can be managed independently by patients.
With rising healthcare costs and the need to alleviate the burden on hospitals and clinics, self-administered therapies are becoming a vital component of chronic disease management strategies worldwide. This trend is particularly evident in aging populations, which are more likely to require ongoing medication and often face challenges accessing healthcare facilities.
The integration of digital tools, such as Bluetooth-enabled injectors and adherence-monitoring apps, has further enhanced treatment compliance and improved patient outcomes. These innovations support a broader shift toward patient-centric care models, empowering individuals to take greater control over their health from the comfort of their homes.
Supportive regulatory policies and increased access to biologics and biosimilars have fueled market growth. Agencies such as the FDA and EMA are approving more subcutaneous formulations and home-use drugs, while payers are increasingly reimbursing self-administered treatments to reduce overall healthcare expenditures.
Moreover, growing patient awareness, education programs, and pharmaceutical support services are helping to expand the market reach across both developed and developing regions. As self-care becomes increasingly integrated into mainstream healthcare, the self-administered medication market is poised for sustained growth in the years to come.
What are the Regional Trends of Self-Administered Medication Market?
North America, particularly the U.S., dominates the global self-administered medication market. A high prevalence of chronic diseases, well-established healthcare infrastructure, and strong patient awareness drive this. The U.S. market benefits from early adoption of advanced drug delivery technologies such as autoinjectors and wearable injectors, as well as favorable reimbursement policies that encourage home treatment.
Europe region emphasizes patient-centric care and cost containment within national health services, both of which support the transition to self-administered therapies. There is also a high rate of acceptance of biosimilars, which are often designed for self-injection. EU regulations encourage decentralized care, and several pilot programs across countries are integrating digital health tools with home-based treatment solutions, boosting the demand for self-administration.
The Asia Pacific region is expected to experience the fastest growth in the coming years, driven by rising chronic disease rates, improved healthcare access, and increasing investments in digital health infrastructure. Countries like China, India, Japan, and South Korea are witnessing a surge in health awareness and are increasingly adopting portable, user-friendly drug delivery devices. Japan, in particular, with its rapidly aging population, is a major adopter of self-administered medication. However, market growth is sometimes limited by affordability and a lack of consistent insurance coverage in lower-income regions.
In the Middle East and Southeast Asia, adoption of self-use medication solutions is growing due to rising chronic disease burden and urbanization. However, limited awareness, weak distribution networks, and inadequate healthcare funding continue to challenge market penetration in rural and low-income areas. Increasing public health campaigns and government interest in digital and home care solutions could lead to accelerated adoption in these regions over time.
What are the Challenges and Restraining Factors of Self-Administered Medication Market?
A major barrier to self-administered medication is the lack of patient confidence, knowledge, or skill in handling drug delivery devices, especially injectables. Many patients, particularly the elderly, those with limited health literacy, or those with cognitive/physical impairments, may struggle to use devices correctly without professional assistance. Errors in dose administration, timing, or technique can reduce therapeutic effectiveness and pose safety risks. While pharmaceutical companies do offer training programs, these are often underutilized or inaccessible in rural and underserved areas.
While self-administration can reduce healthcare costs over time, the initial investment in advanced drug delivery systems, such as autoinjectors, wearable infusers, and digital health-enabled devices, can be expensive. These high upfront costs may be unaffordable for many patients in low- and middle-income countries, as well as for those without adequate insurance coverage.
Certain biologics and specialty medications require strict storage conditions (e.g., refrigeration), handling precautions, and timely administration, which can be difficult to maintain at home. Improper storage or administration can compromise the efficacy or safety of the drug, potentially leading to adverse outcomes. This concern is particularly pronounced in areas with inadequate infrastructure, such as limited access to refrigeration or proper medical waste disposal systems. It also adds regulatory complexity to the approval of home-use formulations.
In rural or resource-limited regions, access to self-administered therapies is hindered by poor healthcare infrastructure, limited digital literacy, and low awareness of available options. Distribution challenges, supply chain disruptions, and a lack of patient support systems can prevent consistent access to medication and training. These barriers reinforce health disparities and slow market adoption in developing regions.
Country-Wise Outlook
U.S. Self-Administered Medication Market sees Growth Driven by Growing Prevalence of Chronic Diseases
The self-administered medication market in the U.S. is experiencing steady and significant growth, driven by a convergence of technological innovation, healthcare cost pressures, and increasing prevalence of chronic diseases. With a well-established healthcare infrastructure and a highly aware patient population, the U.S. remains a global leader in the adoption and development of self-use drug delivery systems.
One of the key drivers of U.S. market growth is the widespread use of biologics and specialty drugs for treating conditions such as diabetes, multiple sclerosis, rheumatoid arthritis, and cancer. Many of these treatments are now available in subcutaneous formulations designed for self-injection using autoinjectors or wearable injectors. The U.S. Food and Drug Administration (FDA) has been supportive of self-administered therapies, streamlining approval processes and expanding indications for at-home use.
Accelerated shift toward remote and home-based care, reinforcing the demand for self-administered medications. Post-pandemic, this shift has remained, with patients preferring the flexibility, safety, and convenience of managing their medications at home. The integration of smart devices and digital health platforms in the U.S., such as connected autoinjectors with mobile tracking apps, has also enhanced patient adherence and monitoring, further driving market adoption.
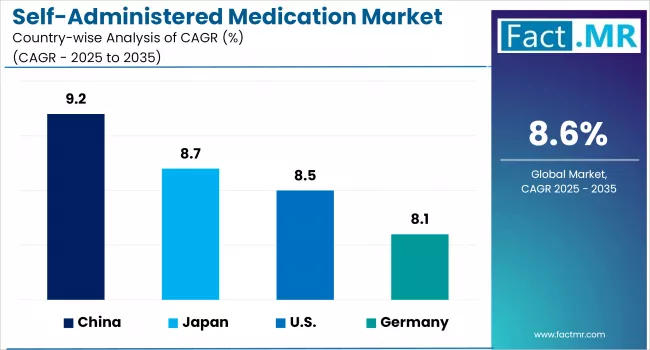
China witnesses Rapid Market Growth Backed by Growing Government Initiatives to Promote Advanced Therapies
The self-administered medication market in China is experiencing robust growth, driven by strong government support, increasing prevalence of chronic diseases, and rapid adoption of digital healthcare. China faces a rapidly increasing incidence of chronic diseases such as diabetes, cardiovascular conditions, asthma, and autoimmune disorders. With over 140 million diabetics and a growing aging population, the demand for long-term, easily manageable medication regimens has surged. Self-administered medications offer a practical solution for managing such conditions outside hospital settings.
The Chinese government’s initiatives under Healthy China 2030 and the expansion of national reimbursement drug lists (NRDL) are promoting access to advanced therapies, including self-injectable biologics and biosimilars. Moreover, reforms aimed at decentralizing care and encouraging home-based treatment directly support the self-administered medication model.
China is experiencing rapid urban growth and a significant increase in its elderly population, both of which are driving a steep rise in healthcare demands. Older adults, in particular, benefit from self-administered therapies that reduce dependency on hospitals and offer convenience in medication delivery, especially for conditions like osteoporosis, hypertension, and arthritis.
Chinese pharmaceutical and medtech companies are investing heavily in smart injectors, wearable devices, and needle-free systems tailored for local needs. These innovations enhance patient comfort, minimize administration errors, and are increasingly integrated with digital health platforms, which facilitate tracking adherence and remind patients to take their medications.
With growing public health campaigns, mobile health applications, and broader access to health education, Chinese patients are becoming more informed and proactive about managing their health. This shift in mindset is fueling the adoption of self-managed therapies, especially among younger, tech-savvy urban populations.
Japan sees Growing Aging Population Fuels Demand for Self-Administered Medication
The self-administered medication market in Japan is experiencing notable growth, primarily fueled by its rapidly aging population and increasing prevalence of chronic diseases such as diabetes, rheumatoid arthritis, and cardiovascular conditions. As one of the most rapidly aging societies in the world, with over 28% of its population aged 65 or older, Japan faces a growing demand for convenient, at-home treatment options that reduce dependence on hospital visits.
Japan's healthcare system, backed by universal health coverage and progressive regulatory policies, is highly supportive of patient-centered innovations. The Pharmaceuticals and Medical Devices Agency (PMDA) encourages the use of rapid approval pathways for combination products and advanced drug delivery systems, which have accelerated the availability of self-injection biologics for autoimmune and metabolic disorders.
Moreover, Japan’s national insurance system offers broad reimbursement coverage for many of these devices and therapies, thereby encouraging their adoption among both healthcare providers and patients. Technological innovation plays a pivotal role in market growth. Japanese manufacturers and global medtech firms are investing in ergonomic, discreet, and digitally integrated self-injection devices tailored for the local population.
The Japanese market has also benefited from increasing health awareness, improved patient education, and the digitalization of healthcare services. These factors have made patients more receptive to managing their treatments.
Category-wise Analysis
Oral Self-Administered to Exhibit Leading by Product Type
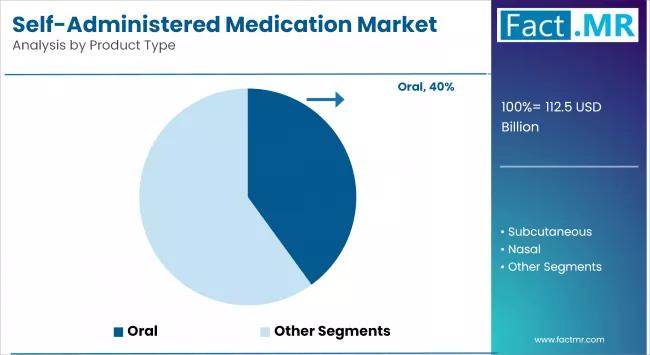
The oral segment currently dominates the self-administered medication market, accounting for the largest revenue share. This dominance is primarily attributed to the convenience, familiarity, and non-invasive nature of oral drug administration, making it the most preferred route for both patients and healthcare providers. The availability of a vast range of formulations (e.g., tablets, capsules, dissolvable strips) and robust distribution through pharmacies and online channels further supports the segment's strong market position. Moreover, oral medications often have lower manufacturing and storage costs compared to injectable or device-based therapies, enhancing their accessibility.
The subcutaneous segment is projected to be the fastest-growing product type in the forecast period. This growth is driven by the rising use of biologics and specialty drugs, particularly for conditions such as rheumatoid arthritis, multiple sclerosis, diabetes, and cancer, which often require regular and precise dosing. The increasing adoption of autoinjectors, pen injectors, and wearable drug delivery systems, along with growing regulatory approvals for home-use biologics, is accelerating demand in this segment.
Solid Self-Administered to Exhibit Leading by Formulation
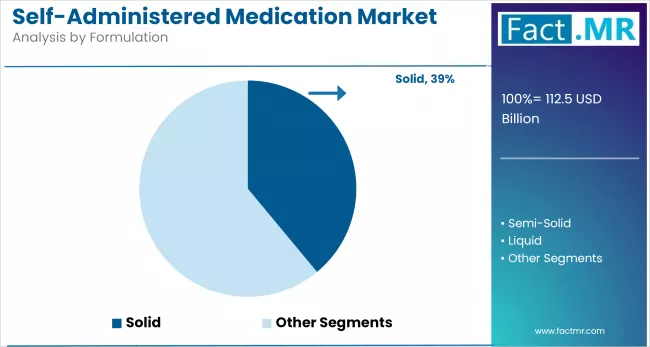
The liquid self-administered medication segment holds the largest market share and dominates the formulation category. This dominance is largely driven by the widespread use of injectable and inhalable medications in liquid form, particularly for chronic and acute conditions such as diabetes, asthma, autoimmune diseases, and cancer. The increasing availability of prefilled syringes, autoinjectors, wearable injectors, and nebulizers has significantly enhanced the ease and safety of self-administration.
The solid self-administered medication segment is projected to be the fastest-growing formulation type over the forecast period. This growth is fueled by the expanding demand for oral solid dosage forms such as tablets, capsules, and oral dissolvable strips, especially for chronic conditions requiring long-term therapy. The rise of online pharmacies, telehealth prescriptions, and direct-to-patient delivery models is further supporting the growth of this segment, making solid formulations more accessible and preferred for self-administration.
Diabetes to Exhibit Leading by Application
The diabetes segment dominates the self-administered medication market by application. This is primarily driven by the high global prevalence of diabetes, especially Type 1 and insulin-dependent Type 2 diabetes, which require frequent and lifelong medication management. The widespread use of insulin pens, insulin pumps, and continuous glucose monitoring systems, many of which support self-injection and self-regulation, has fueled this segment's growth.
Technological advancements in smart insulin delivery devices, government initiatives for diabetes care, and patient preference for at-home management are further contributing to the segment's leading position. Moreover, pharmaceutical companies have developed user-friendly self-administered insulin products that improve treatment adherence and reduce hospital dependency.
The osteoporosis segment is expected to be the fastest-growing application segment in the forecast period. This growth is largely attributed to the rising geriatric population, particularly in regions such as Japan, Europe, and North America, where aging-related bone density loss is prevalent.
Self-administered medications such as parathyroid hormone analogs and monoclonal antibodies (e.g., denosumab), which are commonly delivered via subcutaneous injection, have become increasingly popular due to their convenient dosing schedules (e.g., once monthly or biannually). The growing awareness around bone health, increased screening for osteoporosis, and advancements in self-injection devices tailored for elderly patients are accelerating demand in this segment.
Online Sales to Exhibit Leading by Sales Channel
Online sales hold the largest share in the sales channel segment, driven by the growing adoption of e-commerce platforms, convenience of home delivery, and increasing digital health awareness. Consumers and institutions prefer online platforms for price comparisons, easy refills, and access to a wide range of products, especially in urban areas.
Offline sales, through hospital pharmacies, retail pharmacies, and other physical channels, are experiencing rapid growth due to the provision of personalized services, immediate availability, and professional guidance. In emerging markets, the expansion of brick-and-mortar pharmacies and government healthcare initiatives is further boosting foot traffic and driving offline demand.
Competitive Analysis
The self-administered medication market is highly becoming increasingly competitive, with a strong presence of global pharmaceutical companies, medical device manufacturers, and emerging biotech firms. The market is shaped by intense R&D activity, strategic partnerships, product launches, and growing investments in advanced drug delivery technologies. Leading players compete primarily on device innovation, therapeutic breadth, patient convenience, and pricing strategies.
Companies focus heavily on developing combination products, therapies bundled with self-injection devices like autoinjectors, prefilled syringes, and wearable injectors, to simplify administration and improve patient adherence. Many of the companies also invest in digital health tools, such as Bluetooth-enabled devices and companion apps, to support treatment tracking and remote monitoring.
The competitive landscape is also witnessing the rise of biosimilar manufacturers and regional pharmaceutical firms, particularly in emerging markets such as China and India. These players are expanding access to self-administered biologics at lower costs, challenging the dominance of traditional drug makers. In response, global leaders are increasingly adopting value-based pricing, patient assistance programs, and strategic acquisitions to maintain market share. Overall, innovation in drug delivery, a patient-centered approach, and geographic expansion remain the key competitive strategies shaping the future of this market.
Key players in the market are Abbott Laboratories, Purdue Pharma LP, Sanofi S.A, Pfizer Inc., Mylan N.V., Novartis AG; Amgen Inc., and other players.
Recent Development
- In May 2025, the U.S. Food and Drug Administration (FDA) approved Brekiya™ (dihydroergotamine mesylate) injection, an autoinjector developed by Amneal Pharmaceuticals, Inc. This marks the first and only dihydroergotamine (DHE) autoinjector approved for the acute treatment of migraine (with or without aura) and cluster headaches in adults.
- In December 2024, the U.S. Food and Drug Administration (FDA) approved Alhemo (concizumab-mtci), a routine prophylactic injection for adults and pediatric patients aged 12 years and older with hemophilia A with factor VIII inhibitors or hemophilia B with factor IX inhibitors
Segmentation of Self-Administered Medication Market
-
By Product Type :
- Oral
- Subcutaneous
- Nasal
- Transdermal
-
By Formulation :
- Solid Self-Administered Medication
- Semi-Solid Self-Administered Medication
- Liquid Self-Administered Medication
-
By Application :
- Cardiovascular Diseases
- Diabetes
- Osteoporosis
- Pain Management
- Hormone Replacement
- Others
-
By Sales Channel :
- Online Sales
- Offline Sales
- Hospital Pharmacies
- Retail Pharmacies
- Other Sales Channel
-
By Region :
- North America
- Latin America
- Western Europe
- Eastern Europe
- East Asia
- South Asia & Pacific
- Middle East & Africa
Table of Content
- Executive Summary
- Global Market Outlook
- Demand-side Trends
- Supply-side Trends
- Technology Roadmap Analysis
- Analysis and Recommendations
- Market Overview
- Market Coverage / Taxonomy
- Market Definition / Scope / Limitations
- Market Background
- Market Dynamics
- Drivers
- Restraints
- Opportunity
- Trends
- Scenario Forecast
- Demand in Optimistic Scenario
- Demand in Likely Scenario
- Demand in Conservative Scenario
- Opportunity Map Analysis
- Product Life Cycle Analysis
- Supply Chain Analysis
- Supply Side Participants and their Roles
- Producers
- Mid-Level Participants (Traders/ Agents/ Brokers)
- Wholesalers and Distributors
- Value Added and Value Created at Node in the Supply Chain
- List of Medicine Suppliers
- List of Existing and Potential Buyers
- Supply Side Participants and their Roles
- Investment Feasibility Matrix
- Value Chain Analysis
- Profit Margin Analysis
- Wholesalers and Distributors
- Retailers
- PESTLE and Porter’s Analysis
- Regulatory Landscape
- By Key Regions
- By Key Countries
- Production and Consumption Statistics
- Import and Export Statistics
- Market Dynamics
- Global Market Analysis 2020-2024 and Forecast, 2025-2035
- Historical Market Size Value (USD Bn) & Volume (Mn Units) Analysis, 2020-2024
- Current and Future Market Size Value (USD Bn) & Volume (Mn Units) Projections, 2025-2035
- Y-o-Y Growth Trend Analysis
- Absolute $ Opportunity Analysis
- Global Market Pricing Analysis 2020-2024 and Forecast 2025-2035
- Global Market Analysis 2020-2024 and Forecast 2025-2035, By Product Type
- Introduction / Key Findings
- Historical Market Size Value (USD Bn) & Volume (Mn Units) Analysis By Product Type, 2020-2024
- Current and Future Market Size Value (USD Bn) & Volume (Mn Units) Analysis and Forecast By Product Type, 2025-2035
- Oral
- Subcutaneous
- Nasal
- Transdermal
- Y-o-Y Growth Trend Analysis By Product Type, 2020-2024
- Absolute $ Opportunity Analysis By Product Type, 2025-2035
- Global Market Analysis 2020-2024 and Forecast 2025-2035, By Formulation
- Introduction / Key Findings
- Historical Market Size Value (USD Bn) & Volume (Mn Units) Analysis By Formulation, 2020-2024
- Current and Future Market Size Value (USD Bn) & Volume (Mn Units) Analysis and Forecast By Formulation, 2025-2035
- Solid Self-Administered Medication
- Semi-Solid Self-Administered Medication
- Liquid Self-Administered Medication
- Y-o-Y Growth Trend Analysis By Formulation, 2020-2024
- Absolute $ Opportunity Analysis By Formulation, 2025-2035
- Global Market Analysis 2020-2024 and Forecast 2025-2035, By Application
- Introduction / Key Findings
- Historical Market Size Value (USD Bn) & Volume (Mn Units) Analysis By Application, 2020-2024
- Current and Future Market Size Value (USD Bn) & Volume (Mn Units) Analysis and Forecast By Application, 2025-2035
- Cardiovascular Diseases
- Diabetes
- Osteoporosis
- Pain Management
- Hormone Replacement
- Others
- Y-o-Y Growth Trend Analysis By Application, 2020-2024
- Absolute $ Opportunity Analysis By Application, 2025-2035
- Global Market Analysis 2020-2024 and Forecast 2025-2035, By Sales Channel
- Introduction / Key Findings
- Historical Market Size Value (USD Bn) & Volume (Mn Units) Analysis By Sales Channel, 2020-2024
- Current and Future Market Size Value (USD Bn) & Volume (Mn Units) Analysis and Forecast By Sales Channel, 2025-2035
- Online Sales
- Offline Sales
- Hospital Pharmacies
- Retail Pharmacies
- Other Sales Channel
- Y-o-Y Growth Trend Analysis By Sales Channel, 2020-2024
- Absolute $ Opportunity Analysis By Sales Channel, 2025-2035
- Global Market Analysis 2020-2024 and Forecast 2025-2035, By Region
- Introduction
- Historical Market Size Value (USD Bn) & Volume (Mn Units) Analysis By Region, 2020-2024
- Current Market Size Value (USD Bn) & Volume (Mn Units) Analysis and Forecast By Region, 2025-2035
- North America
- Latin America
- Western Europe
- East Asia
- South Asia Pacific
- Eastern Europe
- Middle East & Africa
- Market Attractiveness Analysis By Region
- North America Market Analysis 2020-2024 and Forecast 2025-2035, By Country
- Historical Market Size Value (USD Bn) & Volume (Mn Units) Trend Analysis By Market Taxonomy, 2020-2024
- Market Size Value (USD Bn) & Volume (Mn Units) Forecast By Market Taxonomy, 2025-2035
- By Country
- U.S.
- Canada
- Mexico
- By Product Type
- By Formulation
- By Application
- By Sales Channel
- By Country
- Market Attractiveness Analysis
- By Country
- By Product Type
- By Formulation
- By Application
- By Sales Channel
- Key Takeaways
- Latin America Market Analysis 2020-2024 and Forecast 2025-2035, By Country
- Historical Market Size Value (USD Bn) & Volume (Mn Units) Trend Analysis By Market Taxonomy, 2020-2024
- Market Size Value (USD Bn) & Volume (Mn Units) Forecast By Market Taxonomy, 2025-2035
- By Country
- Brazil
- Chile
- Rest of Latin America
- By Product Type
- By Formulation
- By Application
- By Sales Channel
- By Country
- Market Attractiveness Analysis
- By Country
- By Product Type
- By Formulation
- By Application
- By Sales Channel
- Key Takeaways
- Western Europe Market Analysis 2020-2024 and Forecast 2025-2035, By Country
- Historical Market Size Value (USD Bn) & Volume (Mn Units) Trend Analysis By Market Taxonomy, 2020-2024
- Market Size Value (USD Bn) & Volume (Mn Units) Forecast By Market Taxonomy, 2025-2035
- By Country
- Germany
- Italy
- France
- U.K.
- Spain
- Russia
- BENELUX
- Rest of Europe
- By Product Type
- By Formulation
- By Application
- By Sales Channel
- By Country
- Market Attractiveness Analysis
- By Country
- By Product Type
- By Formulation
- By Application
- By Sales Channel
- Key Takeaways
- East Asia Market Analysis 2020-2024 and Forecast 2025-2035, By Country
- Historical Market Size Value (USD Bn) & Volume (Mn Units) Trend Analysis By Market Taxonomy, 2020-2024
- Market Size Value (USD Bn) & Volume (Mn Units) Forecast By Market Taxonomy, 2025-2035
- By Country
- China
- Japan
- South Korea
- By Product Type
- By Formulation
- By Application
- By Sales Channel
- By Country
- Market Attractiveness Analysis
- By Country
- By Product Type
- By Formulation
- By Application
- By Sales Channel
- Key Takeaways
- South Asia Pacific Market Analysis 2020-2024 and Forecast 2025-2035, By Country
- Historical Market Size Value (USD Bn) & Volume (Mn Units) Trend Analysis By Market Taxonomy, 2020-2024
- Market Size Value (USD Bn) & Volume (Mn Units) Forecast By Market Taxonomy, 2025-2035
- By Country
- India
- ASEAN Countries
- Australia & New Zealand
- Rest of South Asia Pacific
- By Product Type
- By Formulation
- By Application
- By Sales Channel
- By Country
- Market Attractiveness Analysis
- By Country
- By Product Type
- By Formulation
- By Application
- By Sales Channel
- Key Takeaways
- Eastern Europe Market Analysis 2020-2024 and Forecast 2025-2035, By Country
- Historical Market Size Value (USD Bn) & Volume (Mn Units) Trend Analysis By Market Taxonomy, 2020-2024
- Market Size Value (USD Bn) & Volume (Mn Units) Forecast By Market Taxonomy, 2025-2035
- By Country
- Russia
- Poland
- Hungary
- Balkan & Baltics
- Rest of Eastern Europe
- By Product Type
- By Formulation
- By Application
- By Sales Channel
- By Country
- Market Attractiveness Analysis
- By Country
- By Product Type
- By Formulation
- By Application
- By Sales Channel
- Key Takeaways
- Middle East & Africa Market Analysis 2020-2024 and Forecast 2025-2035, By Country
- Historical Market Size Value (USD Bn) & Volume (Mn Units) Trend Analysis By Market Taxonomy, 2020-2024
- Market Size Value (USD Bn) & Volume (Mn Units) Forecast By Market Taxonomy, 2025-2035
- By Country
- KSA
- Other GCC Countries
- Turkiye
- South Africa
- Rest of MEA
- By Product Type
- By Formulation
- By Application
- By Sales Channel
- By Country
- Market Attractiveness Analysis
- By Country
- By Product Type
- By Formulation
- By Application
- By Sales Channel
- Key Takeaways
- Key Countries Market Analysis
- U.S.
- Pricing Analysis
- Market Share Analysis, 2024
- By Product Type
- By Formulation
- By Application
- By Sales Channel
- Germany
- Pricing Analysis
- Market Share Analysis, 2024
- By Product Type
- By Formulation
- By Application
- By Sales Channel
- Japan
- Pricing Analysis
- Market Share Analysis, 2024
- By Product Type
- By Formulation
- By Application
- By Sales Channel
- France
- Pricing Analysis
- Market Share Analysis, 2024
- By Product Type
- By Formulation
- By Application
- By Sales Channel
- Canada
- Pricing Analysis
- Market Share Analysis, 2024
- By Product Type
- By Formulation
- By Application
- By Sales Channel
- U.S.
- Market Structure Analysis
- Competition Dashboard
- Competition Benchmarking
- Market Share Analysis of Top Players
- By Regional
- By Product Type
- By Formulation
- By Application
- By Sales Channel
- Competition Analysis
- Competition Deep Dive
- Abbott Laboratories
- Overview
- Product Portfolio
- Profitability by Market Segments (Product/Age /Sales Channel/Region)
- Sales Footprint
- Strategy Overview
- Marketing Strategy
- Product Strategy
- Channel Strategy
- Purdue Pharma LP
- Overview
- Product Portfolio
- Profitability by Market Segments (Product/Age /Sales Channel/Region)
- Sales Footprint
- Strategy Overview
- Marketing Strategy
- Product Strategy
- Channel Strategy
- Sanofi S.A.
- Overview
- Product Portfolio
- Profitability by Market Segments (Product/Age /Sales Channel/Region)
- Sales Footprint
- Strategy Overview
- Marketing Strategy
- Product Strategy
- Channel Strategy
- Pfizer Inc.
- Overview
- Product Portfolio
- Profitability by Market Segments (Product/Age /Sales Channel/Region)
- Sales Footprint
- Strategy Overview
- Marketing Strategy
- Product Strategy
- Channel Strategy
- Mylan N.V.
- Overview
- Product Portfolio
- Profitability by Market Segments (Product/Age /Sales Channel/Region)
- Sales Footprint
- Strategy Overview
- Marketing Strategy
- Product Strategy
- Channel Strategy
- Novartis AG
- Overview
- Product Portfolio
- Profitability by Market Segments (Product/Age /Sales Channel/Region)
- Sales Footprint
- Strategy Overview
- Marketing Strategy
- Product Strategy
- Channel Strategy
- Amgen Inc.
- Overview
- Product Portfolio
- Profitability by Market Segments (Product/Age /Sales Channel/Region)
- Sales Footprint
- Strategy Overview
- Marketing Strategy
- Product Strategy
- Channel Strategy
- Abbott Laboratories
- Competition Deep Dive
- Assumptions & Acronyms Used
- Research Methodology
List Of Table
- Table 1: Global Market Value (USD Bn) Forecast by Region, 2020 to 2035
- Table 2: Global Market Volume (Mn Units) Forecast by Region, 2020 to 2035
- Table 3: Global Market Value (USD Bn) Forecast by Product Type, 2020 to 2035
- Table 4: Global Market Volume (Mn Units) Forecast by Product Type, 2020 to 2035
- Table 5: Global Market Value (USD Bn) Forecast by Formulation, 2020 to 2035
- Table 6: Global Market Volume (Mn Units) Forecast by Formulation, 2020 to 2035
- Table 7: Global Market Value (USD Bn) Forecast by Application, 2020 to 2035
- Table 8: Global Market Volume (Mn Units) Forecast by Application, 2020 to 2035
- Table 9: Global Market Value (USD Bn) Forecast by Sales Channel, 2020 to 2035
- Table 10: Global Market Volume (Mn Units) Forecast by Sales Channel, 2020 to 2035
- Table 11: North America Market Value (USD Bn) Forecast by Country, 2020 to 2035
- Table 12: North America Market Volume (Mn Units) Forecast by Country, 2020 to 2035
- Table 13: North America Market Value (USD Bn) Forecast by Product Type, 2020 to 2035
- Table 14: North America Market Volume (Mn Units) Forecast by Product Type, 2020 to 2035
- Table 15: North America Market Value (USD Bn) Forecast by Formulation, 2020 to 2035
- Table 16: North America Market Volume (Mn Units) Forecast by Formulation, 2020 to 2035
- Table 17: North America Market Value (USD Bn) Forecast by Application, 2020 to 2035
- Table 18: North America Market Volume (Mn Units) Forecast by Application, 2020 to 2035
- Table 19: North America Market Value (USD Bn) Forecast by Sales Channel, 2020 to 2035
- Table 20: North America Market Volume (Mn Units) Forecast by Sales Channel, 2020 to 2035
- Table 21: Latin America Market Value (USD Bn) Forecast by Country, 2020 to 2035
- Table 22: Latin America Market Volume (Mn Units) Forecast by Country, 2020 to 2035
- Table 23: Latin America Market Value (USD Bn) Forecast by Product Type, 2020 to 2035
- Table 24: Latin America Market Volume (Mn Units) Forecast by Product Type, 2020 to 2035
- Table 25: Latin America Market Value (USD Bn) Forecast by Formulation, 2020 to 2035
- Table 26: Latin America Market Volume (Mn Units) Forecast by Formulation, 2020 to 2035
- Table 27: Latin America Market Value (USD Bn) Forecast by Application, 2020 to 2035
- Table 28: Latin America Market Volume (Mn Units) Forecast by Application, 2020 to 2035
- Table 29: Latin America Market Value (USD Bn) Forecast by Sales Channel, 2020 to 2035
- Table 30: Latin America Market Volume (Mn Units) Forecast by Sales Channel, 2020 to 2035
- Table 31: Western Europe Market Value (USD Bn) Forecast by Country, 2020 to 2035
- Table 32: Western Europe Market Volume (Mn Units) Forecast by Country, 2020 to 2035
- Table 33: Western Europe Market Value (USD Bn) Forecast by Product Type, 2020 to 2035
- Table 34: Western Europe Market Volume (Mn Units) Forecast by Product Type, 2020 to 2035
- Table 35: Western Europe Market Value (USD Bn) Forecast by Formulation, 2020 to 2035
- Table 36: Western Europe Market Volume (Mn Units) Forecast by Formulation, 2020 to 2035
- Table 37: Western Europe Market Value (USD Bn) Forecast by Application, 2020 to 2035
- Table 38: Western Europe Market Volume (Mn Units) Forecast by Application, 2020 to 2035
- Table 39: Western Europe Market Value (USD Bn) Forecast by Sales Channel, 2020 to 2035
- Table 40: Western Europe Market Volume (Mn Units) Forecast by Sales Channel, 2020 to 2035
- Table 41: East Asia Market Value (USD Bn) Forecast by Country, 2020 to 2035
- Table 42: East Asia Market Volume (Mn Units) Forecast by Country, 2020 to 2035
- Table 43: East Asia Market Value (USD Bn) Forecast by Product Type, 2020 to 2035
- Table 44: East Asia Market Volume (Mn Units) Forecast by Product Type, 2020 to 2035
- Table 45: East Asia Market Value (USD Bn) Forecast by Formulation, 2020 to 2035
- Table 46: East Asia Market Volume (Mn Units) Forecast by Formulation, 2020 to 2035
- Table 47: East Asia Market Value (USD Bn) Forecast by Application, 2020 to 2035
- Table 48: East Asia Market Volume (Mn Units) Forecast by Application, 2020 to 2035
- Table 49: East Asia Market Value (USD Bn) Forecast by Sales Channel, 2020 to 2035
- Table 50: East Asia Market Volume (Mn Units) Forecast by Sales Channel, 2020 to 2035
- Table 51: South Asia Pacific Market Value (USD Bn) Forecast by Country, 2020 to 2035
- Table 52: South Asia Pacific Market Volume (Mn Units) Forecast by Country, 2020 to 2035
- Table 53: South Asia Pacific Market Value (USD Bn) Forecast by Product Type, 2020 to 2035
- Table 54: South Asia Pacific Market Volume (Mn Units) Forecast by Product Type, 2020 to 2035
- Table 55: South Asia Pacific Market Value (USD Bn) Forecast by Formulation, 2020 to 2035
- Table 56: South Asia Pacific Market Volume (Mn Units) Forecast by Formulation, 2020 to 2035
- Table 57: South Asia Pacific Market Value (USD Bn) Forecast by Application, 2020 to 2035
- Table 58: South Asia Pacific Market Volume (Mn Units) Forecast by Application, 2020 to 2035
- Table 59: South Asia Pacific Market Value (USD Bn) Forecast by Sales Channel, 2020 to 2035
- Table 60: South Asia Pacific Market Volume (Mn Units) Forecast by Sales Channel, 2020 to 2035
- Table 61: Eastern Europe Market Value (USD Bn) Forecast by Country, 2020 to 2035
- Table 62: Eastern Europe Market Volume (Mn Units) Forecast by Country, 2020 to 2035
- Table 63: Eastern Europe Market Value (USD Bn) Forecast by Product Type, 2020 to 2035
- Table 64: Eastern Europe Market Volume (Mn Units) Forecast by Product Type, 2020 to 2035
- Table 65: Eastern Europe Market Value (USD Bn) Forecast by Formulation, 2020 to 2035
- Table 66: Eastern Europe Market Volume (Mn Units) Forecast by Formulation, 2020 to 2035
- Table 67: Eastern Europe Market Value (USD Bn) Forecast by Application, 2020 to 2035
- Table 68: Eastern Europe Market Volume (Mn Units) Forecast by Application, 2020 to 2035
- Table 69: Eastern Europe Market Value (USD Bn) Forecast by Sales Channel, 2020 to 2035
- Table 70: Eastern Europe Market Volume (Mn Units) Forecast by Sales Channel, 2020 to 2035
- Table 71: Middle East & Africa Market Value (USD Bn) Forecast by Country, 2020 to 2035
- Table 72: Middle East & Africa Market Volume (Mn Units) Forecast by Country, 2020 to 2035
- Table 73: Middle East & Africa Market Value (USD Bn) Forecast by Product Type, 2020 to 2035
- Table 74: Middle East & Africa Market Volume (Mn Units) Forecast by Product Type, 2020 to 2035
- Table 75: Middle East & Africa Market Value (USD Bn) Forecast by Formulation, 2020 to 2035
- Table 76: Middle East & Africa Market Volume (Mn Units) Forecast by Formulation, 2020 to 2035
- Table 77: Middle East & Africa Market Value (USD Bn) Forecast by Application, 2020 to 2035
- Table 78: Middle East & Africa Market Volume (Mn Units) Forecast by Application, 2020 to 2035
- Table 79: Middle East & Africa Market Value (USD Bn) Forecast by Sales Channel, 2020 to 2035
- Table 80: Middle East & Africa Market Volume (Mn Units) Forecast by Sales Channel, 2020 to 2035
List Of Figures
- Figure 1: Global Market Volume (Mn Units) Forecast 2020 to 2035
- Figure 2: Global Market Pricing Analysis
- Figure 3: Global Market Value (USD Bn) Forecast 2020 to 2035
- Figure 4: Global Market Value Share and BPS Analysis by Product Type, 2025 and 2035
- Figure 5: Global Market Y-o-Y Growth Comparison by Product Type, 2025 to 2035
- Figure 6: Global Market Attractiveness Analysis by Product Type
- Figure 7: Global Market Value Share and BPS Analysis by Formulation, 2025 and 2035
- Figure 8: Global Market Y-o-Y Growth Comparison by Formulation, 2025 to 2035
- Figure 9: Global Market Attractiveness Analysis by Formulation
- Figure 10: Global Market Value Share and BPS Analysis by Application, 2025 and 2035
- Figure 11: Global Market Y-o-Y Growth Comparison by Application, 2025 to 2035
- Figure 12: Global Market Attractiveness Analysis by Application
- Figure 13: Global Market Value Share and BPS Analysis by Sales Channel, 2025 and 2035
- Figure 14: Global Market Y-o-Y Growth Comparison by Sales Channel, 2025 to 2035
- Figure 15: Global Market Attractiveness Analysis by Sales Channel
- Figure 16: Global Market Value (USD Bn) Share and BPS Analysis by Region, 2025 and 2035
- Figure 17: Global Market Y-o-Y Growth Comparison by Region, 2025 to 2035
- Figure 18: Global Market Attractiveness Analysis by Region
- Figure 19: North America Market Incremental $ Opportunity, 2025 to 2035
- Figure 20: Latin America Market Incremental $ Opportunity, 2025 to 2035
- Figure 21: Western Europe Market Incremental $ Opportunity, 2025 to 2035
- Figure 22: East Asia Market Incremental $ Opportunity, 2025 to 2035
- Figure 23: South Asia Pacific Market Incremental $ Opportunity, 2025 to 2035
- Figure 24: Eastern Europe Market Incremental $ Opportunity, 2025 to 2035
- Figure 25: Middle East & Africa Market Incremental $ Opportunity, 2025 to 2035
- Figure 26: North America Market Value Share and BPS Analysis by Country, 2025 and 2035
- Figure 27: North America Market Value Share and BPS Analysis by Product Type, 2025 and 2035
- Figure 28: North America Market Y-o-Y Growth Comparison by Product Type, 2025 to 2035
- Figure 29: North America Market Attractiveness Analysis by Product Type
- Figure 30: North America Market Value Share and BPS Analysis by Formulation, 2025 and 2035
- Figure 31: North America Market Y-o-Y Growth Comparison by Formulation, 2025 to 2035
- Figure 32: North America Market Attractiveness Analysis by Formulation
- Figure 33: North America Market Value Share and BPS Analysis by Application, 2025 and 2035
- Figure 34: North America Market Y-o-Y Growth Comparison by Application, 2025 to 2035
- Figure 35: North America Market Attractiveness Analysis by Application
- Figure 36: North America Market Value Share and BPS Analysis by Sales Channel, 2025 and 2035
- Figure 37: North America Market Y-o-Y Growth Comparison by Sales Channel, 2025 to 2035
- Figure 38: North America Market Attractiveness Analysis by Sales Channel
- Figure 39: Latin America Market Value Share and BPS Analysis by Country, 2025 and 2035
- Figure 40: Latin America Market Value Share and BPS Analysis by Product Type, 2025 and 2035
- Figure 41: Latin America Market Y-o-Y Growth Comparison by Product Type, 2025 to 2035
- Figure 42: Latin America Market Attractiveness Analysis by Product Type
- Figure 43: Latin America Market Value Share and BPS Analysis by Formulation, 2025 and 2035
- Figure 44: Latin America Market Y-o-Y Growth Comparison by Formulation, 2025 to 2035
- Figure 45: Latin America Market Attractiveness Analysis by Formulation
- Figure 46: Latin America Market Value Share and BPS Analysis by Application, 2025 and 2035
- Figure 47: Latin America Market Y-o-Y Growth Comparison by Application, 2025 to 2035
- Figure 48: Latin America Market Attractiveness Analysis by Application
- Figure 49: Latin America Market Value Share and BPS Analysis by Sales Channel, 2025 and 2035
- Figure 50: Latin America Market Y-o-Y Growth Comparison by Sales Channel, 2025 to 2035
- Figure 51: Latin America Market Attractiveness Analysis by Sales Channel
- Figure 52: Western Europe Market Value Share and BPS Analysis by Country, 2025 and 2035
- Figure 53: Western Europe Market Value Share and BPS Analysis by Product Type, 2025 and 2035
- Figure 54: Western Europe Market Y-o-Y Growth Comparison by Product Type, 2025 to 2035
- Figure 55: Western Europe Market Attractiveness Analysis by Product Type
- Figure 56: Western Europe Market Value Share and BPS Analysis by Formulation, 2025 and 2035
- Figure 57: Western Europe Market Y-o-Y Growth Comparison by Formulation, 2025 to 2035
- Figure 58: Western Europe Market Attractiveness Analysis by Formulation
- Figure 59: Western Europe Market Value Share and BPS Analysis by Application, 2025 and 2035
- Figure 60: Western Europe Market Y-o-Y Growth Comparison by Application, 2025 to 2035
- Figure 61: Western Europe Market Attractiveness Analysis by Application
- Figure 62: Western Europe Market Value Share and BPS Analysis by Sales Channel, 2025 and 2035
- Figure 63: Western Europe Market Y-o-Y Growth Comparison by Sales Channel, 2025 to 2035
- Figure 64: Western Europe Market Attractiveness Analysis by Sales Channel
- Figure 65: East Asia Market Value Share and BPS Analysis by Country, 2025 and 2035
- Figure 66: East Asia Market Value Share and BPS Analysis by Product Type, 2025 and 2035
- Figure 67: East Asia Market Y-o-Y Growth Comparison by Product Type, 2025 to 2035
- Figure 68: East Asia Market Attractiveness Analysis by Product Type
- Figure 69: East Asia Market Value Share and BPS Analysis by Formulation, 2025 and 2035
- Figure 70: East Asia Market Y-o-Y Growth Comparison by Formulation, 2025 to 2035
- Figure 71: East Asia Market Attractiveness Analysis by Formulation
- Figure 72: East Asia Market Value Share and BPS Analysis by Application, 2025 and 2035
- Figure 73: East Asia Market Y-o-Y Growth Comparison by Application, 2025 to 2035
- Figure 74: East Asia Market Attractiveness Analysis by Application
- Figure 75: East Asia Market Value Share and BPS Analysis by Sales Channel, 2025 and 2035
- Figure 76: East Asia Market Y-o-Y Growth Comparison by Sales Channel, 2025 to 2035
- Figure 77: East Asia Market Attractiveness Analysis by Sales Channel
- Figure 78: South Asia Pacific Market Value Share and BPS Analysis by Country, 2025 and 2035
- Figure 79: South Asia Pacific Market Value Share and BPS Analysis by Product Type, 2025 and 2035
- Figure 80: South Asia Pacific Market Y-o-Y Growth Comparison by Product Type, 2025 to 2035
- Figure 81: South Asia Pacific Market Attractiveness Analysis by Product Type
- Figure 82: South Asia Pacific Market Value Share and BPS Analysis by Formulation, 2025 and 2035
- Figure 83: South Asia Pacific Market Y-o-Y Growth Comparison by Formulation, 2025 to 2035
- Figure 84: South Asia Pacific Market Attractiveness Analysis by Formulation
- Figure 85: South Asia Pacific Market Value Share and BPS Analysis by Application, 2025 and 2035
- Figure 86: South Asia Pacific Market Y-o-Y Growth Comparison by Application, 2025 to 2035
- Figure 87: South Asia Pacific Market Attractiveness Analysis by Application
- Figure 88: South Asia Pacific Market Value Share and BPS Analysis by Sales Channel, 2025 and 2035
- Figure 89: South Asia Pacific Market Y-o-Y Growth Comparison by Sales Channel, 2025 to 2035
- Figure 90: South Asia Pacific Market Attractiveness Analysis by Sales Channel
- Figure 91: Eastern Europe Market Value Share and BPS Analysis by Country, 2025 and 2035
- Figure 92: Eastern Europe Market Value Share and BPS Analysis by Product Type, 2025 and 2035
- Figure 93: Eastern Europe Market Y-o-Y Growth Comparison by Product Type, 2025 to 2035
- Figure 94: Eastern Europe Market Attractiveness Analysis by Product Type
- Figure 95: Eastern Europe Market Value Share and BPS Analysis by Formulation, 2025 and 2035
- Figure 96: Eastern Europe Market Y-o-Y Growth Comparison by Formulation, 2025 to 2035
- Figure 97: Eastern Europe Market Attractiveness Analysis by Formulation
- Figure 98: Eastern Europe Market Value Share and BPS Analysis by Application, 2025 and 2035
- Figure 99: Eastern Europe Market Y-o-Y Growth Comparison by Application, 2025 to 2035
- Figure 100: Eastern Europe Market Attractiveness Analysis by Application
- Figure 101: Eastern Europe Market Value Share and BPS Analysis by Sales Channel, 2025 and 2035
- Figure 102: Eastern Europe Market Y-o-Y Growth Comparison by Sales Channel, 2025 to 2035
- Figure 103: Eastern Europe Market Attractiveness Analysis by Sales Channel
- Figure 104: Middle East & Africa Market Value Share and BPS Analysis by Country, 2025 and 2035
- Figure 105: Middle East & Africa Market Value Share and BPS Analysis by Product Type, 2025 and 2035
- Figure 106: Middle East & Africa Market Y-o-Y Growth Comparison by Product Type, 2025 to 2035
- Figure 107: Middle East & Africa Market Attractiveness Analysis by Product Type
- Figure 108: Middle East & Africa Market Value Share and BPS Analysis by Formulation, 2025 and 2035
- Figure 109: Middle East & Africa Market Y-o-Y Growth Comparison by Formulation, 2025 to 2035
- Figure 110: Middle East & Africa Market Attractiveness Analysis by Formulation
- Figure 111: Middle East & Africa Market Value Share and BPS Analysis by Application, 2025 and 2035
- Figure 112: Middle East & Africa Market Y-o-Y Growth Comparison by Application, 2025 to 2035
- Figure 113: Middle East & Africa Market Attractiveness Analysis by Application
- Figure 114: Middle East & Africa Market Value Share and BPS Analysis by Sales Channel, 2025 and 2035
- Figure 115: Middle East & Africa Market Y-o-Y Growth Comparison by Sales Channel, 2025 to 2035
- Figure 116: Middle East & Africa Market Attractiveness Analysis by Sales Channel
- Figure 117: Global Market - Tier Structure Analysis
- Figure 118: Global Market - Company Share Analysis
- FAQs -
What is the Global Self-Administered Medication Market size in 2025?
The self-administered medication market is valued at USD 112.5 billion in 2025.
Who are the Major Players Operating in the Self-Administered Medication Market?
Prominent players in the market include Abbott Laboratories, Purdue Pharma LP, Sanofi S.A, Pfizer Inc., Mylan N.V., Novartis AG; and Amgen Inc.
What is the Estimated Valuation of the Self-Administered Medication Market by 2035?
The market is expected to reach a valuation of USD 256.7 billion by 2035.
What Value CAGR did the Self-Administered Medication Market Exhibit over the Last Five Years?
The historic growth rate of the self-administered market was 6.2% from 2020-2024.